Grunnleggende statistikk
| Institusjonelle eiere | 194 total, 194 long only, 0 short only, 0 long/short - change of 0,00% MRQ |
| Gjennomsnittlig porteføljeallokering | 0.0312 % - change of −4,70% MRQ |
| Institusjonelle aksjer (Long) | 24 967 498 (ex 13D/G) - change of 1,52MM shares 6,47% MRQ |
| Institusjonell verdi (Long) | $ 121 248 USD ($1000) |
Institusjonelt eierskap og aksjonærer
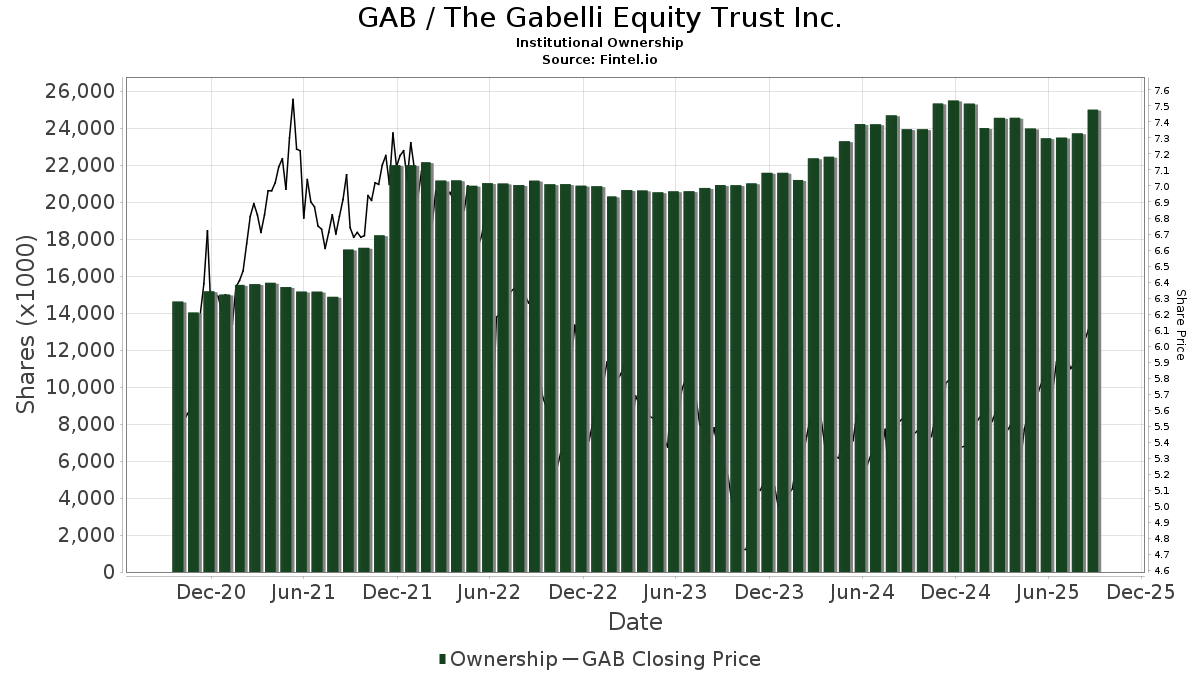
The Gabelli Equity Trust Inc. (US:GAB) har 194 institusjonelle eiere og aksjonærer som har sendt inn 13D/G- eller 13F-skjemaer til Securities Exchange Commission (SEC). Disse institusjonene eier til sammen 24,967,498 aksjer. De største aksjonærene inkluderer LPL Financial LLC, Morgan Stanley, Commonwealth Equity Services, Llc, J.w. Cole Advisors, Inc., Philadelphia Trust Co, Gamco Investors, Inc. Et Al, Cetera Investment Advisers, Raymond James Financial Inc, Bank Of America Corp /de/, and Royal Bank Of Canada .
The Gabelli Equity Trust Inc. (NYSE:GAB) institusjonell eierstruktur viser nåværende posisjoner i selskapet fordelt på institusjoner og fond, samt de siste endringene i posisjonsstørrelse. De største aksjonærene kan være individuelle investorer, verdipapirfond, hedgefond eller institusjoner. Schedule 13D indikerer at investoren eier (eller har eid) mer enn 5 % av selskapet og har til hensikt (eller hadde til hensikt) å aktivt forfølge en endring i forretningsstrategien. Schedule 13G indikerer en passiv investering på over 5 %.
The share price as of September 10, 2025 is 6,16 / share. Previously, on September 11, 2024, the share price was 5,51 / share. This represents an increase of 11,80% over that period.
Fondssentiment-score
Fondssentiment Score (også kjent som akkumulering av eierskap poengsum) viser hvilke aksjer som er mest kjøpt av fond. Den er resultatet av en sofistikert, kvantitativ flerfaktormodell som identifiserer selskaper med de høyeste nivåene av institusjonell akkumulering. Beregningsmodellen for poeng bruker en kombinasjon av den totale økningen i antall offentliggjorte eiere, endringer i porteføljeallokeringen til disse eierne og andre beregninger. Tallet går fra 0 til 100, der høyere tall indikerer en høyere grad av akkumulering i forhold til sammenlignbare selskaper, der 50 er gjennomsnittet.
Oppdateringsfrekvens: Daglig
Sjekk ut Ownership Explorer, som inneholder en liste over de høyest rangerte selskapene.
Institusjonell Put/Call-forhold
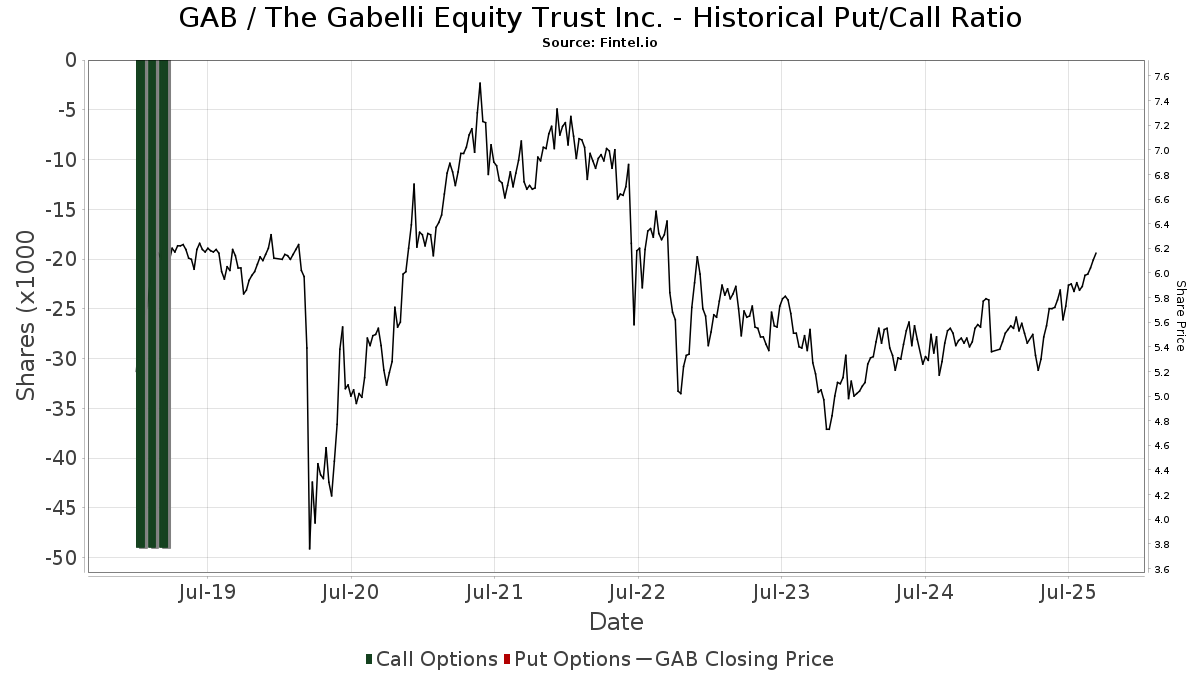
I tillegg til å rapportere standard aksje- og gjeldsemisjoner må institusjoner med mer enn 100 millioner kroner i forvaltningskapital også oppgi beholdningen av put- og callopsjoner. Siden put-opsjoner generelt indikerer et negativt sentiment, og call-opsjoner indikerer et positivt sentiment, kan vi få et inntrykk av det generelle institusjonelle sentimentet ved å plotte forholdet mellom put- og call-opsjoner. Diagrammet til høyre viser det historiske forholdet mellom put- og call-opsjoner for dette instrumentet.
Ved å bruke Put/Call-forholdet som en indikator på investorsentimentet kan man overvinne en av de viktigste svakhetene ved å bruke totalt institusjonelt eierskap, nemlig at en betydelig andel av forvaltningskapitalen investeres passivt for å følge indekser. Passivt forvaltede fond kjøper vanligvis ikke opsjoner, slik at indikatoren for put/call-forhold i større grad gjenspeiler stemningen i aktivt forvaltede fond.
13F- og NPORT-arkiveringer
Detaljer om 13F-arkiveringer er gratis. Detaljer om NP-arkiveringer krever et premium-medlemskap. Grønne rader indikerer nye posisjoner. Røde rader indikerer lukkede posisjoner. Klikk på lenke ikonet for å se hele transaksjonshistorikken.
Oppgrader
for å låse opp premiedata og eksportere til Excel. ![]() .
.
| Fildato | Kilde | Investor | Type | Gjennomsnittlig pris (estimert) |
Aksjer | Δ Aksjer (%) |
Rapportert verdi ($1000) | Verdi (%) | Portallokering (%) | |
|---|---|---|---|---|---|---|---|---|---|---|
| 2025-08-12 | 13F | MAI Capital Management | 1 166 | 0,00 | 7 | 0,00 | ||||
| 2025-08-14 | 13F | Colony Group, LLC | 12 190 | −44,35 | 71 | −41,67 | ||||
| 2025-07-23 | 13F | Kingswood Wealth Advisors, Llc | 64 836 | 4,85 | 377 | 10,88 | ||||
| 2025-08-11 | 13F | TD Waterhouse Canada Inc. | 9 150 | 0,00 | 54 | 8,16 | ||||
| 2025-08-14 | 13F | Mml Investors Services, Llc | 92 767 | −0,11 | 1 | |||||
| 2025-08-05 | 13F | Wellington Shields Capital Management, LLC | 13 857 | 0,00 | 81 | 5,26 | ||||
| 2025-07-21 | 13F | Montz Harcus Wealth Management LLC | 15 896 | 2,60 | 93 | 8,24 | ||||
| 2025-07-31 | 13F | Darden Wealth Group Inc | 57 000 | −8,06 | 332 | −2,93 | ||||
| 2025-08-14 | 13F | Ameriprise Financial Inc | 13 605 | 79 | ||||||
| 2025-08-08 | 13F | Creative Planning | 460 823 | 0,03 | 2 682 | 5,63 | ||||
| 2025-07-11 | 13F | SILVER OAK SECURITIES, Inc | 60 770 | −5,74 | 354 | −0,28 | ||||
| 2025-07-18 | 13F | PFG Investments, LLC | 92 692 | 7,10 | 539 | 13,24 | ||||
| 2025-08-08 | 13F | Cornerstone Advisors, LLC | 2 200 | 0,00 | 13 | 0,00 | ||||
| 2025-08-01 | 13F | Financial Counselors Inc | 0 | −100,00 | 0 | |||||
| 2025-08-12 | 13F | Virtu Financial LLC | 35 102 | 0 | ||||||
| 2025-08-04 | 13F | Assetmark, Inc | 648 | 0,00 | 4 | 0,00 | ||||
| 2025-07-17 | 13F | Sound Income Strategies, LLC | 104 | 0,00 | 1 | |||||
| 2025-07-16 | 13F | West Branch Capital LLC | 22 | 0,00 | 0 | |||||
| 2025-07-24 | 13F | Us Bancorp \de\ | 1 654 | 0,00 | 10 | 0,00 | ||||
| 2025-08-08 | 13F | Cetera Investment Advisers | 601 262 | 4,82 | 3 499 | 10,73 | ||||
| 2025-08-13 | 13F | Baird Financial Group, Inc. | 32 548 | 6,55 | 189 | 12,50 | ||||
| 2025-08-22 | NP | Cornerstone Strategic Value Fund Inc | 2 200 | 0,00 | 13 | 0,00 | ||||
| 2025-07-24 | 13F | IFP Advisors, Inc | 2 170 | −13,20 | 13 | −7,69 | ||||
| 2025-08-14 | 13F | CoreCap Advisors, LLC | 9 562 | −23,49 | 56 | −19,12 | ||||
| 2025-07-21 | 13F | Empirical Financial Services, LLC d.b.a. Empirical Wealth Management | 114 937 | 0,00 | 669 | 5,53 | ||||
| 2025-08-14 | 13F | Raymond James Financial Inc | 554 382 | 8,08 | 3 227 | 14,15 | ||||
| 2025-07-01 | 13F | Kera Capital Partners, Inc. | 105 780 | 0,00 | 616 | 5,67 | ||||
| 2025-08-15 | 13F | Morgan Stanley | 2 464 758 | 1,64 | 14 345 | 7,36 | ||||
| 2025-08-11 | 13F | Private Advisor Group, LLC | 179 301 | −5,06 | 1 044 | 0,29 | ||||
| 2025-05-02 | 13F | Capital A Wealth Management, LLC | 0 | −100,00 | 0 | |||||
| 2025-07-15 | 13F | Beacon Investment Advisory Services, Inc. | 19 000 | 0,00 | 111 | 5,77 | ||||
| 2025-08-06 | 13F | Wedbush Securities Inc | 113 984 | −6,17 | 1 | |||||
| 2025-08-06 | 13F | Pekin Hardy Strauss, Inc. | 27 879 | 2,39 | 162 | 8,00 | ||||
| 2025-04-28 | 13F | Mutual Advisors, LLC | 0 | −100,00 | 0 | −100,00 | ||||
| 2025-08-12 | 13F | Global Retirement Partners, LLC | 1 902 | 9,06 | 11 | 22,22 | ||||
| 2025-08-05 | 13F | American Capital Advisory, LLC | 2 525 | 0,00 | 15 | 7,69 | ||||
| 2025-08-13 | 13F | Guggenheim Capital Llc | 358 969 | 38,61 | 2 089 | 46,39 | ||||
| 2025-07-16 | 13F | Novem Group | 10 489 | 0,00 | 61 | 7,02 | ||||
| 2025-07-14 | 13F | Golden State Equity Partners | 95 820 | −1,40 | 558 | 4,11 | ||||
| 2025-08-14 | 13F | Royal Bank Of Canada | 527 685 | 2,16 | 3 071 | 7,91 | ||||
| 2025-08-14 | 13F | Wells Fargo & Company/mn | 455 912 | −0,33 | 2 653 | 5,28 | ||||
| 2025-04-25 | 13F | Smallwood Wealth Investment Management, LLC | 1 125 | 6 | ||||||
| 2025-07-25 | 13F | LRI Investments, LLC | 16 347 | 0,00 | 95 | 5,56 | ||||
| 2025-08-06 | 13F | Savant Capital, LLC | 12 297 | 0,00 | 72 | 5,97 | ||||
| 2025-08-11 | 13F | HighTower Advisors, LLC | 71 096 | 0,44 | 414 | 5,90 | ||||
| 2025-08-14 | 13F | Citadel Advisors Llc | 25 675 | −3,44 | 149 | 2,05 | ||||
| 2025-07-30 | 13F | Insight Advisors, LLC/ PA | 21 842 | 0,00 | 127 | 5,83 | ||||
| 2025-07-17 | 13F | Eagle Wealth Strategies Llc | 18 624 | 0,00 | 108 | 5,88 | ||||
| 2025-08-14 | 13F | TCG Advisory Services, LLC | 15 203 | 0,00 | 88 | 6,02 | ||||
| 2025-07-15 | 13F | Fifth Third Bancorp | 4 000 | −9,32 | 23 | −4,17 | ||||
| 2025-07-25 | 13F | Johnson Investment Counsel Inc | 15 129 | −3,71 | 88 | 2,33 | ||||
| 2025-07-28 | 13F | Evernest Financial Advisors, LLC | 19 855 | −45,91 | 116 | −43,07 | ||||
| 2025-07-21 | 13F | Cornell Pochily Investment Advisors, Inc. | 29 580 | 172 | ||||||
| 2025-08-12 | 13F | Leigh Baldwin & Co., Llc | 86 084 | 0,00 | 501 | 5,70 | ||||
| 2025-05-15 | 13F | Glenmede Trust Co Na | 15 473 | 0,00 | 85 | 2,41 | ||||
| 2025-08-12 | 13F | Advisors Asset Management, Inc. | 208 465 | −0,53 | 1 213 | 5,11 | ||||
| 2025-08-01 | 13F | Motco | 22 318 | −26,39 | 130 | −22,75 | ||||
| 2025-07-30 | 13F | Brookstone Capital Management | 25 770 | −4,22 | 150 | 0,68 | ||||
| 2025-08-14 | 13F | DecisionPoint Financial, LLC | 0 | −100,00 | 0 | |||||
| 2025-07-17 | 13F | Park Place Capital Corp | 0 | −100,00 | 0 | |||||
| 2025-08-01 | 13F | MorganRosel Wealth Management, LLC | 6 246 | 36 | ||||||
| 2025-08-13 | 13F | Scotia Capital Inc. | 459 571 | 0,32 | 2 675 | 5,94 | ||||
| 2025-08-14 | 13F | Great Valley Advisor Group, Inc. | 24 475 | 0,55 | 142 | 5,97 | ||||
| 2025-05-12 | 13F | Independent Advisor Alliance | 0 | −100,00 | 0 | |||||
| 2025-07-18 | 13F | Bartlett & Co. Wealth Management Llc | 902 | 0,00 | 5 | 25,00 | ||||
| 2025-08-07 | 13F | Midland Wealth Advisors Llc | 26 748 | 0,00 | 156 | 5,44 | ||||
| 2025-07-24 | 13F | Aurora Private Wealth, Inc. | 11 014 | 2,60 | 0 | |||||
| 2025-07-17 | 13F | HCR Wealth Advisors | 75 353 | 0,00 | 439 | 5,54 | ||||
| 2025-08-14 | 13F | MidWestOne Financial Group, Inc. | 19 142 | 0,00 | 111 | 5,71 | ||||
| 2025-07-25 | 13F | Cwm, Llc | 12 802 | 0,00 | 0 | |||||
| 2025-08-08 | 13F | Meridian Wealth Management, LLC | 16 264 | 15,64 | 95 | 22,08 | ||||
| 2025-08-15 | 13F | Captrust Financial Advisors | 89 087 | 1,30 | 518 | 7,02 | ||||
| 2025-09-04 | 13F/A | Advisor Group Holdings, Inc. | 211 300 | 11,35 | 1 229 | 17,51 | ||||
| 2025-04-21 | 13F | Institute for Wealth Management, LLC. | 0 | −100,00 | 0 | −100,00 | ||||
| 2025-04-25 | 13F | Red Tortoise LLC | 0 | −100,00 | 0 | |||||
| 2025-08-05 | 13F | Wellington Shields & Co., LLC | 5 428 | 0,00 | 32 | 6,90 | ||||
| 2025-08-06 | 13F | RFG - Bristol Wealth Advisors, LLC | 14 053 | −9,04 | 82 | −4,71 | ||||
| 2025-05-05 | 13F | Hazlett, Burt & Watson, Inc. | 0 | −100,00 | 0 | |||||
| 2025-07-31 | 13F | Oppenheimer & Co Inc | 121 605 | 5,91 | 708 | 11,87 | ||||
| 2025-08-01 | 13F | Ashton Thomas Private Wealth, LLC | 20 302 | −51,55 | 118 | −48,70 | ||||
| 2025-08-07 | 13F | Kestra Private Wealth Services, Llc | 28 038 | 0,70 | 163 | 6,54 | ||||
| 2025-08-14 | 13F | UBS Group AG | 379 728 | 10,42 | 2 210 | 16,68 | ||||
| 2025-07-25 | 13F | Concord Wealth Partners | 303 | 0,00 | 2 | 0,00 | ||||
| 2025-08-05 | 13F | Sigma Planning Corp | 12 942 | 0,43 | 75 | 5,63 | ||||
| 2025-08-13 | 13F | Northwestern Mutual Wealth Management Co | 1 371 | −82,54 | 8 | −83,72 | ||||
| 2025-08-14 | 13F | Bank Of America Corp /de/ | 531 315 | 4,71 | 3 092 | 10,63 | ||||
| 2025-05-08 | 13F | Sound View Wealth Advisors Group, LLC | 0 | −100,00 | 0 | |||||
| 2025-08-06 | 13F | Texas Yale Capital Corp. | 11 000 | 2,80 | 64 | 10,34 | ||||
| 2025-08-14 | 13F | Mariner, LLC | 27 160 | −9,04 | 158 | −3,66 | ||||
| 2025-07-29 | 13F | Aire Advisors, Llc | 11 813 | 69 | ||||||
| 2025-07-30 | 13F | Cornerstone Advisory, LLC | 18 021 | 1,45 | 105 | 6,12 | ||||
| 2025-05-09 | 13F | Shaker Financial Services, LLC | 0 | −100,00 | 0 | |||||
| 2025-08-11 | 13F | Elequin Capital Lp | 26 873 | 156 | ||||||
| 2025-08-11 | 13F | Principal Securities, Inc. | 4 147 | 5,44 | 24 | 14,29 | ||||
| 2025-08-11 | 13F | Capital Square, LLC | 18 747 | 0,00 | 111 | 6,80 | ||||
| 2025-07-01 | 13F | Legacy Wealth Management, LLC / MS | 52 739 | 184,29 | 307 | 200,00 | ||||
| 2025-08-04 | 13F | Bay Colony Advisory Group, Inc d/b/a Bay Colony Advisors | 24 230 | 0,98 | 141 | 7,63 | ||||
| 2025-08-13 | 13F | Rsm Us Wealth Management Llc | 92 100 | 0,00 | 536 | 5,72 | ||||
| 2025-08-14 | 13F | Gen-Wealth Partners Inc | 5 235 | −24,51 | 30 | −21,05 | ||||
| 2025-08-14 | 13F | CIBC World Markets Inc. | 81 459 | 4,51 | 474 | 10,49 | ||||
| 2025-08-01 | 13F | Boyd Watterson Asset Management Llc/oh | 5 280 | 0,00 | 31 | 3,45 | ||||
| 2025-05-13 | 13F | Bank Of Montreal /can/ | 0 | −100,00 | 0 | |||||
| 2025-08-06 | 13F | Modera Wealth Management, LLC | 17 200 | 0,00 | 100 | 6,38 | ||||
| 2025-07-28 | 13F | Triton Wealth Management, PLLC | 11 031 | 0,51 | 66 | 6,56 | ||||
| 2025-08-14 | 13F | Cohen & Steers, Inc. | 400 000 | 0,00 | 2 | 0,00 | ||||
| 2025-07-17 | 13F | Janney Montgomery Scott LLC | 147 684 | 6,85 | 1 | |||||
| 2025-08-14 | 13F | Comerica Bank | 16 537 | 1 653 600,00 | 96 | |||||
| 2025-08-04 | 13F | Spire Wealth Management | 1 000 | 0,00 | 6 | 0,00 | ||||
| 2025-08-14 | 13F/A | Rockefeller Capital Management L.P. | 204 703 | 1,27 | 1 191 | 7,01 | ||||
| 2025-08-14 | 13F | Wealth Preservation Advisors, LLC | 1 500 | 0,00 | 9 | 0,00 | ||||
| 2025-07-29 | 13F | International Assets Investment Management, Llc | 397 426 | 0,00 | 2 313 | 5,66 | ||||
| 2025-08-05 | 13F | Mission Wealth Management, Lp | 37 574 | 0,00 | 219 | 5,31 | ||||
| 2025-05-16 | 13F | Coppell Advisory Solutions LLC | 0 | −100,00 | 0 | |||||
| 2025-07-11 | 13F | Kapstone Financial Advisors LLC | 21 080 | 80,94 | 123 | 90,63 | ||||
| 2025-07-14 | 13F | Armstrong Advisory Group, Inc | 2 727 | 16 | ||||||
| 2025-08-14 | 13F | GWM Advisors LLC | 32 406 | −11,71 | 189 | −6,93 | ||||
| 2025-08-06 | 13F | Vantage Financial Partners, LLC | 15 269 | −29,15 | 89 | −25,42 | ||||
| 2025-08-14 | 13F | Benjamin Edwards Inc | 32 542 | 2,32 | 189 | 8,00 | ||||
| 2025-08-14 | 13F | Mendel Capital Management LLC | 25 638 | 0,00 | 149 | 5,67 | ||||
| 2025-08-06 | 13F | Chancellor Financial Group WB LP | 19 010 | 1,70 | 111 | 7,84 | ||||
| 2025-08-06 | 13F | Commonwealth Equity Services, Llc | 1 878 662 | −0,72 | 11 | 0,00 | ||||
| 2025-05-09 | 13F | Exencial Wealth Advisors, Llc | 0 | −100,00 | 0 | |||||
| 2025-07-21 | 13F | Ameritas Advisory Services, LLC | 9 856 | −60,12 | 57 | −58,09 | ||||
| 2025-08-13 | 13F | Philadelphia Trust Co | 1 141 144 | −0,27 | 7 | 0,00 | ||||
| 2025-07-22 | 13F/A | Kingstone Capital Partners Texas, LLC | 26 996 | 0,00 | 157 | 5,37 | ||||
| 2025-07-22 | 13F | Valeo Financial Advisors, LLC | 0 | −100,00 | 0 | |||||
| 2025-08-04 | 13F | Live Oak Private Wealth LLC | 514 176 | 0,00 | 2 993 | 5,61 | ||||
| 2025-08-12 | 13F | Proequities, Inc. | 0 | 0 | ||||||
| 2025-08-13 | 13F | Continuum Advisory, LLC | 0 | −100,00 | 0 | −100,00 | ||||
| 2025-08-05 | 13F | Key FInancial Inc | 100 | 0,00 | 1 | |||||
| 2025-07-25 | 13F | Valley Brook Capital Group, Inc. | 115 836 | 2,66 | 674 | 8,53 | ||||
| 2025-08-13 | 13F | Beacon Pointe Advisors, LLC | 15 731 | −45,25 | 92 | −42,41 | ||||
| 2025-08-14 | 13F | Glen Eagle Advisors, LLC | 1 906 | 0,00 | 11 | 10,00 | ||||
| 2025-08-15 | 13F | Tower Research Capital LLC (TRC) | 25 | −16,67 | 0 | |||||
| 2025-07-21 | 13F | Hilltop National Bank | 2 750 | 0,00 | 16 | 14,29 | ||||
| 2025-07-22 | 13F | Accel Wealth Management | 364 694 | 1,16 | 2 123 | 6,85 | ||||
| 2025-08-13 | 13F | Transce3nd, LLC | 1 000 | 6 | ||||||
| 2025-08-14 | 13F | Beaird Harris Wealth Management, LLC | 3 917 | 23 | ||||||
| 2025-07-29 | 13F | Stratos Wealth Partners, LTD. | 110 735 | 14,61 | 644 | 21,05 | ||||
| 2025-08-08 | 13F | Pnc Financial Services Group, Inc. | 2 804 | −66,02 | 16 | −64,44 | ||||
| 2025-08-14 | 13F | Mercer Global Advisors Inc /adv | 64 822 | −0,24 | 377 | 5,31 | ||||
| 2025-08-04 | 13F | IFG Advisory, LLC | 31 486 | 11,71 | 183 | 18,06 | ||||
| 2025-08-13 | 13F | Smith, Moore & Co. | 17 104 | 45,00 | 100 | 54,69 | ||||
| 2025-08-19 | 13F | National Asset Management, Inc. | 0 | −100,00 | 0 | |||||
| 2025-07-23 | 13F | Stonegate Investment Group, LLC | 47 974 | 2,64 | 279 | 8,56 | ||||
| 2025-08-14 | 13F | Glenmede Investment Management, LP | 15 473 | 90 | ||||||
| 2025-07-30 | 13F | Avidian Wealth Solutions, LLC | 19 295 | 0,00 | 112 | 5,66 | ||||
| 2025-07-09 | 13F | Graves-Light Private Wealth Management, Inc. | 41 224 | 0,00 | 240 | 5,29 | ||||
| 2025-08-14 | 13F | Balyasny Asset Management Llc | 25 778 | 150 | ||||||
| 2025-08-14 | 13F | Hilltop Holdings Inc. | 18 032 | −12,80 | 105 | −7,96 | ||||
| 2025-08-01 | 13F | Envestnet Asset Management Inc | 457 149 | 761,91 | 2 661 | 810,96 | ||||
| 2025-08-13 | 13F | Cerity Partners LLC | 306 890 | 29,13 | 1 786 | 36,44 | ||||
| 2025-04-14 | 13F | RDA Financial Network | 0 | −100,00 | 0 | |||||
| 2025-07-21 | 13F | Crews Bank & Trust | 0 | −100,00 | 0 | |||||
| 2025-07-28 | 13F | Sagespring Wealth Partners, Llc | 0 | −100,00 | 0 | |||||
| 2025-08-06 | 13F | Golden State Wealth Management, LLC | 339 861 | −34,47 | 1 978 | −30,80 | ||||
| 2025-08-06 | 13F | Csenge Advisory Group | 12 459 | 0,00 | 72 | 9,23 | ||||
| 2025-08-14 | 13F | Stifel Financial Corp | 95 927 | −14,84 | 558 | −10,00 | ||||
| 2025-08-12 | 13F | LPL Financial LLC | 3 804 780 | 9,50 | 22 144 | 15,66 | ||||
| 2025-08-07 | 13F | Allworth Financial LP | 38 908 | 620,25 | 226 | 707,14 | ||||
| 2025-08-12 | 13F | CIBC Private Wealth Group, LLC | 1 484 | 2,56 | 9 | 14,29 | ||||
| 2025-08-12 | 13F | Steward Partners Investment Advisory, Llc | 318 939 | 27,38 | 1 856 | 34,59 | ||||
| 2025-08-19 | 13F | Advisory Services Network, LLC | 100 044 | −1,97 | 582 | 3,56 | ||||
| 2025-07-25 | 13F | Apollon Wealth Management, LLC | 15 222 | 0,34 | 89 | 6,02 | ||||
| 2025-08-08 | 13F | Kingsview Wealth Management, LLC | 39 426 | 0,13 | 229 | 6,02 | ||||
| 2025-07-18 | 13F | Consolidated Portfolio Review Corp | 112 532 | −17,72 | 655 | −13,15 | ||||
| 2025-05-14 | 13F | Huntington National Bank | 27 | 2 500,00 | ||||||
| 2025-04-22 | 13F | Putney Financial Group LLC | 0 | −100,00 | 0 | |||||
| 2025-08-13 | 13F | StoneX Group Inc. | 13 612 | 79 | ||||||
| 2025-08-13 | 13F | Thomas J. Herzfeld Advisors, Inc. | 1 020 | 2,62 | 6 | 0,00 | ||||
| 2025-07-10 | 13F | Wealth Enhancement Advisory Services, Llc | 99 274 | −2,47 | 589 | 5,00 | ||||
| 2025-08-12 | 13F | Jpmorgan Chase & Co | 4 500 | 0,00 | 26 | 8,33 | ||||
| 2025-07-18 | 13F | SOA Wealth Advisors, LLC. | 1 200 | 0,00 | 7 | 0,00 | ||||
| 2025-08-14 | 13F | Arete Wealth Advisors, LLC | 0 | −100,00 | 0 | |||||
| 2025-07-24 | 13F | Cascade Investment Group, Inc. | 11 749 | 0,00 | 68 | 6,25 | ||||
| 2025-07-15 | 13F | Shulman DeMeo Asset Management LLC | 57 639 | −0,20 | 335 | 5,35 | ||||
| 2025-07-25 | 13F | Atria Wealth Solutions, Inc. | 42 033 | −51,36 | 245 | −48,74 | ||||
| 2025-08-05 | 13F | Flynn Zito Capital Management, Llc | 88 806 | 0,00 | 517 | 5,52 | ||||
| 2025-08-08 | 13F | Thompson Davis & Co., Inc. | 13 000 | 76 | ||||||
| 2025-08-13 | 13F | Gamco Investors, Inc. Et Al | 841 675 | −0,64 | 4 899 | 4,95 | ||||
| 2025-07-17 | 13F | Vermillion Wealth Management, Inc. | 2 740 | 2,58 | 16 | 7,14 | ||||
| 2025-07-28 | 13F | Frazier Financial Advisors, LLC | 81 | 0,00 | 0 | |||||
| 2025-08-14 | 13F | Jane Street Group, Llc | 45 156 | 138,53 | 263 | 151,92 | ||||
| 2025-07-29 | 13F | Stratos Wealth Advisors, LLC | 0 | −100,00 | 0 | −100,00 | ||||
| 2025-08-15 | 13F | Equitable Holdings, Inc. | 63 099 | 0,00 | 367 | 5,76 | ||||
| 2025-07-31 | 13F | Moloney Securities Asset Management, LLC | 15 832 | 92 | ||||||
| 2025-08-07 | 13F | Midwest Trust Co | 52 810 | 307 | ||||||
| 2025-07-11 | 13F | Quad-Cities Investment Group, LLC | 24 942 | −0,36 | 145 | 5,84 | ||||
| 2025-08-14 | 13F | Two Sigma Securities, Llc | 18 317 | 107 | ||||||
| 2025-07-16 | 13F | Register Financial Advisors LLC | 22 637 | 81,07 | 132 | 92,65 | ||||
| 2025-08-01 | 13F | SYM FINANCIAL Corp | 11 476 | 2,60 | 67 | 8,20 | ||||
| 2025-05-15 | 13F | Gwn Securities Inc. | 0 | −100,00 | 0 | |||||
| 2025-07-08 | 13F | Nbc Securities, Inc. | 37 447 | −4,17 | 0 | |||||
| 2025-04-29 | 13F | Lee Danner & Bass Inc | 0 | −100,00 | 0 | −100,00 | ||||
| 2025-07-10 | 13F | Oliver Lagore Vanvalin Investment Group | 3 750 | 0,00 | 21 | 0,00 | ||||
| 2025-08-05 | 13F | GHP Investment Advisors, Inc. | 5 344 | 0,00 | 31 | 6,90 | ||||
| 2025-07-29 | 13F | Arista Wealth Management, LLC | 47 128 | 0,00 | 274 | 5,79 | ||||
| 2025-07-25 | 13F | Community Bank, N.A. | 1 000 | 0,00 | 6 | 0,00 | ||||
| 2025-04-25 | 13F | Koshinski Asset Management, Inc. | 0 | −100,00 | 0 | |||||
| 2025-05-12 | 13F | National Bank Of Canada /fi/ | 0 | −100,00 | 0 | |||||
| 2025-08-15 | 13F | Kestra Advisory Services, LLC | 65 339 | 29,24 | 380 | 36,69 | ||||
| 2025-05-07 | 13F | Sheaff Brock Investment Advisors, LLC | 33 495 | 0,00 | 185 | 2,22 | ||||
| 2025-07-31 | 13F | Cambridge Investment Research Advisors, Inc. | 59 542 | −9,70 | 0 | |||||
| 2025-07-22 | 13F | Belpointe Asset Management LLC | 0 | −100,00 | 0 | |||||
| 2025-07-31 | 13F | Whipplewood Advisors, LLC | 0 | −100,00 | 0 | |||||
| 2025-07-25 | 13F | NorthRock Partners, LLC | 81 363 | 1,43 | 474 | 7,26 | ||||
| 2025-08-14 | 13F | Federation des caisses Desjardins du Quebec | 739 | 0,00 | 4 | 0,00 | ||||
| 2025-07-22 | 13F | Marks Group Wealth Management, Inc | 244 838 | 0,00 | 1 425 | 5,56 | ||||
| 2025-08-08 | 13F | Symphony Financial Services, Inc. | 29 978 | 0,79 | 174 | 6,75 | ||||
| 2025-07-22 | 13F | Gsa Capital Partners Llp | 0 | −100,00 | 0 | |||||
| 2025-08-05 | 13F | Carolinas Wealth Consulting Llc | 0 | −100,00 | 0 | −100,00 | ||||
| 2025-08-14 | 13F | Prestige Wealth Management Group LLC | 343 | 0,00 | 2 | 0,00 | ||||
| 2025-08-14 | 13F | Safeguard Investment Advisory Group, LLC | 14 590 | 2,22 | 85 | 7,69 | ||||
| 2025-07-29 | 13F | Stephens Inc /ar/ | 16 873 | 0,00 | 98 | 6,52 | ||||
| 2025-07-24 | 13F | Ronald Blue Trust, Inc. | 2 000 | 12 | ||||||
| 2025-08-18 | 13F | Hollencrest Capital Management | 95 533 | 0,00 | 556 | 5,70 | ||||
| 2025-08-18 | 13F | Tactive Advisors, LLC | 17 154 | 100 | ||||||
| 2025-08-18 | 13F | Geneos Wealth Management Inc. | 5 100 | 200,00 | 30 | 222,22 | ||||
| 2025-08-14 | 13F | Susquehanna International Group, Llp | 0 | −100,00 | 0 | |||||
| 2025-08-14 | 13F | Synovus Financial Corp | 39 468 | 0,00 | 230 | 5,53 | ||||
| 2025-08-26 | 13F/A | Thrivent Financial For Lutherans | 191 249 | 0,68 | 1 | 0,00 | ||||
| 2025-07-15 | 13F | Kentucky Trust Co | 7 400 | 0,00 | 43 | 7,50 | ||||
| 2025-08-07 | 13F | PCG Wealth Advisors, LLC | 0 | −100,00 | 0 | |||||
| 2025-08-08 | 13F | Good Life Advisors, LLC | 22 161 | 10,03 | 129 | 16,36 | ||||
| 2025-08-12 | 13F | J.w. Cole Advisors, Inc. | 1 258 278 | 74,69 | 7 323 | 84,55 | ||||
| 2025-08-08 | 13F | MTM Investment Management, LLC | 13 530 | 0,00 | 79 | 5,41 | ||||
| 2025-07-18 | 13F | Truist Financial Corp | 20 567 | −0,36 | 120 | 5,31 | ||||
| 2025-08-08 | 13F | Avantax Advisory Services, Inc. | 46 000 | −0,48 | 268 | 5,12 | ||||
| 2025-08-11 | 13F | Rothschild Investment Llc | 6 000 | 0,00 | 35 | 3,03 |