Grunnleggende statistikk
| Institusjonelle eiere | 173 total, 173 long only, 0 short only, 0 long/short - change of 4,85% MRQ |
| Gjennomsnittlig porteføljeallokering | 0.3908 % - change of 20,14% MRQ |
| Institusjonelle aksjer (Long) | 33 789 586 (ex 13D/G) - change of 1,13MM shares 3,46% MRQ |
| Institusjonell verdi (Long) | $ 710 594 USD ($1000) |
Institusjonelt eierskap og aksjonærer
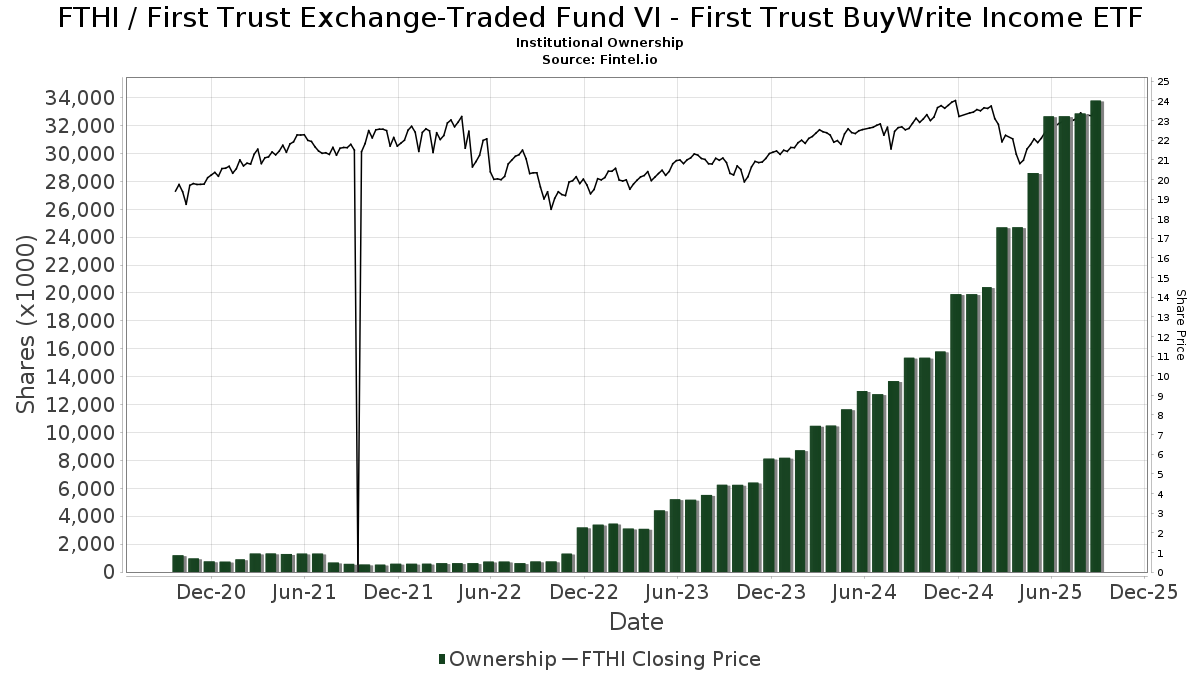
First Trust Exchange-Traded Fund VI - First Trust BuyWrite Income ETF (US:FTHI) har 173 institusjonelle eiere og aksjonærer som har sendt inn 13D/G- eller 13F-skjemaer til Securities Exchange Commission (SEC). Disse institusjonene eier til sammen 33,789,586 aksjer. De største aksjonærene inkluderer LPL Financial LLC, Wells Fargo & Company/mn, Envestnet Asset Management Inc, Raymond James Financial Inc, D.a. Davidson & Co., Janney Montgomery Scott LLC, Royal Bank Of Canada, Cetera Investment Advisers, Stifel Financial Corp, and Cambridge Investment Research Advisors, Inc. .
First Trust Exchange-Traded Fund VI - First Trust BuyWrite Income ETF (NasdaqGM:FTHI) institusjonell eierstruktur viser nåværende posisjoner i selskapet fordelt på institusjoner og fond, samt de siste endringene i posisjonsstørrelse. De største aksjonærene kan være individuelle investorer, verdipapirfond, hedgefond eller institusjoner. Schedule 13D indikerer at investoren eier (eller har eid) mer enn 5 % av selskapet og har til hensikt (eller hadde til hensikt) å aktivt forfølge en endring i forretningsstrategien. Schedule 13G indikerer en passiv investering på over 5 %.
The share price as of September 9, 2025 is 23,52 / share. Previously, on September 10, 2024, the share price was 22,52 / share. This represents an increase of 4,44% over that period.
Fondssentiment-score
Fondssentiment Score (også kjent som akkumulering av eierskap poengsum) viser hvilke aksjer som er mest kjøpt av fond. Den er resultatet av en sofistikert, kvantitativ flerfaktormodell som identifiserer selskaper med de høyeste nivåene av institusjonell akkumulering. Beregningsmodellen for poeng bruker en kombinasjon av den totale økningen i antall offentliggjorte eiere, endringer i porteføljeallokeringen til disse eierne og andre beregninger. Tallet går fra 0 til 100, der høyere tall indikerer en høyere grad av akkumulering i forhold til sammenlignbare selskaper, der 50 er gjennomsnittet.
Oppdateringsfrekvens: Daglig
Sjekk ut Ownership Explorer, som inneholder en liste over de høyest rangerte selskapene.
Institusjonell Put/Call-forhold
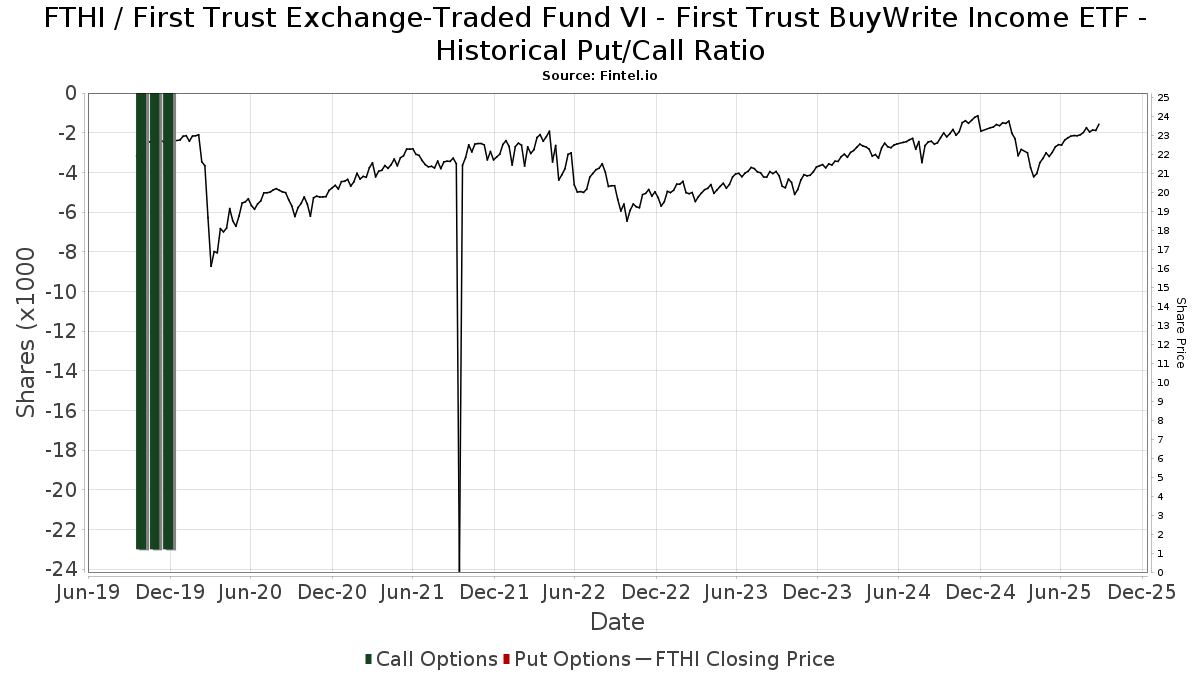
I tillegg til å rapportere standard aksje- og gjeldsemisjoner må institusjoner med mer enn 100 millioner kroner i forvaltningskapital også oppgi beholdningen av put- og callopsjoner. Siden put-opsjoner generelt indikerer et negativt sentiment, og call-opsjoner indikerer et positivt sentiment, kan vi få et inntrykk av det generelle institusjonelle sentimentet ved å plotte forholdet mellom put- og call-opsjoner. Diagrammet til høyre viser det historiske forholdet mellom put- og call-opsjoner for dette instrumentet.
Ved å bruke Put/Call-forholdet som en indikator på investorsentimentet kan man overvinne en av de viktigste svakhetene ved å bruke totalt institusjonelt eierskap, nemlig at en betydelig andel av forvaltningskapitalen investeres passivt for å følge indekser. Passivt forvaltede fond kjøper vanligvis ikke opsjoner, slik at indikatoren for put/call-forhold i større grad gjenspeiler stemningen i aktivt forvaltede fond.
13D/G-arkiveringer
Vi presenterer 13D/G-arkiveringene separat fra 13F-arkiveringene fordi de behandles forskjellig av SEC. 13D/G-arkiveringene kan sendes inn av grupper av investorer (med én leder), mens 13D/G-arkiveringene ikke kan sendes inn. Dette fører til situasjoner der en investor kan sende inn en 13D/G-rapport med én verdi for alle aksjene (som representerer alle aksjene som eies av investorgruppen), men deretter sende inn en 13F-melding med en annen verdi for alle aksjene (som kun representerer deres eget eierskap). Dette betyr at aksjeeierskap i 13D/G-arkiveringene og 13F-arkiveringene ofte ikke er direkte sammenlignbare, og vi presenterer dem derfor separat.
Merk: Fra og med 16. mai 2021 viser vi ikke lenger eiere som ikke har sendt inn en 13D/G i løpet av det siste året. Tidligere viste vi hele historikken for 13D/G-arkiveringer. Generelt må enheter som er pålagt å sende inn 13D/G-arkiveringer, sende inn minst én gang i året før de sender inn en avsluttende rapport. Det hender imidlertid at fond trekker seg ut av posisjoner uten å sende inn en avsluttende innlevering (dvs. at de avvikler), slik at visning av hele historikken av og til fører til forvirring om det nåværende eierskapet. For å unngå forvirring viser vi nå bare "nåværende" eiere, det vil si eiere som har sendt inn informasjon i løpet av det siste året.
Upgrade to unlock premium data.
| Fildato | Skjema | Investor | Tidligere aksjer |
Siste aksjer |
Δ Aksjer (prosent) |
Eierandel (prosent) |
Δ Eierandel (prosent) |
|
|---|---|---|---|---|---|---|---|---|
| 2025-07-23 | FIRST TRUST PORTFOLIOS LP | 16,143,864 | 15,663,087 | -2.98 | 26.12 | -6.68 |
13F- og NPORT-arkiveringer
Detaljer om 13F-arkiveringer er gratis. Detaljer om NP-arkiveringer krever et premium-medlemskap. Grønne rader indikerer nye posisjoner. Røde rader indikerer lukkede posisjoner. Klikk på lenke ikonet for å se hele transaksjonshistorikken.
Oppgrader
for å låse opp premiedata og eksportere til Excel. ![]() .
.
| Fildato | Kilde | Investor | Type | Gjennomsnittlig pris (estimert) |
Aksjer | Δ Aksjer (%) |
Rapportert verdi ($1000) | Verdi (%) | Portallokering (%) | |
|---|---|---|---|---|---|---|---|---|---|---|
| 2025-08-11 | 13F | Perennial Investment Advisors, LLC | 113 774 | 2,39 | 2 600 | 7,04 | ||||
| 2025-08-14 | 13F | Treasure Coast Financial Planning | 24 802 | 13,15 | 567 | 18,16 | ||||
| 2025-07-07 | 13F | Thurston, Springer, Miller, Herd & Titak, Inc. | 2 900 | 7,41 | 66 | 11,86 | ||||
| 2025-05-15 | 13F/A | Orion Portfolio Solutions, LLC | 21 473 | 3 034,74 | 469 | 3 808,33 | ||||
| 2025-07-07 | 13F | Investors Research Corp | 398 | 0,00 | 9 | 12,50 | ||||
| 2025-08-12 | 13F | Integrated Advisors Network LLC | 20 480 | 468 | ||||||
| 2025-08-11 | 13F | Principal Securities, Inc. | 98 980 | 8,90 | 2 262 | 6,95 | ||||
| 2025-07-08 | 13F | Zrc Wealth Management, Llc | 187 621 | 0,75 | 4 287 | 5,33 | ||||
| 2025-08-05 | 13F | American Institute for Advanced Investment Management, LLP | 53 820 | −1,64 | 1 230 | 2,76 | ||||
| 2025-08-12 | 13F | Cornerstone Wealth Management, LLC | 34 468 | 47,14 | 788 | 53,71 | ||||
| 2025-07-16 | 13F | Perigon Wealth Management, LLC | 11 719 | −11,51 | 268 | −7,61 | ||||
| 2025-07-17 | 13F | Nelson, Van Denburg & Campbell Wealth Management Group, LLC | 67 364 | −7,24 | 1 539 | −3,02 | ||||
| 2025-08-04 | 13F | Assetmark, Inc | 0 | −100,00 | 0 | |||||
| 2025-08-29 | 13F | Centaurus Financial, Inc. | 14 004 | 146,46 | 0 | |||||
| 2025-08-12 | 13F | LPL Financial LLC | 6 790 859 | 3,53 | 155 171 | 8,22 | ||||
| 2025-08-18 | 13F | Geneos Wealth Management Inc. | 51 309 | 76,29 | 1 172 | 84,28 | ||||
| 2025-07-28 | 13F | RFG Advisory, LLC | 19 333 | −53,14 | 442 | −51,05 | ||||
| 2025-04-24 | 13F | Kraft, Davis & Associates, LLC | 0 | −100,00 | 0 | |||||
| 2025-08-04 | 13F | Merkkuri Wealth Advisors LLC | 98 843 | 6,95 | 2 259 | 11,78 | ||||
| 2025-08-15 | 13F | Fsb Premier Wealth Management, Inc. | 27 097 | 1,30 | 619 | 5,99 | ||||
| 2025-08-11 | 13F | Nations Financial Group Inc, /ia/ /adv | 36 915 | 8,88 | 844 | 13,77 | ||||
| 2025-08-05 | 13F | Dunhill Financial, LLC | 54 545 | −86,92 | 1 246 | −86,34 | ||||
| 2025-08-13 | 13F | Scotia Capital Inc. | 0 | −100,00 | 0 | |||||
| 2025-07-23 | 13F | RiverTree Advisors, LLC | 201 047 | 181,99 | 4 594 | 194,80 | ||||
| 2025-07-25 | NP | LALT - First Trust Multi-Strategy Alternative ETF | 0 | −100,00 | 0 | −100,00 | ||||
| 2025-08-06 | 13F | Commonwealth Equity Services, Llc | 641 994 | 10,47 | 15 | 16,67 | ||||
| 2025-08-01 | 13F | Pasadena Private Wealth, LLC | 19 850 | 0,00 | 454 | 4,62 | ||||
| 2025-07-28 | 13F | Davidson Trust Co | 88 484 | 4,82 | 2 022 | 9,54 | ||||
| 2025-08-14 | 13F | GWM Advisors LLC | 45 886 | 1,85 | 1 049 | 6,50 | ||||
| 2025-08-13 | 13F | VestGen Advisors, LLC | 14 723 | 0,59 | 336 | 5,33 | ||||
| 2025-07-16 | 13F | Novem Group | 11 216 | 256 | ||||||
| 2025-08-13 | 13F | Northwestern Mutual Wealth Management Co | 88 302 | 2,10 | 2 018 | 6,72 | ||||
| 2025-08-14 | 13F | Financial Advisory Service, Inc. | 11 | 0 | ||||||
| 2025-07-25 | 13F | Cwm, Llc | 310 505 | 22,92 | 7 | 40,00 | ||||
| 2025-08-14 | 13F | Old Mission Capital Llc | 133 235 | 1 216,42 | 3 044 | 1 277,38 | ||||
| 2025-07-15 | 13F | BKA Wealth Consulting, Inc. | 0 | −100,00 | 0 | |||||
| 2025-05-28 | 13F | Intrua Financial, LLC | 0 | −100,00 | 0 | |||||
| 2025-08-01 | 13F | Envestnet Asset Management Inc | 2 978 349 | −1,63 | 68 055 | 2,82 | ||||
| 2025-08-14 | 13F | Comerica Bank | 2 071 | 0,00 | 47 | 4,44 | ||||
| 2025-08-14 | 13F | Integrated Wealth Concepts LLC | 141 190 | 5,71 | 3 226 | 10,52 | ||||
| 2025-08-06 | 13F | Tradewinds, LLC. | 98 843 | 2 259 | ||||||
| 2025-08-08 | 13F | Compass Financial Services Inc | 563 | 2,36 | 13 | 0,00 | ||||
| 2025-07-21 | 13F | Ameritas Advisory Services, LLC | 233 868 | −14,01 | 5 344 | −14,44 | ||||
| 2025-07-25 | 13F | We Are One Seven, LLC | 0 | −100,00 | 0 | |||||
| 2025-08-14 | 13F | Advisor OS, LLC | 358 456 | 9,12 | 8 191 | 14,07 | ||||
| 2025-08-07 | 13F | Kestra Private Wealth Services, Llc | 61 766 | 35,52 | 1 411 | 41,67 | ||||
| 2025-08-12 | 13F | Global Retirement Partners, LLC | 3 279 | 0,00 | 75 | −2,63 | ||||
| 2025-08-08 | 13F | Capital Investment Advisory Services, LLC | 104 531 | 10,99 | 2 389 | 16,03 | ||||
| 2025-07-30 | 13F | Brookstone Capital Management | 42 281 | 4,07 | 966 | 8,78 | ||||
| 2025-08-14 | 13F | Arete Wealth Advisors, LLC | 0 | −100,00 | 0 | |||||
| 2025-08-08 | 13F | Foundations Investment Advisors, LLC | 12 914 | 1,97 | 295 | 6,88 | ||||
| 2025-07-14 | 13F | Main Line Retirement Advisors, LLC | 41 800 | 955 | ||||||
| 2025-07-29 | 13F | Balboa Wealth Partners | 51 443 | 1 175 | ||||||
| 2025-07-17 | 13F | Janney Montgomery Scott LLC | 786 087 | 13,44 | 18 | 13,33 | ||||
| 2025-08-14 | 13F | CoreCap Advisors, LLC | 4 549 | −10,51 | 104 | −7,21 | ||||
| 2025-08-14 | 13F | Stifel Financial Corp | 691 621 | 7,90 | 15 804 | 12,79 | ||||
| 2025-08-14 | 13F | Sequent Planning LLC | 58 004 | 2,47 | 1 325 | 7,11 | ||||
| 2025-08-18 | 13F | Arq Wealth Advisors, Llc | 117 263 | 0,00 | 2 563 | 0,00 | ||||
| 2025-08-04 | 13F | Atria Investments Llc | 0 | −100,00 | 0 | |||||
| 2025-07-31 | 13F | Anchor Capital Management Group Inc | 67 000 | 0,00 | 1 531 | 4,51 | ||||
| 2025-07-15 | 13F | LVZ Advisors, Inc. | 61 940 | 3,60 | 1 415 | 8,35 | ||||
| 2025-08-12 | 13F | Steward Partners Investment Advisory, Llc | 20 047 | 17,30 | 458 | 22,79 | ||||
| 2025-07-01 | 13F | Private Client Services, Llc | 15 483 | 49,19 | 354 | 56,19 | ||||
| 2025-08-15 | 13F | Morgan Stanley | 16 419 | −0,98 | 375 | 3,59 | ||||
| 2025-08-14 | 13F | Benjamin Edwards Inc | 37 723 | 13,54 | 862 | 18,60 | ||||
| 2025-07-31 | 13F | Oppenheimer & Co Inc | 25 556 | 62,41 | 584 | 69,97 | ||||
| 2025-07-09 | 13F | Channel Wealth Llc | 15 129 | 8,61 | 346 | 13,49 | ||||
| 2025-08-13 | 13F | Smith, Moore & Co. | 14 924 | −0,67 | 341 | 3,96 | ||||
| 2025-08-05 | 13F | Lord & Richards Wealth Management, LLC | 0 | −100,00 | 0 | |||||
| 2025-08-11 | 13F | Regal Investment Advisors LLC | 43 477 | 993 | ||||||
| 2025-08-01 | 13F | Ferguson Shapiro LLC | 9 178 | 210 | ||||||
| 2025-08-14 | 13F | UBS Group AG | 361 | 8 | ||||||
| 2025-05-16 | 13F/A | Kestra Investment Management, LLC | 0 | −100,00 | 0 | |||||
| 2025-07-24 | 13F | Cyndeo Wealth Partners, LLC | 16 497 | −23,76 | 377 | −20,34 | ||||
| 2025-07-30 | 13F | Insight Advisors, LLC/ PA | 19 716 | 0,87 | 451 | 5,39 | ||||
| 2025-07-30 | 13F | TFB Advisors LLC | 35 773 | −6,86 | 817 | −2,62 | ||||
| 2025-06-26 | NP | ATCAX - Anchor Risk Managed Credit Strategies Fund Advisor Class Shares | 67 000 | 0,00 | 1 486 | −4,07 | ||||
| 2025-08-04 | 13F | Integrity Alliance, Llc. | 0 | −100,00 | 0 | |||||
| 2025-07-30 | 13F | D.a. Davidson & Co. | 2 486 389 | 3,34 | 56 814 | 8,02 | ||||
| 2025-08-18 | 13F | Tyler-Stone Wealth Management | 16 326 | 2,33 | 373 | 7,18 | ||||
| 2025-07-14 | 13F | AdvisorNet Financial, Inc | 3 508 | 84,63 | 80 | 95,12 | ||||
| 2025-07-25 | 13F | Envestnet Portfolio Solutions, Inc. | 39 370 | −62,51 | 900 | −60,83 | ||||
| 2025-08-15 | 13F | Kestra Advisory Services, LLC | 81 802 | 21,96 | 1 869 | 27,49 | ||||
| 2025-08-08 | 13F | SBI Securities Co., Ltd. | 1 560 | −9,25 | 36 | −5,41 | ||||
| 2025-08-14 | 13F | Snowden Capital Advisors LLC | 219 632 | 0,81 | 5 019 | 5,38 | ||||
| 2025-07-29 | 13F | International Assets Investment Management, Llc | 37 497 | 0,87 | 857 | 5,42 | ||||
| 2025-08-08 | 13F | Cetera Investment Advisers | 698 676 | 0,94 | 15 965 | 5,51 | ||||
| 2025-08-25 | NP | FTBI - First Trust Balanced Income ETF | 25 929 | 592 | ||||||
| 2025-08-06 | 13F | Legacy Investment Solutions, LLC | 28 653 | 66,76 | 655 | 61,88 | ||||
| 2025-08-13 | 13F | WCG Wealth Advisors LLC | 24 515 | 560 | ||||||
| 2025-08-14 | 13F | Hilltop Holdings Inc. | 9 281 | 212 | ||||||
| 2025-08-05 | 13F | GPS Wealth Strategies Group, LLC | 8 337 | 8,81 | 191 | 13,77 | ||||
| 2025-07-22 | 13F | Wealthcare Advisory Partners LLC | 10 327 | 0,08 | 236 | 4,44 | ||||
| 2025-07-14 | 13F | GAMMA Investing LLC | 913 | 0,00 | 21 | 5,26 | ||||
| 2025-08-11 | 13F | Elequin Capital Lp | 126 702 | 2 895 | ||||||
| 2025-08-08 | 13F | Avantax Advisory Services, Inc. | 128 694 | −1,52 | 2 941 | 2,94 | ||||
| 2025-08-11 | 13F | Aptus Capital Advisors, LLC | 4 435 | 30,10 | 101 | 36,49 | ||||
| 2025-08-13 | 13F | Beacon Pointe Advisors, LLC | 61 563 | −5,12 | 1 407 | −0,85 | ||||
| 2025-08-11 | 13F | Core Wealth Partners LLC | 34 301 | 33,58 | 784 | 39,57 | ||||
| 2025-08-07 | 13F | PCG Wealth Advisors, LLC | 74 652 | −45,32 | 1 706 | −42,86 | ||||
| 2025-05-27 | NP | XFLX - FundX Flexible ETF | 183 480 | 134,00 | 4 011 | 119,85 | ||||
| 2025-07-22 | 13F | DAVENPORT & Co LLC | 10 957 | 250 | ||||||
| 2025-08-27 | 13F/A | Brinker Capital Investments, LLC | 21 198 | −1,28 | 484 | 3,20 | ||||
| 2025-08-14 | 13F | Jane Street Group, Llc | 68 849 | −18,44 | 1 573 | −14,74 | ||||
| 2025-08-06 | 13F | Golden State Wealth Management, LLC | 1 263 | −95,87 | 29 | −95,81 | ||||
| 2025-07-22 | 13F | Accel Wealth Management | 50 749 | −0,98 | 1 160 | 3,48 | ||||
| 2025-08-14 | 13F | Wiley Bros.-aintree Capital, Llc | 18 980 | 434 | ||||||
| 2025-08-11 | 13F | Western Wealth Management, LLC | 0 | −100,00 | 0 | −100,00 | ||||
| 2025-08-14 | 13F | Citadel Advisors Llc | 24 187 | 553 | ||||||
| 2025-07-07 | 13F | Insight Wealth Strategies, LLC | 13 441 | 1,14 | 306 | 5,17 | ||||
| 2025-08-11 | 13F | One Capital Management, LLC | 0 | −100,00 | 0 | |||||
| 2025-08-11 | 13F | Lowe Brockenbrough & Co Inc | 3 500 | 80 | ||||||
| 2025-04-09 | 13F | HBW Advisory Services LLC | 0 | −100,00 | 0 | −100,00 | ||||
| 2025-08-13 | 13F | Level Four Advisory Services, Llc | 17 110 | −44,74 | 391 | −42,31 | ||||
| 2025-07-25 | 13F | Valley Brook Capital Group, Inc. | 11 180 | 0,24 | 255 | 4,94 | ||||
| 2025-07-09 | 13F | Presidio Capital Management, LLC | 19 863 | 5,30 | 454 | 9,95 | ||||
| 2025-07-31 | 13F | Cambridge Investment Research Advisors, Inc. | 684 255 | 25,23 | 16 | 36,36 | ||||
| 2025-07-08 | 13F | Nbc Securities, Inc. | 1 669 | 2,02 | 0 | |||||
| 2025-08-14 | 13F | Bank Of America Corp /de/ | 1 | 0,00 | 0 | |||||
| 2025-07-29 | 13F | Private Trust Co Na | 10 353 | 10,69 | 237 | 15,69 | ||||
| 2025-08-12 | 13F | Jpmorgan Chase & Co | 0 | −100,00 | 0 | |||||
| 2025-07-25 | 13F | Atria Wealth Solutions, Inc. | 60 697 | −64,69 | 1 387 | −63,11 | ||||
| 2025-04-15 | 13F | Transform Wealth, LLC | 41 631 | 910 | ||||||
| 2025-07-28 | 13F | Harbour Investments, Inc. | 124 275 | −1,06 | 2 840 | 3,42 | ||||
| 2025-05-09 | 13F | GeoWealth Management, LLC | 0 | −100,00 | 0 | |||||
| 2025-07-23 | 13F | Castle Rock Wealth Management, LLC | 15 566 | −0,03 | 360 | 5,59 | ||||
| 2025-08-14 | 13F | Wells Fargo & Company/mn | 4 567 850 | 23,28 | 104 375 | 28,86 | ||||
| 2025-07-22 | 13F | Legacy CG, LLC | 323 505 | −55,97 | 7 392 | −53,98 | ||||
| 2025-08-12 | 13F | Gladstone Institutional Advisory LLC | 15 629 | −17,48 | 357 | −13,77 | ||||
| 2025-08-06 | 13F | Moors & Cabot, Inc. | 9 050 | 207 | ||||||
| 2025-08-14 | 13F | Raymond James Financial Inc | 2 769 271 | −9,79 | 63 278 | −5,71 | ||||
| 2025-08-14 | 13F | Susquehanna International Group, Llp | 48 411 | −53,06 | 1 106 | −50,93 | ||||
| 2025-07-29 | 13F | Stratos Wealth Partners, LTD. | 0 | −100,00 | 0 | |||||
| 2025-08-06 | 13F | Prospera Financial Services Inc | 133 339 | 18,36 | 3 047 | 23,76 | ||||
| 2025-08-12 | 13F | Change Path, LLC | 293 875 | −0,79 | 6 715 | 3,71 | ||||
| 2025-07-23 | 13F | Sachetta, LLC | 12 870 | 294 | ||||||
| 2025-07-11 | 13F | Quad-Cities Investment Group, LLC | 50 685 | 8,11 | 1 158 | 13,09 | ||||
| 2025-08-08 | 13F | Mjp Associates Inc /adv | 387 576 | 17,99 | 8 856 | 23,34 | ||||
| 2025-07-28 | 13F | BRYN MAWR TRUST Co | 1 202 | −3,45 | 27 | 0,00 | ||||
| 2025-08-04 | 13F | IFG Advisory, LLC | 20 543 | 469 | ||||||
| 2025-08-13 | 13F | Capital Analysts, Inc. | 13 022 | 7,47 | 0 | |||||
| 2025-08-13 | 13F | StoneX Group Inc. | 23 092 | 0,00 | 528 | 4,56 | ||||
| 2025-04-29 | 13F | Onyx Bridge Wealth Group LLC | 0 | −100,00 | 0 | |||||
| 2025-07-24 | 13F | IFP Advisors, Inc | 24 610 | −3,00 | 562 | 1,44 | ||||
| 2025-08-12 | 13F | Richmond Investment Services, LLC | 14 666 | 335 | ||||||
| 2025-05-27 | NP | XRLX - FundX Conservative ETF | 83 551 | 178,50 | 1 826 | 161,60 | ||||
| 2025-07-18 | 13F | Truist Financial Corp | 94 565 | 11,80 | 2 161 | 16,88 | ||||
| 2025-07-11 | 13F | Farther Finance Advisors, LLC | 71 644 | 1 637 | ||||||
| 2025-07-30 | 13F | BlueChip Wealth Advisors LLC | 19 180 | 0,00 | 438 | 4,53 | ||||
| 2025-08-14 | 13F | Mariner, LLC | 94 321 | −63,06 | 2 155 | −61,39 | ||||
| 2025-08-14 | 13F | Marshall Investment Management, Llc | 0 | −100,00 | 0 | |||||
| 2025-07-23 | 13F | Gentry Private Wealth, Llc | 31 258 | 2,58 | 714 | 7,21 | ||||
| 2025-09-04 | 13F/A | Advisor Group Holdings, Inc. | 386 332 | 12,25 | 8 826 | 17,30 | ||||
| 2025-08-13 | 13F | Gateway Wealth Partners, LLC | 10 262 | 0,00 | 234 | 4,46 | ||||
| 2025-08-05 | 13F | Sigma Planning Corp | 0 | −100,00 | 0 | |||||
| 2025-08-06 | 13F | AE Wealth Management LLC | 34 891 | 3,66 | 797 | 8,44 | ||||
| 2025-08-14 | 13F | Goldman Sachs Group Inc | 0 | −100,00 | 0 | |||||
| 2025-08-28 | NP | TFAFX - Tactical Growth Allocation Fund Class I | 1 370 | 31 | ||||||
| 2025-07-21 | 13F | DHJJ Financial Advisors, Ltd. | 14 | 0,00 | 0 | |||||
| 2025-08-14 | 13F | IHT Wealth Management, LLC | 111 796 | 9,46 | 2 555 | 14,43 | ||||
| 2025-08-12 | 13F | Coldstream Capital Management Inc | 0 | −100,00 | 0 | |||||
| 2025-08-26 | 13F/A | Thrivent Financial For Lutherans | 0 | −100,00 | 0 | |||||
| 2025-04-16 | 13F | Farmers & Merchants Investments Inc | 0 | −100,00 | 0 | |||||
| 2025-08-07 | 13F | Resources Investment Advisors, LLC. | 65 658 | −17,72 | 1 500 | −13,99 | ||||
| 2025-08-13 | 13F | First Trust Advisors Lp | 27 808 | 635 | ||||||
| 2025-08-19 | 13F | Asset Dedication, LLC | 1 922 | 44 | ||||||
| 2025-08-14 | 13F | Warren Averett Asset Management, LLC | 10 304 | 235 | ||||||
| 2025-04-17 | 13F | Authentikos Wealth Advisory, LLC | 0 | −100,00 | 0 | |||||
| 2025-08-14 | 13F | Royal Bank Of Canada | 746 968 | 9,09 | 17 068 | 14,02 | ||||
| 2025-08-14 | 13F | Ausdal Financial Partners, Inc. | 78 222 | 15,08 | 1 787 | 20,34 | ||||
| 2025-08-15 | 13F | Puff Wealth Management, Llc | 48 831 | 3,61 | 1 116 | 8,25 | ||||
| 2025-08-27 | 13F | Barnes Wealth Management Group, Inc | 12 138 | 3,30 | 277 | 8,20 | ||||
| 2025-07-24 | 13F | Us Bancorp \de\ | 18 629 | −3,05 | 426 | 1,19 | ||||
| 2025-08-12 | 13F | J.w. Cole Advisors, Inc. | 23 442 | 51,91 | 536 | 58,75 | ||||
| 2025-08-12 | 13F | NWF Advisory Services Inc. | 0 | −100,00 | 0 | |||||
| 2025-07-30 | 13F | IMG Wealth Management, Inc. | 4 259 | 16,59 | 97 | 22,78 | ||||
| 2025-08-11 | 13F | Private Advisor Group, LLC | 28 083 | 91,93 | 642 | 100,94 | ||||
| 2025-08-14 | 13F | Ameriprise Financial Inc | 10 879 | −8,72 | 249 | −4,62 | ||||
| 2025-08-12 | 13F | SRS Capital Advisors, Inc. | 114 610 | 29,44 | 2 619 | 35,30 | ||||
| 2025-07-16 | 13F | Independent Wealth Network Inc. | 22 575 | −6,95 | 516 | −2,83 | ||||
| 2025-07-10 | 13F | Wealth Enhancement Advisory Services, Llc | 233 154 | −0,91 | 5 353 | 4,08 | ||||
| 2025-08-01 | 13F | Redmond Asset Management, LLC | 15 012 | −15,49 | 343 | −11,60 | ||||
| 2025-07-25 | 13F | Concurrent Investment Advisors, LLC | 93 363 | 17,50 | 2 133 | 22,87 | ||||
| 2025-08-13 | 13F | Quadrature Capital Ltd | 10 552 | 241 | ||||||
| 2025-08-12 | 13F | Proequities, Inc. | 0 | 0 | ||||||
| 2025-08-06 | 13F | Legacy Wealth Managment, LLC/ID | 28 653 | 34,26 | 655 | 40,34 | ||||
| 2025-07-17 | 13F | Janney Capital Management LLC | 129 298 | −0,60 | 3 | 0,00 | ||||
| 2025-08-01 | 13F | GoalVest Advisory LLC | 813 | −5,79 | 19 | 0,00 | ||||
| 2025-08-19 | 13F | National Asset Management, Inc. | 0 | −100,00 | 0 | |||||
| 2025-08-05 | 13F | Bank Of Montreal /can/ | 1 350 | 31 | ||||||
| 2025-08-14 | 13F | Mml Investors Services, Llc | 88 795 | 22,90 | 2 | 100,00 | ||||
| 2025-08-14 | 13F | Aqr Capital Management Llc | 22 682 | −0,25 | 518 | 4,23 | ||||
| 2025-07-16 | 13F | ORG Partners LLC | 2 000 | −75,00 | 46 | −74,29 | ||||
| 2025-08-14 | 13F | Two Sigma Investments, Lp | 448 600 | 10 251 | ||||||
| 2025-08-15 | 13F | Equitable Holdings, Inc. | 129 684 | 5,95 | 2 963 | 10,77 | ||||
| 2025-07-22 | 13F | Ergawealth Advisors, Inc. | 369 549 | 8 444 | ||||||
| 2025-08-14 | 13F/A | Rockefeller Capital Management L.P. | 198 688 | 5,05 | 4 540 | 9,82 | ||||
| 2025-08-19 | 13F | Advisory Services Network, LLC | 0 | −100,00 | 0 | |||||
| 2025-04-22 | 13F | Flagship Harbor Advisors, Llc | 0 | −100,00 | 0 | |||||
| 2025-07-23 | 13F | Kingswood Wealth Advisors, Llc | 49 180 | 7,50 | 1 124 | 11,85 | ||||
| 2025-05-15 | 13F | Concorde Asset Management, LLC | 9 695 | 206 | ||||||
| 2025-07-10 | 13F | Sovran Advisors, LLC | 36 139 | −10,08 | 826 | −1,90 | ||||
| 2025-08-18 | 13F | Tactive Advisors, LLC | 12 347 | 282 |