Grunnleggende statistikk
| Institusjonelle eiere | 157 total, 157 long only, 0 short only, 0 long/short - change of −0,63% MRQ |
| Gjennomsnittlig porteføljeallokering | 0.3039 % - change of −18,22% MRQ |
| Institusjonelle aksjer (Long) | 25 606 205 (ex 13D/G) - change of 0,31MM shares 1,24% MRQ |
| Institusjonell verdi (Long) | $ 755 138 USD ($1000) |
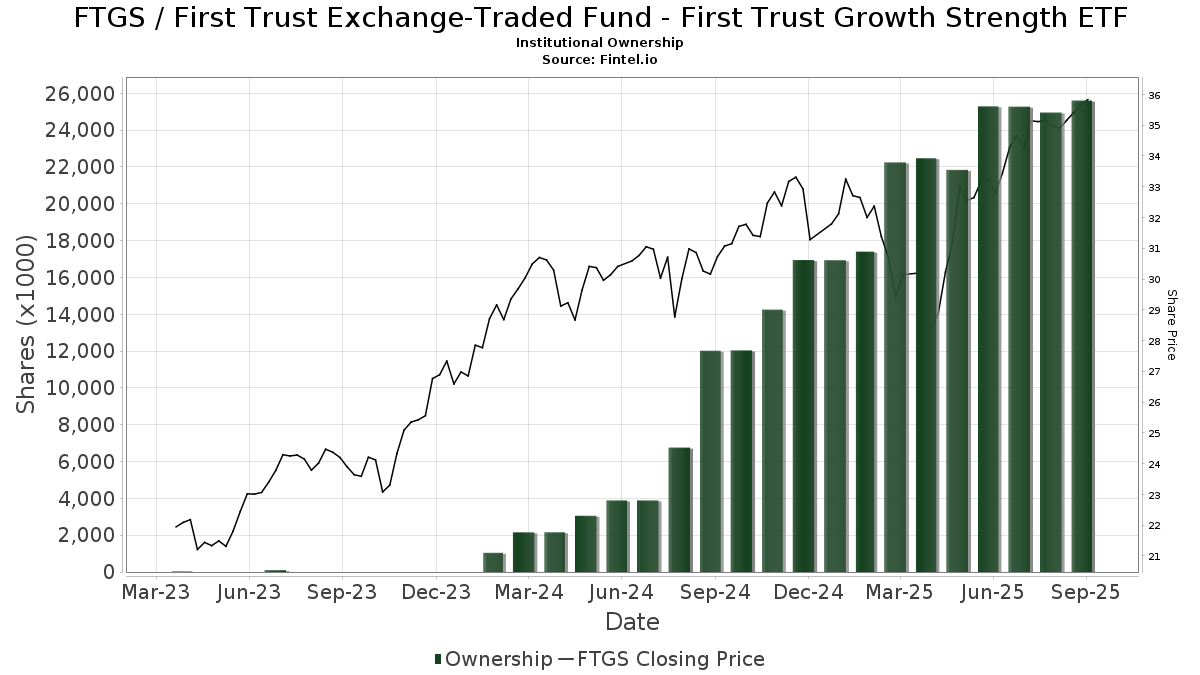
Institusjonelt eierskap og aksjonærer
First Trust Exchange-Traded Fund - First Trust Growth Strength ETF (US:FTGS) har 157 institusjonelle eiere og aksjonærer som har sendt inn 13D/G- eller 13F-skjemaer til Securities Exchange Commission (SEC). Disse institusjonene eier til sammen 25,606,205 aksjer. De største aksjonærene inkluderer LPL Financial LLC, Cwm, Llc, Envestnet Asset Management Inc, Cetera Investment Advisers, Raymond James Financial Inc, Kestra Advisory Services, LLC, Cambridge Investment Research Advisors, Inc., Commonwealth Equity Services, Llc, Morgan Stanley, and Advisor Group Holdings, Inc. .
First Trust Exchange-Traded Fund - First Trust Growth Strength ETF (NasdaqGM:FTGS) institusjonell eierstruktur viser nåværende posisjoner i selskapet fordelt på institusjoner og fond, samt de siste endringene i posisjonsstørrelse. De største aksjonærene kan være individuelle investorer, verdipapirfond, hedgefond eller institusjoner. Schedule 13D indikerer at investoren eier (eller har eid) mer enn 5 % av selskapet og har til hensikt (eller hadde til hensikt) å aktivt forfølge en endring i forretningsstrategien. Schedule 13G indikerer en passiv investering på over 5 %.
The share price as of September 11, 2025 is 36,05 / share. Previously, on September 12, 2024, the share price was 30,37 / share. This represents an increase of 18,70% over that period.
Fondssentiment-score
Fondssentiment Score (også kjent som akkumulering av eierskap poengsum) viser hvilke aksjer som er mest kjøpt av fond. Den er resultatet av en sofistikert, kvantitativ flerfaktormodell som identifiserer selskaper med de høyeste nivåene av institusjonell akkumulering. Beregningsmodellen for poeng bruker en kombinasjon av den totale økningen i antall offentliggjorte eiere, endringer i porteføljeallokeringen til disse eierne og andre beregninger. Tallet går fra 0 til 100, der høyere tall indikerer en høyere grad av akkumulering i forhold til sammenlignbare selskaper, der 50 er gjennomsnittet.
Oppdateringsfrekvens: Daglig
Sjekk ut Ownership Explorer, som inneholder en liste over de høyest rangerte selskapene.
Institusjonell Put/Call-forhold
I tillegg til å rapportere standard aksje- og gjeldsemisjoner må institusjoner med mer enn 100 millioner kroner i forvaltningskapital også oppgi beholdningen av put- og callopsjoner. Siden put-opsjoner generelt indikerer et negativt sentiment, og call-opsjoner indikerer et positivt sentiment, kan vi få et inntrykk av det generelle institusjonelle sentimentet ved å plotte forholdet mellom put- og call-opsjoner. Diagrammet til høyre viser det historiske forholdet mellom put- og call-opsjoner for dette instrumentet.
Ved å bruke Put/Call-forholdet som en indikator på investorsentimentet kan man overvinne en av de viktigste svakhetene ved å bruke totalt institusjonelt eierskap, nemlig at en betydelig andel av forvaltningskapitalen investeres passivt for å følge indekser. Passivt forvaltede fond kjøper vanligvis ikke opsjoner, slik at indikatoren for put/call-forhold i større grad gjenspeiler stemningen i aktivt forvaltede fond.
13F- og NPORT-arkiveringer
Detaljer om 13F-arkiveringer er gratis. Detaljer om NP-arkiveringer krever et premium-medlemskap. Grønne rader indikerer nye posisjoner. Røde rader indikerer lukkede posisjoner. Klikk på lenke ikonet for å se hele transaksjonshistorikken.
Oppgrader
for å låse opp premiedata og eksportere til Excel. ![]() .
.
| Fildato | Kilde | Investor | Type | Gjennomsnittlig pris (estimert) |
Aksjer | Δ Aksjer (%) |
Rapportert verdi ($1000) | Verdi (%) | Portallokering (%) | |
|---|---|---|---|---|---|---|---|---|---|---|
| 2025-07-17 | 13F | Wagner Wealth Management, Llc | 135 | −44,90 | 5 | −42,86 | ||||
| 2025-05-15 | 13F/A | Orion Portfolio Solutions, LLC | 5 436 | −95,20 | 925 | −74,04 | ||||
| 2025-07-16 | 13F | Perigon Wealth Management, LLC | 8 012 | −27,24 | 274 | −16,51 | ||||
| 2025-08-01 | 13F | Rossby Financial, LCC | 2 634 | 0,69 | 90 | 15,38 | ||||
| 2025-07-11 | 13F | Kapstone Financial Advisors LLC | 48 827 | −4,04 | 1 669 | 10,31 | ||||
| 2025-07-15 | 13F | EWG Elevate Inc. | 176 659 | −0,45 | 6 040 | 14,40 | ||||
| 2025-08-14 | 13F | Jane Street Group, Llc | 0 | −100,00 | 0 | |||||
| 2025-08-11 | 13F | Synergy Investment Management, LLC | 0 | −100,00 | 0 | |||||
| 2025-08-14 | 13F | Susquehanna International Group, Llp | 58 099 | 1 986 | ||||||
| 2025-07-01 | 13F | Park National Corp /oh/ | 320 732 | −4,48 | 10 966 | 9,77 | ||||
| 2025-08-14 | 13F | Clg Llc | 62 148 | −14,95 | 2 125 | −2,30 | ||||
| 2025-07-17 | 13F | Barry Investment Advisors, LLC | 17 873 | 0,67 | 611 | 15,72 | ||||
| 2025-08-07 | 13F | Kestra Private Wealth Services, Llc | 180 025 | 5,10 | 6 155 | 20,80 | ||||
| 2025-08-08 | 13F | Kingsview Wealth Management, LLC | 50 715 | −49,64 | 1 734 | −42,16 | ||||
| 2025-08-04 | 13F | Creative Financial Designs Inc /adv | 22 660 | 0,23 | 775 | 15,18 | ||||
| 2025-08-13 | 13F | Transce3nd, LLC | 333 | −21,83 | 11 | −8,33 | ||||
| 2025-08-14 | 13F | Wells Fargo & Company/mn | 52 642 | 2 234,46 | 1 800 | 2 585,07 | ||||
| 2025-07-14 | 13F | Iams Wealth Management, Llc | 115 100 | 0,69 | 3 935 | 15,74 | ||||
| 2025-07-28 | 13F | Harbour Investments, Inc. | 88 749 | 3,03 | 3 034 | 18,42 | ||||
| 2025-08-14 | 13F | Raymond James Financial Inc | 1 189 754 | −0,21 | 40 678 | 14,69 | ||||
| 2025-05-01 | 13F | Quest 10 Wealth Builders, Inc. | 340 | −8,85 | 10 | −9,09 | ||||
| 2025-08-08 | 13F | Cetera Investment Advisers | 1 238 254 | 9,72 | 42 336 | 26,09 | ||||
| 2025-07-09 | 13F | Tounjian Advisory Partners, Llc | 458 528 | −0,94 | 13 641 | −0,94 | ||||
| 2025-08-12 | 13F | Global Retirement Partners, LLC | 20 184 | 9,40 | 690 | 19,17 | ||||
| 2025-08-13 | 13F | Baird Financial Group, Inc. | 173 594 | 2,86 | 5 935 | 18,23 | ||||
| 2025-08-14 | 13F | Goldman Sachs Group Inc | 44 527 | 31,27 | 1 522 | 50,84 | ||||
| 2025-08-18 | 13F | N.E.W. Advisory Services LLC | 1 531 | −99,50 | 52 | −99,43 | ||||
| 2025-07-25 | 13F | Envestnet Portfolio Solutions, Inc. | 27 547 | −65,91 | 942 | −60,84 | ||||
| 2025-07-29 | 13F | International Assets Investment Management, Llc | 22 116 | 5,23 | 756 | 20,96 | ||||
| 2025-07-30 | 13F | D.a. Davidson & Co. | 299 921 | −2,51 | 10 254 | 12,04 | ||||
| 2025-08-07 | 13F | PFG Advisors | 19 152 | −41,46 | 655 | −32,79 | ||||
| 2025-07-23 | 13F | RiverTree Advisors, LLC | 141 617 | −34,08 | 4 842 | −24,25 | ||||
| 2025-07-18 | 13F | Truist Financial Corp | 46 596 | −46,89 | 1 593 | −38,97 | ||||
| 2025-07-14 | 13F | Park Avenue Securities Llc | 60 221 | 2 | ||||||
| 2025-08-11 | 13F | Nations Financial Group Inc, /ia/ /adv | 63 792 | 5,90 | 2 181 | 21,71 | ||||
| 2025-07-23 | 13F | Morey & Quinn Wealth Partners, LLC | 17 934 | 57,40 | 613 | 81,36 | ||||
| 2025-08-07 | 13F | PCG Wealth Advisors, LLC | 0 | −100,00 | 0 | |||||
| 2025-08-14 | 13F | Wiley Bros.-aintree Capital, Llc | 9 698 | 10,29 | 344 | 62,56 | ||||
| 2025-07-15 | 13F | tru Independence LLC | 6 005 | 205 | ||||||
| 2025-08-12 | 13F | CIBC Private Wealth Group, LLC | 407 | 14 | ||||||
| 2025-08-06 | 13F | AE Wealth Management LLC | 117 753 | −32,58 | 4 026 | −22,54 | ||||
| 2025-07-24 | 13F | IFP Advisors, Inc | 117 509 | −8,97 | 4 018 | 4,61 | ||||
| 2025-08-14 | 13F | Stonehaven Wealth & Tax Solutions, Llc | 7 272 | 249 | ||||||
| 2025-07-30 | 13F/A | KPP Advisory Services LLC | 198 514 | 2,43 | 6 787 | 17,73 | ||||
| 2025-07-10 | 13F | Secure Asset Management, LLC | 0 | −100,00 | 0 | |||||
| 2025-04-17 | 13F | American Institute for Advanced Investment Management, LLP | 0 | −100,00 | 0 | −100,00 | ||||
| 2025-07-22 | 13F | DAVENPORT & Co LLC | 6 670 | −1,88 | 228 | 12,87 | ||||
| 2025-08-04 | 13F | Atria Investments Llc | 101 904 | 3,09 | 3 484 | 18,50 | ||||
| 2025-08-06 | 13F | Golden State Wealth Management, LLC | 52 337 | −0,14 | 1 789 | 14,75 | ||||
| 2025-08-12 | 13F | OneAscent Financial Services LLC | 72 960 | −52,42 | 2 | −50,00 | ||||
| 2025-08-13 | 13F | Proactive Wealth Strategies LLC | 60 300 | 0,01 | 2 | 100,00 | ||||
| 2025-07-21 | 13F | Clarity Capital Partners LLC | 9 231 | −18,80 | 316 | −6,80 | ||||
| 2025-07-28 | 13F | RFG Advisory, LLC | 27 105 | 2,59 | 927 | 17,96 | ||||
| 2025-08-11 | 13F | Independent Advisor Alliance | 401 875 | 69,13 | 13 740 | 94,37 | ||||
| 2025-08-14 | 13F | Royal Bank Of Canada | 423 428 | 4,74 | 14 477 | 20,37 | ||||
| 2025-04-21 | 13F | PSI Advisors, LLC | 0 | −100,00 | 0 | |||||
| 2025-07-31 | 13F | West Michigan Advisors, Llc | 153 141 | −3,93 | 5 236 | 10,40 | ||||
| 2025-08-11 | 13F | VSM Wealth Advisory, LLC | 503 | 0,00 | 17 | 21,43 | ||||
| 2025-08-12 | 13F | Steward Partners Investment Advisory, Llc | 47 156 | 10,45 | 1 612 | 26,93 | ||||
| 2025-08-13 | 13F | VestGen Advisors, LLC | 93 359 | 35,10 | 3 192 | 55,28 | ||||
| 2025-08-06 | 13F | Moors & Cabot, Inc. | 60 058 | 6,35 | 2 053 | 22,28 | ||||
| 2025-08-06 | 13F | Prospera Financial Services Inc | 454 762 | −0,43 | 15 549 | 14,43 | ||||
| 2025-07-22 | 13F | Merit Financial Group, LLC | 51 548 | −53,79 | 1 762 | −46,90 | ||||
| 2025-07-30 | 13F | BlueChip Wealth Advisors LLC | 16 192 | 0,00 | 554 | 14,97 | ||||
| 2025-07-25 | 13F | We Are One Seven, LLC | 8 634 | 15,35 | 295 | 32,88 | ||||
| 2025-04-29 | 13F | Onyx Bridge Wealth Group LLC | 0 | −100,00 | 0 | |||||
| 2025-07-15 | 13F | Fifth Third Bancorp | 2 185 | 138,80 | 75 | 174,07 | ||||
| 2025-08-13 | 13F | StoneX Group Inc. | 20 768 | 6,31 | 710 | 22,20 | ||||
| 2025-07-14 | 13F | ABLE Financial Group, LLC | 44 929 | 135,43 | 1 536 | 170,90 | ||||
| 2025-07-10 | 13F | Redhawk Wealth Advisors, Inc. | 10 570 | 5,08 | 361 | 20,74 | ||||
| 2025-07-15 | 13F | BKA Wealth Consulting, Inc. | 0 | −100,00 | 0 | |||||
| 2025-08-13 | 13F | Jones Financial Companies Lllp | 150 | 20,00 | 5 | 66,67 | ||||
| 2025-07-25 | 13F | Atria Wealth Solutions, Inc. | 9 284 | −84,93 | 317 | −82,70 | ||||
| 2025-04-21 | 13F | Nelson, Van Denburg & Campbell Wealth Management Group, LLC | 0 | −100,00 | 0 | |||||
| 2025-09-04 | 13F/A | Advisor Group Holdings, Inc. | 665 133 | 9,38 | 22 663 | 25,28 | ||||
| 2025-04-09 | 13F | St Germain D J Co Inc | 0 | −100,00 | 0 | |||||
| 2025-08-12 | 13F | LPL Financial LLC | 5 043 553 | 15,56 | 172 439 | 32,80 | ||||
| 2025-08-14 | 13F | Integrated Wealth Concepts LLC | 513 859 | 3,36 | 17 569 | 18,78 | ||||
| 2025-08-14 | 13F | Benjamin Edwards Inc | 165 244 | 52,74 | 5 650 | 75,54 | ||||
| 2025-08-12 | 13F | Northeast Planning Associates, Inc. / Nh / | 89 127 | 4,71 | 3 047 | 20,34 | ||||
| 2025-08-11 | 13F | NewEdge Wealth, LLC | 52 199 | −27,48 | 1 808 | −15,55 | ||||
| 2025-08-15 | 13F | Fsb Premier Wealth Management, Inc. | 33 912 | 13,67 | 1 159 | 30,67 | ||||
| 2025-05-15 | 13F | Hilltop Holdings Inc. | 0 | −100,00 | 0 | |||||
| 2025-07-31 | 13F | Hobart Private Capital, LLC | 397 189 | −6,23 | 13 580 | 7,76 | ||||
| 2025-08-08 | 13F | Avantax Advisory Services, Inc. | 196 643 | 14,79 | 6 723 | 31,93 | ||||
| 2025-08-08 | 13F | Foundations Investment Advisors, LLC | 26 218 | −6,87 | 896 | 7,05 | ||||
| 2025-08-14 | 13F | Herold Advisors, Inc. | 13 275 | −33,12 | 454 | −23,22 | ||||
| 2025-08-05 | 13F | EPG Wealth Management LLC | 0 | −100,00 | 0 | |||||
| 2025-08-04 | 13F | IFG Advisory, LLC | 56 006 | 16,33 | 1 915 | 33,66 | ||||
| 2025-08-12 | 13F | Proequities, Inc. | 0 | 0 | ||||||
| 2025-08-14 | 13F | Betterment LLC | 24 040 | 150,91 | 1 | |||||
| 2025-07-02 | 13F | HBW Advisory Services LLC | 20 583 | 5,10 | 704 | 20,79 | ||||
| 2025-07-29 | 13F | Private Trust Co Na | 791 | 29,46 | 27 | 50,00 | ||||
| 2025-07-21 | 13F | Ameritas Advisory Services, LLC | 3 742 | 128 | ||||||
| 2025-08-13 | 13F | Northwestern Mutual Wealth Management Co | 897 | 0,00 | 31 | 15,38 | ||||
| 2025-08-08 | 13F | POM Investment Strategies, LLC | 1 | −100,00 | 0 | −100,00 | ||||
| 2025-08-05 | 13F | Bank of New York Mellon Corp | 117 763 | −6,58 | 4 026 | 7,36 | ||||
| 2025-05-02 | 13F | Capital A Wealth Management, LLC | 0 | −100,00 | 0 | |||||
| 2025-07-11 | 13F | Pinnacle Bancorp, Inc. | 2 086 | 0,00 | 71 | 14,52 | ||||
| 2025-08-06 | 13F | Commonwealth Equity Services, Llc | 849 381 | −12,08 | 29 | 3,57 | ||||
| 2025-08-04 | 13F | Daymark Wealth Partners, Llc | 7 924 | 271 | ||||||
| 2025-07-16 | 13F | ORG Partners LLC | 1 000 | −75,00 | 34 | −71,43 | ||||
| 2025-08-14 | 13F | Great Valley Advisor Group, Inc. | 28 272 | −23,47 | 967 | −12,10 | ||||
| 2025-04-30 | 13F | Allworth Financial LP | 0 | −100,00 | 0 | |||||
| 2025-08-11 | 13F | Private Advisor Group, LLC | 336 920 | 0,35 | 11 519 | 15,33 | ||||
| 2025-07-31 | 13F | Oppenheimer & Co Inc | 10 150 | 347 | ||||||
| 2025-08-14 | 13F | Mariner, LLC | 8 150 | −40,18 | 279 | −31,36 | ||||
| 2025-07-22 | 13F | Comprehensive Financial Consultants Institutional, Inc. | 46 920 | −1,47 | 1 604 | 13,28 | ||||
| 2025-08-11 | 13F/A | Purus Wealth Management, LLC | 14 417 | −1,83 | 493 | 12,84 | ||||
| 2025-04-07 | 13F | GAMMA Investing LLC | 0 | −100,00 | 0 | |||||
| 2025-05-16 | 13F/A | Kestra Investment Management, LLC | 0 | −100,00 | 0 | |||||
| 2025-08-15 | 13F | Kestra Advisory Services, LLC | 1 007 030 | 50,95 | 34 430 | 73,48 | ||||
| 2025-08-05 | 13F | Sigma Planning Corp | 117 320 | −40,75 | 4 011 | −31,91 | ||||
| 2025-08-11 | 13F | Aptus Capital Advisors, LLC | 0 | −100,00 | 0 | |||||
| 2025-04-17 | 13F | Janney Montgomery Scott LLC | 0 | −100,00 | 0 | |||||
| 2025-08-05 | 13F | GPS Wealth Strategies Group, LLC | 11 134 | 588,13 | 381 | 691,67 | ||||
| 2025-08-14 | 13F | LaSalle St. Investment Advisors, LLC | 11 445 | 44,13 | 0 | |||||
| 2025-07-15 | 13F | FLP Wealth Management, LLC | 0 | −100,00 | 0 | |||||
| 2025-07-24 | 13F | Us Bancorp \de\ | 680 | 23 | ||||||
| 2025-07-17 | 13F | Albion Financial Group /ut | 5 735 | 0,00 | 196 | 15,29 | ||||
| 2025-07-15 | 13F | LVZ Advisors, Inc. | 106 729 | −0,35 | 3 649 | 14,53 | ||||
| 2025-08-12 | 13F | J.w. Cole Advisors, Inc. | 10 359 | 6,31 | 354 | 22,49 | ||||
| 2025-07-01 | 13F | Private Client Services, Llc | 14 638 | −6,88 | 500 | 7,07 | ||||
| 2025-07-24 | 13F | Costello Asset Management, INC | 0 | −100,00 | 0 | |||||
| 2025-07-11 | 13F | Farther Finance Advisors, LLC | 35 159 | −13,09 | 1 202 | −0,41 | ||||
| 2025-08-04 | 13F | Arkadios Wealth Advisors | 12 574 | 10,55 | 430 | 26,92 | ||||
| 2025-08-05 | 13F | BEAM Asset Management, LLC | 13 809 | 472 | ||||||
| 2025-08-13 | 13F | Gateway Wealth Partners, LLC | 82 263 | −30,85 | 2 813 | −20,54 | ||||
| 2025-07-22 | 13F | Belpointe Asset Management LLC | 49 525 | −29,48 | 1 693 | −18,96 | ||||
| 2025-08-14 | 13F | CoreCap Advisors, LLC | 67 568 | −12,88 | 2 310 | 0,13 | ||||
| 2025-08-13 | 13F | Smith, Moore & Co. | 7 627 | 261 | ||||||
| 2025-05-15 | 13F | Harvest Investment Services, LLC | 0 | −100,00 | 0 | |||||
| 2025-08-04 | 13F | Assetmark, Inc | 408 466 | 13,39 | 13 965 | 30,31 | ||||
| 2025-08-01 | 13F | Envestnet Asset Management Inc | 1 249 526 | 1,70 | 42 721 | 16,88 | ||||
| 2025-07-29 | 13F | Altus Wealth Group LLC | 42 504 | −1,80 | 1 453 | 12,90 | ||||
| 2025-08-13 | 13F | Flow Traders U.s. Llc | 0 | −100,00 | 0 | |||||
| 2025-07-16 | 13F | American National Bank | 363 | 0,00 | 12 | 20,00 | ||||
| 2025-07-24 | 13F | Ronald Blue Trust, Inc. | 86 | 0,00 | 3 | 0,00 | ||||
| 2025-08-13 | 13F | GeoWealth Management, LLC | 11 254 | 10,31 | 385 | 26,73 | ||||
| 2025-08-14 | 13F | Fmr Llc | 605 | −66,05 | 21 | −62,26 | ||||
| 2025-08-01 | 13F | Wealth Watch Advisors, INC | 25 457 | 13,18 | 870 | 30,04 | ||||
| 2025-07-29 | 13F | ODonnell Financial Services, LLC | 489 668 | 0,73 | 16 742 | 15,77 | ||||
| 2025-08-14 | 13F | Pinnacle Family Advisors, LLC | 55 387 | −16,24 | 1 894 | −3,76 | ||||
| 2025-07-21 | 13F | DHJJ Financial Advisors, Ltd. | 23 638 | 0,70 | 808 | 15,76 | ||||
| 2025-07-15 | 13F | Traction Financial Partners, LLC | 25 645 | 877 | ||||||
| 2025-08-13 | 13F | Maia Wealth LLC | 48 798 | −6,12 | 1 668 | 11,27 | ||||
| 2025-08-18 | 13F | Geneos Wealth Management Inc. | 20 782 | 113,35 | 711 | 145,67 | ||||
| 2025-08-11 | 13F | Mach-1 Financial Group, Inc. | 495 620 | 9,35 | 16 945 | 25,67 | ||||
| 2025-07-29 | 13F | Stratos Wealth Partners, LTD. | 14 367 | 82,79 | 491 | 110,73 | ||||
| 2025-08-04 | 13F | Impact Partnership Wealth, LLC | 12 064 | −22,99 | 412 | −11,59 | ||||
| 2025-08-06 | 13F | Legacy Wealth Managment, LLC/ID | 41 600 | 28,86 | 1 422 | 48,13 | ||||
| 2025-08-15 | 13F | Equitable Holdings, Inc. | 42 656 | 336,69 | 1 458 | 402,76 | ||||
| 2025-08-11 | 13F | Principal Securities, Inc. | 11 265 | −7,15 | 385 | 1,32 | ||||
| 2025-08-15 | 13F | Morgan Stanley | 676 790 | 8,14 | 23 139 | 24,28 | ||||
| 2025-08-14 | 13F | Synovus Financial Corp | 59 982 | −13,78 | 2 051 | −0,87 | ||||
| 2025-08-20 | 13F/A | Coppell Advisory Solutions LLC | 48 046 | −49,40 | 1 630 | −43,40 | ||||
| 2025-07-11 | 13F | SILVER OAK SECURITIES, Inc | 9 806 | −9,25 | 335 | 5,02 | ||||
| 2025-08-06 | 13F | Legacy Investment Solutions, LLC | 41 600 | 39,14 | 1 422 | 46,45 | ||||
| 2025-08-14 | 13F | Citadel Advisors Llc | 62 168 | −26,87 | 2 126 | −15,94 | ||||
| 2025-07-23 | 13F | REAP Financial Group, LLC | 2 833 | 0,00 | 97 | 14,29 | ||||
| 2025-08-14 | 13F | GWM Advisors LLC | 193 833 | 0,90 | 6 627 | 15,98 | ||||
| 2025-08-14 | 13F | UBS Group AG | 0 | −100,00 | 0 | |||||
| 2025-07-08 | 13F | Parallel Advisors, LLC | 25 | 1 | ||||||
| 2025-08-12 | 13F | SRS Capital Advisors, Inc. | 2 538 | −59,42 | 87 | −53,76 | ||||
| 2025-08-14 | 13F | Snowden Capital Advisors LLC | 140 413 | −3,35 | 4 801 | 11,06 | ||||
| 2025-08-06 | 13F | RFG - Bristol Wealth Advisors, LLC | 39 063 | 24,70 | 1 336 | 43,39 | ||||
| 2025-08-14 | 13F | Bank Of America Corp /de/ | 1 433 | −26,85 | 49 | −17,24 | ||||
| 2025-08-14 | 13F | Stifel Financial Corp | 554 413 | 18,27 | 18 957 | 35,93 | ||||
| 2025-07-17 | 13F | Centennial Wealth Advisory LLC | 72 133 | 70,67 | 2 466 | 96,18 | ||||
| 2025-05-01 | 13F | Stephens Inc /ar/ | 0 | −100,00 | 0 | |||||
| 2025-07-22 | 13F | Ergawealth Advisors, Inc. | 21 893 | 14,77 | 749 | 31,92 | ||||
| 2025-05-13 | 13F | O'shaughnessy Asset Management, Llc | 0 | −100,00 | 0 | |||||
| 2025-07-08 | 13F | Nbc Securities, Inc. | 3 057 | 0,00 | 0 | |||||
| 2025-08-04 | 13F | Integrity Alliance, Llc. | 0 | −100,00 | 0 | |||||
| 2025-07-25 | 13F | Cwm, Llc | 1 288 291 | 3,56 | 44 | 18,92 | ||||
| 2025-08-11 | 13F | WPG Advisers, LLC | 13 642 | 23,03 | 466 | 41,64 | ||||
| 2025-08-08 | 13F | Petix & Botte Co | 8 250 | 282 | ||||||
| 2025-08-27 | 13F/A | Brinker Capital Investments, LLC | 80 353 | 1 378,16 | 2 747 | 197,29 | ||||
| 2025-07-17 | 13F | San Luis Wealth Advisors LLC | 0 | −100,00 | 0 | |||||
| 2025-07-25 | 13F | Apollon Wealth Management, LLC | 14 882 | −21,24 | 509 | −9,61 | ||||
| 2025-07-21 | 13F | Ameriflex Group, Inc. | 496 | 0,00 | 17 | 14,29 | ||||
| 2025-07-31 | 13F | Cambridge Investment Research Advisors, Inc. | 958 178 | 22,54 | 33 | 39,13 | ||||
| 2025-08-14 | 13F | Mml Investors Services, Llc | 153 702 | −18,04 | 5 | 0,00 | ||||
| 2025-08-11 | 13F | Western Wealth Management, LLC | 29 235 | −5,52 | 1 000 | 8,59 | ||||
| 2025-08-06 | 13F | New Millennium Group LLC | 0 | 0 | ||||||
| 2025-08-08 | 13F | Good Life Advisors, LLC | 207 815 | 10,71 | 7 105 | 27,24 |
Other Listings
| MX:FTGS |