Grunnleggende statistikk
| Institusjonelle eiere | 119 total, 119 long only, 0 short only, 0 long/short - change of −3,23% MRQ |
| Gjennomsnittlig porteføljeallokering | 0.1128 % - change of 6,78% MRQ |
| Institusjonelle aksjer (Long) | 5 332 634 (ex 13D/G) - change of 0,21MM shares 4,12% MRQ |
| Institusjonell verdi (Long) | $ 339 801 USD ($1000) |
Institusjonelt eierskap og aksjonærer
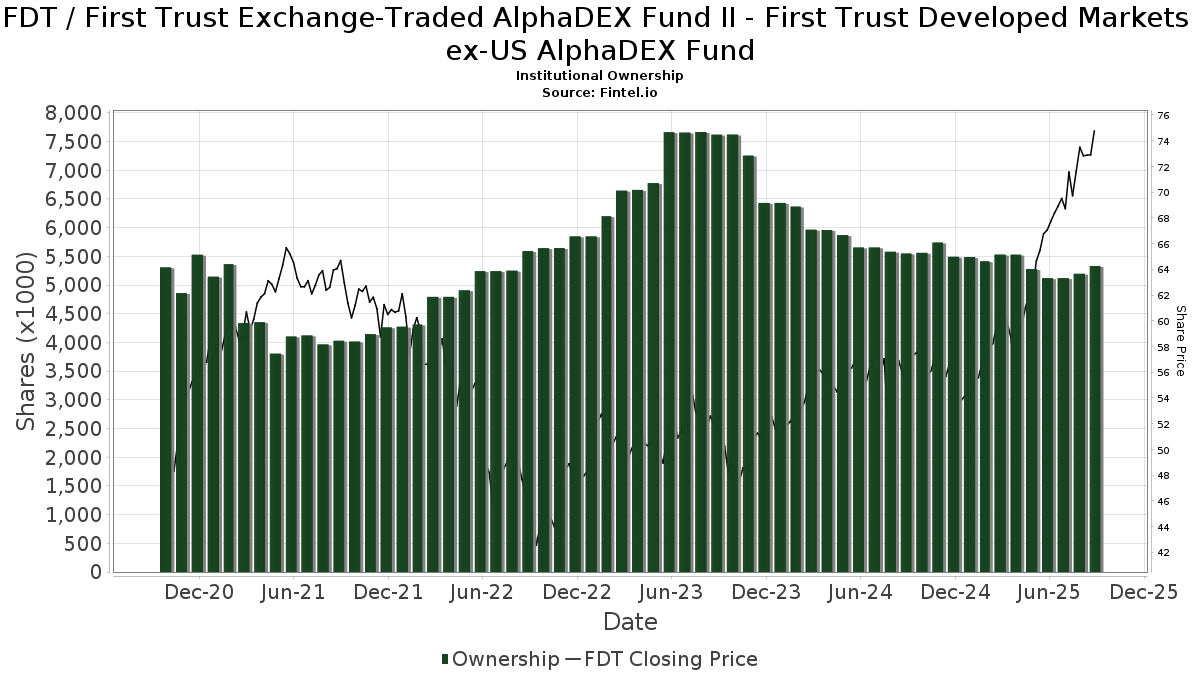
First Trust Exchange-Traded AlphaDEX Fund II - First Trust Developed Markets ex-US AlphaDEX Fund (US:FDT) har 119 institusjonelle eiere og aksjonærer som har sendt inn 13D/G- eller 13F-skjemaer til Securities Exchange Commission (SEC). Disse institusjonene eier til sammen 5,332,634 aksjer. De største aksjonærene inkluderer Morgan Stanley, LPL Financial LLC, Envestnet Asset Management Inc, Wells Fargo & Company/mn, UBS Group AG, Raymond James Financial Inc, Cambridge Investment Research Advisors, Inc., Royal Bank Of Canada, Cetera Investment Advisers, and Kingsview Wealth Management, LLC .
First Trust Exchange-Traded AlphaDEX Fund II - First Trust Developed Markets ex-US AlphaDEX Fund (NasdaqGM:FDT) institusjonell eierstruktur viser nåværende posisjoner i selskapet fordelt på institusjoner og fond, samt de siste endringene i posisjonsstørrelse. De største aksjonærene kan være individuelle investorer, verdipapirfond, hedgefond eller institusjoner. Schedule 13D indikerer at investoren eier (eller har eid) mer enn 5 % av selskapet og har til hensikt (eller hadde til hensikt) å aktivt forfølge en endring i forretningsstrategien. Schedule 13G indikerer en passiv investering på over 5 %.
The share price as of September 10, 2025 is 74,75 / share. Previously, on September 11, 2024, the share price was 55,17 / share. This represents an increase of 35,50% over that period.
Fondssentiment-score
Fondssentiment Score (også kjent som akkumulering av eierskap poengsum) viser hvilke aksjer som er mest kjøpt av fond. Den er resultatet av en sofistikert, kvantitativ flerfaktormodell som identifiserer selskaper med de høyeste nivåene av institusjonell akkumulering. Beregningsmodellen for poeng bruker en kombinasjon av den totale økningen i antall offentliggjorte eiere, endringer i porteføljeallokeringen til disse eierne og andre beregninger. Tallet går fra 0 til 100, der høyere tall indikerer en høyere grad av akkumulering i forhold til sammenlignbare selskaper, der 50 er gjennomsnittet.
Oppdateringsfrekvens: Daglig
Sjekk ut Ownership Explorer, som inneholder en liste over de høyest rangerte selskapene.
Institusjonell Put/Call-forhold
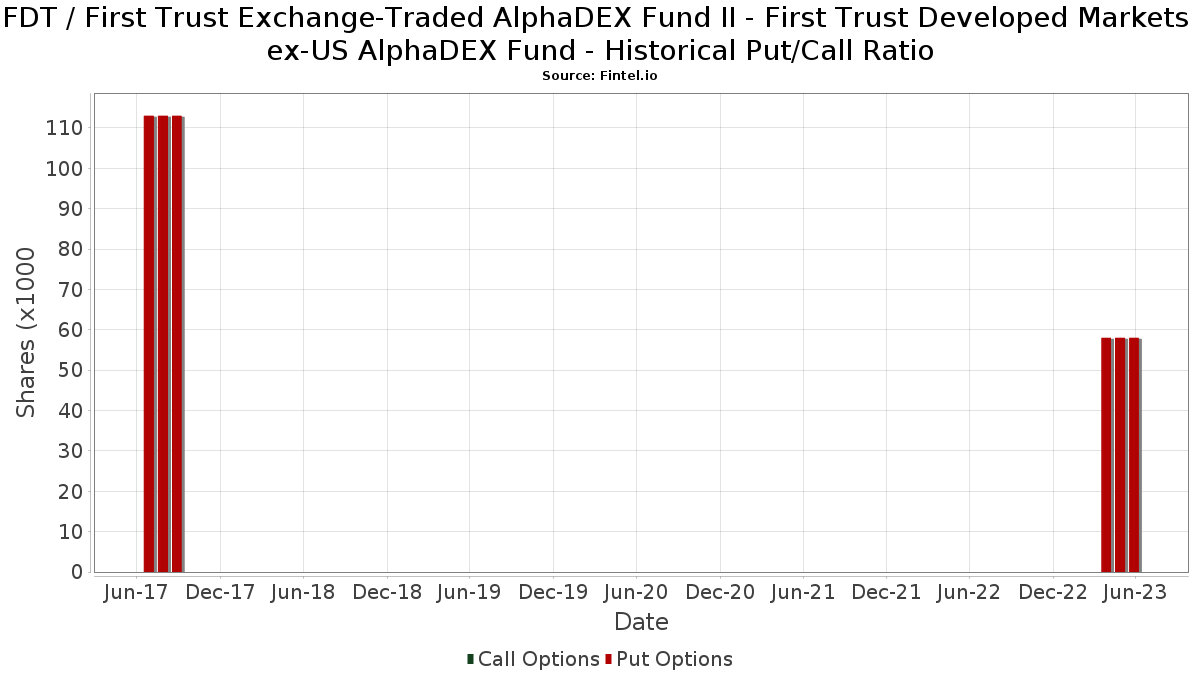
I tillegg til å rapportere standard aksje- og gjeldsemisjoner må institusjoner med mer enn 100 millioner kroner i forvaltningskapital også oppgi beholdningen av put- og callopsjoner. Siden put-opsjoner generelt indikerer et negativt sentiment, og call-opsjoner indikerer et positivt sentiment, kan vi få et inntrykk av det generelle institusjonelle sentimentet ved å plotte forholdet mellom put- og call-opsjoner. Diagrammet til høyre viser det historiske forholdet mellom put- og call-opsjoner for dette instrumentet.
Ved å bruke Put/Call-forholdet som en indikator på investorsentimentet kan man overvinne en av de viktigste svakhetene ved å bruke totalt institusjonelt eierskap, nemlig at en betydelig andel av forvaltningskapitalen investeres passivt for å følge indekser. Passivt forvaltede fond kjøper vanligvis ikke opsjoner, slik at indikatoren for put/call-forhold i større grad gjenspeiler stemningen i aktivt forvaltede fond.
13F- og NPORT-arkiveringer
Detaljer om 13F-arkiveringer er gratis. Detaljer om NP-arkiveringer krever et premium-medlemskap. Grønne rader indikerer nye posisjoner. Røde rader indikerer lukkede posisjoner. Klikk på lenke ikonet for å se hele transaksjonshistorikken.
Oppgrader
for å låse opp premiedata og eksportere til Excel. ![]() .
.
| Fildato | Kilde | Investor | Type | Gjennomsnittlig pris (estimert) |
Aksjer | Δ Aksjer (%) |
Rapportert verdi ($1000) | Verdi (%) | Portallokering (%) | |
|---|---|---|---|---|---|---|---|---|---|---|
| 2025-05-08 | 13F | Great Valley Advisor Group, Inc. | 0 | −100,00 | 0 | −100,00 | ||||
| 2025-07-21 | 13F | Hilltop National Bank | 1 450 | 0,00 | 100 | 26,92 | ||||
| 2025-05-01 | 13F | Quest 10 Wealth Builders, Inc. | 315 | −5,12 | 18 | 5,88 | ||||
| 2025-08-27 | 13F/A | Brinker Capital Investments, LLC | 25 878 | −10,34 | 1 779 | 5,83 | ||||
| 2025-07-08 | 13F | Nbc Securities, Inc. | 5 991 | −42,10 | 0 | |||||
| 2025-08-08 | 13F | Avantax Advisory Services, Inc. | 41 604 | −9,33 | 2 861 | 7,04 | ||||
| 2025-08-12 | 13F | PSI Advisors, LLC | 0 | −100,00 | 0 | |||||
| 2025-07-09 | 13F | Towerpoint Wealth, LLC | 29 051 | 3,55 | 1 998 | 22,22 | ||||
| 2025-08-05 | 13F | Plante Moran Financial Advisors, LLC | 752 | 0,00 | 52 | 18,60 | ||||
| 2025-04-10 | 13F | TrueWealth Advisors, LLC | 0 | −100,00 | 0 | |||||
| 2025-08-06 | 13F | Golden State Wealth Management, LLC | 2 623 | −24,26 | 180 | −10,45 | ||||
| 2025-08-11 | 13F | Tidemark, LLC | 0 | −100,00 | 0 | |||||
| 2025-08-08 | 13F | L & S Advisors Inc | 32 282 | 15,10 | 2 220 | 35,88 | ||||
| 2025-05-02 | 13F | Capital A Wealth Management, LLC | 0 | −100,00 | 0 | |||||
| 2025-08-14 | 13F | Bank Of America Corp /de/ | 84 | −99,85 | 6 | −99,85 | ||||
| 2025-04-11 | 13F | Davis Capital Management | 93 | 0,00 | 5 | 0,00 | ||||
| 2025-08-29 | 13F | Centaurus Financial, Inc. | 1 738 | 0,00 | 0 | |||||
| 2025-08-11 | 13F | Principal Securities, Inc. | 5 734 | 10,02 | 394 | 40,21 | ||||
| 2025-08-11 | 13F | Citigroup Inc | 246 | 0,00 | 17 | 14,29 | ||||
| 2025-07-29 | 13F | Private Trust Co Na | 0 | −100,00 | 0 | |||||
| 2025-08-14 | 13F | GWM Advisors LLC | 7 339 | 73,58 | 505 | 104,88 | ||||
| 2025-07-24 | 13F | Trust Co Of Toledo Na /oh/ | 210 | 14 | ||||||
| 2025-08-06 | 13F | Commonwealth Equity Services, Llc | 24 537 | 1,60 | 2 | 0,00 | ||||
| 2025-08-12 | 13F | LPL Financial LLC | 628 377 | 18,72 | 43 207 | 40,14 | ||||
| 2025-08-08 | 13F | Kingsview Wealth Management, LLC | 153 279 | −4,39 | 10 539 | 12,86 | ||||
| 2025-08-14 | 13F | Snowden Capital Advisors LLC | 32 135 | 0,02 | 2 210 | 18,07 | ||||
| 2025-08-08 | 13F | Pnc Financial Services Group, Inc. | 0 | −100,00 | 0 | |||||
| 2025-07-14 | 13F | ABLE Financial Group, LLC | 7 253 | −1,57 | 499 | 16,08 | ||||
| 2025-08-04 | 13F | Assetmark, Inc | 149 046 | 13,07 | 10 248 | 33,47 | ||||
| 2025-07-17 | 13F | Janney Montgomery Scott LLC | 31 694 | −3,41 | 2 | 100,00 | ||||
| 2025-08-14 | 13F | Raymond James Financial Inc | 215 203 | −21,19 | 14 797 | −6,97 | ||||
| 2025-05-15 | 13F | Baird Financial Group, Inc. | 0 | −100,00 | 0 | |||||
| 2025-07-24 | 13F | Ronald Blue Trust, Inc. | 17 | 0,00 | 1 | |||||
| 2025-08-15 | 13F | Fsb Premier Wealth Management, Inc. | 25 429 | −17,43 | 1 748 | −2,51 | ||||
| 2025-07-18 | 13F | Truist Financial Corp | 34 311 | −5,40 | 2 359 | 11,70 | ||||
| 2025-08-14 | 13F | Comerica Bank | 21 558 | 42,24 | 1 482 | 68,03 | ||||
| 2025-07-24 | 13F | IFP Advisors, Inc | 41 417 | −2,58 | 2 848 | 14,98 | ||||
| 2025-05-15 | 13F | Integrated Wealth Concepts LLC | 0 | −100,00 | 0 | |||||
| 2025-07-16 | 13F | Formidable Asset Management, LLC | 3 745 | 0,00 | 218 | 0,00 | ||||
| 2025-05-14 | 13F | Caitlin John, LLC | 0 | −100,00 | 0 | |||||
| 2025-07-14 | 13F | GAMMA Investing LLC | 1 731 | −2,92 | 119 | 15,53 | ||||
| 2025-07-21 | 13F | Ameritas Advisory Services, LLC | 261 | 18 | ||||||
| 2025-08-13 | 13F | StoneX Group Inc. | 4 439 | −10,59 | 305 | 5,54 | ||||
| 2025-07-11 | 13F | Pinnacle Bancorp, Inc. | 400 | 0,00 | 28 | 17,39 | ||||
| 2025-07-28 | 13F | BRYN MAWR TRUST Co | 600 | 0,00 | 41 | 20,59 | ||||
| 2025-07-30 | 13F | BlueChip Wealth Advisors LLC | 5 763 | 0,00 | 396 | 18,21 | ||||
| 2025-07-02 | 13F | HBW Advisory Services LLC | 6 658 | −2,45 | 458 | 15,11 | ||||
| 2025-07-11 | 13F | Farther Finance Advisors, LLC | 27 385 | 2 548,45 | 1 883 | 3 038,33 | ||||
| 2025-08-01 | 13F | Rossby Financial, LCC | 1 409 | −0,49 | 97 | 12,94 | ||||
| 2025-08-06 | 13F | Prospera Financial Services Inc | 46 084 | −1,37 | 3 169 | 16,43 | ||||
| 2025-08-01 | 13F | Envestnet Asset Management Inc | 424 243 | −2,08 | 29 171 | 15,58 | ||||
| 2025-08-08 | 13F | 1776 Wealth LLC | 3 148 | 216 | ||||||
| 2025-08-13 | 13F | Jones Financial Companies Lllp | 3 754 | 106,49 | 256 | 141,51 | ||||
| 2025-07-25 | 13F | Atria Wealth Solutions, Inc. | 6 139 | −77,08 | 422 | −72,93 | ||||
| 2025-08-05 | 13F | Bank of New York Mellon Corp | 45 410 | −6,87 | 3 122 | 9,93 | ||||
| 2025-08-04 | 13F | IFG Advisory, LLC | 5 161 | 2,08 | 355 | 20,41 | ||||
| 2025-08-13 | 13F | Transce3nd, LLC | 144 | −11,11 | 10 | 0,00 | ||||
| 2025-08-08 | 13F | Glassman Wealth Services | 0 | −100,00 | 0 | |||||
| 2025-08-19 | 13F | National Asset Management, Inc. | 0 | −100,00 | 0 | |||||
| 2025-05-15 | 13F/A | Orion Portfolio Solutions, LLC | 28 863 | −1,73 | 1 681 | 5,86 | ||||
| 2025-08-18 | 13F | Geneos Wealth Management Inc. | 99 | −6,60 | 7 | 0,00 | ||||
| 2025-08-11 | 13F | NewEdge Wealth, LLC | 23 027 | −7,68 | 1 661 | 14,39 | ||||
| 2025-08-13 | 13F | Colonial Trust Advisors | 200 | 0,00 | 14 | 18,18 | ||||
| 2025-07-28 | 13F | Harbour Investments, Inc. | 8 857 | 6,69 | 609 | 26,09 | ||||
| 2025-08-07 | 13F | Allworth Financial LP | 170 | 12 | ||||||
| 2025-09-04 | 13F/A | Advisor Group Holdings, Inc. | 66 835 | 23,52 | 4 533 | 43,81 | ||||
| 2025-07-15 | 13F | Fifth Third Bancorp | 0 | −100,00 | 0 | |||||
| 2025-08-14 | 13F | Two Sigma Securities, Llc | 0 | −100,00 | 0 | |||||
| 2025-08-14 | 13F | Fmr Llc | 281 | −5,07 | 19 | 11,76 | ||||
| 2025-08-13 | 13F | First Trust Advisors Lp | 12 345 | −3,26 | 849 | 14,13 | ||||
| 2025-08-08 | 13F | Larson Financial Group LLC | 2 256 | −7,84 | 155 | 9,15 | ||||
| 2025-08-11 | 13F | SFI Advisors, LLC | 16 560 | −0,46 | 1 139 | 17,44 | ||||
| 2025-08-08 | 13F | Gts Securities Llc | 0 | −100,00 | 0 | |||||
| 2025-07-15 | 13F | LVZ Advisors, Inc. | 33 250 | −0,95 | 2 286 | 16,93 | ||||
| 2025-07-29 | 13F | Stratos Wealth Partners, LTD. | 10 158 | −2,28 | 698 | 15,37 | ||||
| 2025-08-14 | 13F | Mpwm Advisory Solutions, Llc | 7 095 | 488 | ||||||
| 2025-08-12 | 13F | MAI Capital Management | 220 | 0,00 | 15 | 25,00 | ||||
| 2025-08-26 | NP | FIRST TRUST VARIABLE INSURANCE TRUST - First Trust Dorsey Wright Tactical Core Portfolio Class I This fund is a listed as child fund of First Trust Advisors Lp and if that institution has disclosed ownership in this security, then these positions will not be double counted when calculating total shares and total value | 11 171 | −2,05 | 768 | 15,66 | ||||
| 2025-08-12 | 13F | Global Retirement Partners, LLC | 7 099 | −3,59 | 488 | 22,61 | ||||
| 2025-08-04 | 13F | Atria Investments Llc | 50 108 | −4,67 | 3 445 | 12,54 | ||||
| 2025-08-12 | 13F | Jpmorgan Chase & Co | 588 | 352,31 | 40 | 471,43 | ||||
| 2025-08-13 | 13F | Flow Traders U.s. Llc | 0 | −100,00 | 0 | |||||
| 2025-08-14 | 13F | CoreCap Advisors, LLC | 388 | 0,00 | 27 | 18,18 | ||||
| 2025-07-14 | 13F | Park Avenue Securities Llc | 24 316 | 2 | ||||||
| 2025-07-01 | 13F | Private Client Services, Llc | 4 370 | −1,47 | 300 | 16,28 | ||||
| 2025-08-19 | 13F | Newbridge Financial Services Group, Inc. | 275 | 19 | ||||||
| 2025-08-14 | 13F | Pinnacle Family Advisors, LLC | 8 043 | −2,60 | 553 | 14,97 | ||||
| 2025-05-28 | NP | TFAFX - Tactical Growth Allocation Fund Class I | 483 | 28 | ||||||
| 2025-08-12 | 13F | Steward Partners Investment Advisory, Llc | 138 | 0,00 | 9 | 12,50 | ||||
| 2025-08-05 | 13F | Sigma Planning Corp | 6 096 | 6,82 | 419 | 26,20 | ||||
| 2025-08-13 | 13F | GeoWealth Management, LLC | 2 708 | −0,77 | 186 | 17,72 | ||||
| 2025-08-06 | 13F | AE Wealth Management LLC | 44 616 | −23,06 | 3 068 | −9,18 | ||||
| 2025-07-23 | 13F | Element Wealth, LLC | 4 142 | −0,12 | 285 | 17,84 | ||||
| 2025-08-14 | 13F | Benjamin Edwards Inc | 106 772 | 197,89 | 7 342 | 251,75 | ||||
| 2025-08-14 | 13F | UBS Group AG | 218 467 | −0,51 | 15 022 | 17,44 | ||||
| 2025-07-15 | 13F | Traction Financial Partners, LLC | 7 456 | 513 | ||||||
| 2025-08-11 | 13F | Private Advisor Group, LLC | 13 781 | −22,94 | 948 | −9,03 | ||||
| 2025-07-23 | 13F | REAP Financial Group, LLC | 730 | 1,25 | 50 | 21,95 | ||||
| 2025-08-14 | 13F | Wells Fargo & Company/mn | 283 258 | 38,09 | 19 477 | 63,01 | ||||
| 2025-08-04 | 13F | Spire Wealth Management | 19 | 0,00 | 1 | 0,00 | ||||
| 2025-08-01 | 13F | Brookwood Investment Group LLC | 0 | −100,00 | 0 | |||||
| 2025-08-12 | 13F | Proequities, Inc. | 0 | 0 | ||||||
| 2025-08-14 | 13F | Susquehanna International Group, Llp | 64 000 | 4 401 | ||||||
| 2025-07-16 | 13F | American National Bank | 78 | 0,00 | 5 | 25,00 | ||||
| 2025-07-15 | 13F | FLP Wealth Management, LLC | 0 | −100,00 | 0 | |||||
| 2025-07-24 | 13F | Cyndeo Wealth Partners, LLC | 10 153 | 0,00 | 698 | 18,10 | ||||
| 2025-08-15 | 13F | Morgan Stanley | 1 027 689 | −1,75 | 70 664 | 15,98 | ||||
| 2025-07-14 | 13F | Signature Securities Group Corporation | 11 122 | −3,20 | 765 | 14,20 | ||||
| 2025-07-24 | 13F | Us Bancorp \de\ | 6 928 | 476 | ||||||
| 2025-07-25 | 13F | Cwm, Llc | 40 521 | 111,47 | 3 | 100,00 | ||||
| 2025-08-13 | 13F | Northwestern Mutual Wealth Management Co | 938 | 64 | ||||||
| 2025-08-15 | 13F | Kestra Advisory Services, LLC | 13 788 | 1,64 | 948 | 20,00 | ||||
| 2025-08-05 | 13F | EPG Wealth Management LLC | 0 | −100,00 | 0 | |||||
| 2025-08-12 | 13F | CIBC Private Wealth Group, LLC | 51 | 4 | ||||||
| 2025-08-12 | 13F | OneAscent Financial Services LLC | 27 278 | −0,95 | 2 | 0,00 | ||||
| 2025-08-14 | 13F | Mml Investors Services, Llc | 16 617 | 1,19 | 1 | |||||
| 2025-07-25 | 13F | Envestnet Portfolio Solutions, Inc. | 11 140 | −65,75 | 766 | −59,61 | ||||
| 2025-07-30 | 13F | D.a. Davidson & Co. | 17 863 | −0,33 | 1 228 | 17,74 | ||||
| 2025-07-23 | 13F | TPG Financial Advisors, LLC | 58 659 | 0,66 | 4 033 | 18,83 | ||||
| 2025-07-31 | 13F | Cambridge Investment Research Advisors, Inc. | 204 862 | 81,66 | 14 | 133,33 | ||||
| 2025-07-11 | 13F | SILVER OAK SECURITIES, Inc | 15 661 | 1,27 | 1 077 | 18,63 | ||||
| 2025-05-16 | 13F/A | Kestra Investment Management, LLC | 0 | −100,00 | 0 | |||||
| 2025-08-04 | 13F | Arkadios Wealth Advisors | 8 486 | −12,29 | 584 | 3,55 | ||||
| 2025-07-25 | 13F | Apollon Wealth Management, LLC | 5 523 | −1,46 | 380 | 16,26 | ||||
| 2025-08-15 | 13F | Captrust Financial Advisors | 9 072 | −21,08 | 624 | −6,88 | ||||
| 2025-08-07 | 13F | PFG Advisors | 9 779 | −39,04 | 672 | −28,05 | ||||
| 2025-08-14 | 13F | Royal Bank Of Canada | 192 379 | −3,65 | 13 227 | 13,72 | ||||
| 2025-07-29 | 13F | Chicago Partners Investment Group LLC | 3 502 | −4,55 | 251 | 10,13 | ||||
| 2025-07-28 | 13F | RFG Advisory, LLC | 6 443 | −0,46 | 443 | 17,51 | ||||
| 2025-08-08 | 13F | Cetera Investment Advisers | 172 136 | −3,34 | 11 836 | 14,10 | ||||
| 2025-08-20 | 13F/A | Coppell Advisory Solutions LLC | 41 054 | −18,41 | 2 803 | −8,96 | ||||
| 2025-08-05 | 13F | Huntington National Bank | 40 | 18,18 | ||||||
| 2025-07-14 | 13F | Iams Wealth Management, Llc | 20 606 | −9,12 | 1 417 | 7,27 | ||||
| 2025-07-21 | 13F | Synergy Financial Management, LLC | 0 | −100,00 | 0 | |||||
| 2025-08-08 | 13F | Creative Planning | 2 969 | 204 | ||||||
| 2025-08-14 | 13F | Jane Street Group, Llc | 0 | −100,00 | 0 | |||||
| 2025-08-14 | 13F | LaSalle St. Investment Advisors, LLC | 7 376 | 2,03 | 1 | |||||
| 2025-08-08 | 13F | Petix & Botte Co | 3 972 | 0,00 | 273 | 18,18 | ||||
| 2025-05-15 | 13F | Mariner, LLC | 0 | −100,00 | 0 | |||||
| 2025-08-12 | 13F | SRS Capital Advisors, Inc. | 240 | 0,00 | 17 | 23,08 | ||||
| 2025-08-13 | 13F | Gateway Wealth Partners, LLC | 29 251 | −15,25 | 2 011 | 0,05 | ||||
| 2025-08-04 | 13F | Waterfront Wealth Inc. | 10 640 | −4,06 | 732 | 13,33 | ||||
| 2025-07-17 | 13F | Mainsail Financial Group, LLC | 80 716 | 0,73 | 5 524 | 18,36 | ||||
| 2025-08-11 | 13F | Synergy Investment Management, LLC | 0 | −100,00 | 0 | |||||
| 2025-08-14 | 13F | Stifel Financial Corp | 100 953 | 181,50 | 6 941 | 232,42 |
Other Listings
| MX:FDT |