Grunnleggende statistikk
| Institusjonelle eiere | 144 total, 144 long only, 0 short only, 0 long/short - change of 7,41% MRQ |
| Gjennomsnittlig porteføljeallokering | 0.4807 % - change of 7,54% MRQ |
| Institusjonelle aksjer (Long) | 25 335 825 (ex 13D/G) - change of 2,62MM shares 11,55% MRQ |
| Institusjonell verdi (Long) | $ 782 787 USD ($1000) |
Institusjonelt eierskap og aksjonærer
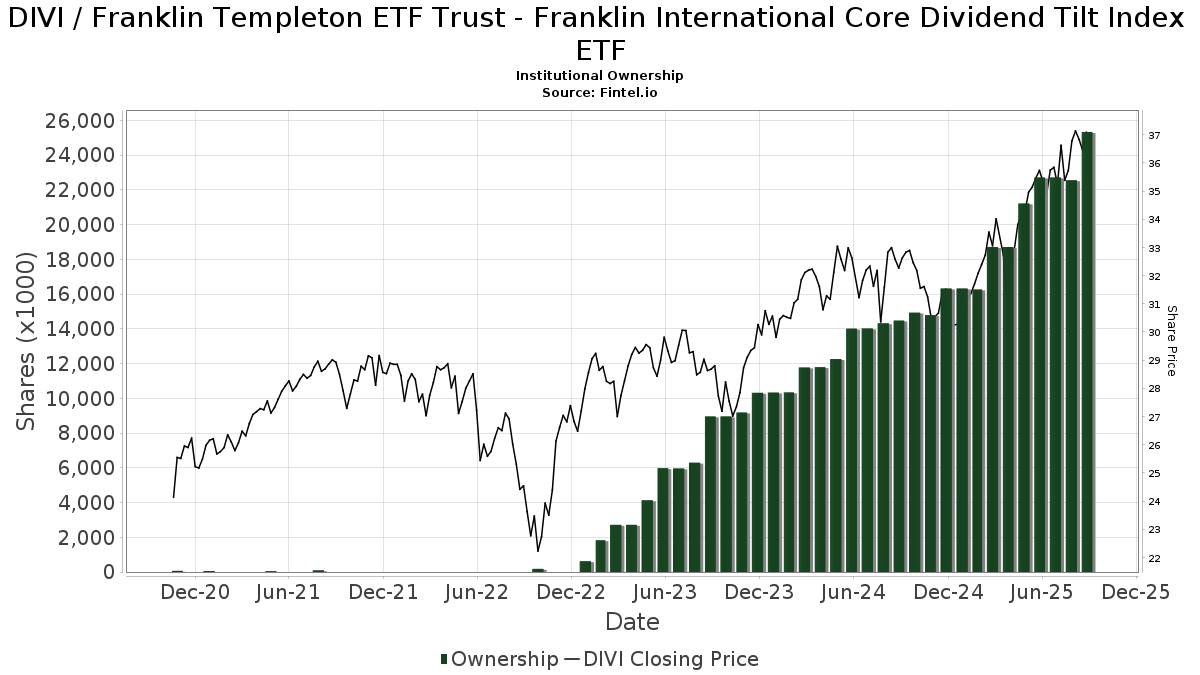
Franklin Templeton ETF Trust - Franklin International Core Dividend Tilt Index ETF (US:DIVI) har 144 institusjonelle eiere og aksjonærer som har sendt inn 13D/G- eller 13F-skjemaer til Securities Exchange Commission (SEC). Disse institusjonene eier til sammen 25,335,825 aksjer. De største aksjonærene inkluderer Retirement Planning Group, LPL Financial LLC, Bank Of America Corp /de/, Capital Analysts, Inc., Legacy Financial Advisors, Inc., Cwm, Llc, Raymond James Financial Inc, Northwestern Mutual Wealth Management Co, GWM Advisors LLC, and Baron Wealth Management LLC .
Franklin Templeton ETF Trust - Franklin International Core Dividend Tilt Index ETF (ARCA:DIVI) institusjonell eierstruktur viser nåværende posisjoner i selskapet fordelt på institusjoner og fond, samt de siste endringene i posisjonsstørrelse. De største aksjonærene kan være individuelle investorer, verdipapirfond, hedgefond eller institusjoner. Schedule 13D indikerer at investoren eier (eller har eid) mer enn 5 % av selskapet og har til hensikt (eller hadde til hensikt) å aktivt forfølge en endring i forretningsstrategien. Schedule 13G indikerer en passiv investering på over 5 %.
The share price as of September 11, 2025 is 37,52 / share. Previously, on September 12, 2024, the share price was 32,54 / share. This represents an increase of 15,30% over that period.
Fondssentiment-score
Fondssentiment Score (også kjent som akkumulering av eierskap poengsum) viser hvilke aksjer som er mest kjøpt av fond. Den er resultatet av en sofistikert, kvantitativ flerfaktormodell som identifiserer selskaper med de høyeste nivåene av institusjonell akkumulering. Beregningsmodellen for poeng bruker en kombinasjon av den totale økningen i antall offentliggjorte eiere, endringer i porteføljeallokeringen til disse eierne og andre beregninger. Tallet går fra 0 til 100, der høyere tall indikerer en høyere grad av akkumulering i forhold til sammenlignbare selskaper, der 50 er gjennomsnittet.
Oppdateringsfrekvens: Daglig
Sjekk ut Ownership Explorer, som inneholder en liste over de høyest rangerte selskapene.
Institusjonell Put/Call-forhold
I tillegg til å rapportere standard aksje- og gjeldsemisjoner må institusjoner med mer enn 100 millioner kroner i forvaltningskapital også oppgi beholdningen av put- og callopsjoner. Siden put-opsjoner generelt indikerer et negativt sentiment, og call-opsjoner indikerer et positivt sentiment, kan vi få et inntrykk av det generelle institusjonelle sentimentet ved å plotte forholdet mellom put- og call-opsjoner. Diagrammet til høyre viser det historiske forholdet mellom put- og call-opsjoner for dette instrumentet.
Ved å bruke Put/Call-forholdet som en indikator på investorsentimentet kan man overvinne en av de viktigste svakhetene ved å bruke totalt institusjonelt eierskap, nemlig at en betydelig andel av forvaltningskapitalen investeres passivt for å følge indekser. Passivt forvaltede fond kjøper vanligvis ikke opsjoner, slik at indikatoren for put/call-forhold i større grad gjenspeiler stemningen i aktivt forvaltede fond.
13F- og NPORT-arkiveringer
Detaljer om 13F-arkiveringer er gratis. Detaljer om NP-arkiveringer krever et premium-medlemskap. Grønne rader indikerer nye posisjoner. Røde rader indikerer lukkede posisjoner. Klikk på lenke ikonet for å se hele transaksjonshistorikken.
Oppgrader
for å låse opp premiedata og eksportere til Excel. ![]() .
.
| Fildato | Kilde | Investor | Type | Gjennomsnittlig pris (estimert) |
Aksjer | Δ Aksjer (%) |
Rapportert verdi ($1000) | Verdi (%) | Portallokering (%) | |
|---|---|---|---|---|---|---|---|---|---|---|
| 2025-08-13 | 13F | Cary Street Partners Financial Llc | 140 173 | 0,00 | 4 996 | 9,35 | ||||
| 2025-07-16 | 13F/A | CX Institutional | 23 254 | −6,14 | 1 | |||||
| 2025-07-18 | 13F | Powers Advisory Group, LLC | 30 329 | 55,58 | 1 081 | 70,08 | ||||
| 2025-07-15 | 13F | Burns Matteson Capital Management, LLC | 8 100 | −3,77 | 289 | 5,11 | ||||
| 2025-08-12 | 13F | Proequities, Inc. | 0 | 0 | ||||||
| 2025-08-12 | 13F | LPL Financial LLC | 3 905 450 | 3,69 | 139 190 | 13,40 | ||||
| 2025-08-06 | 13F | AE Wealth Management LLC | 70 | 0,00 | 2 | 0,00 | ||||
| 2025-07-31 | 13F | Sage Mountain Advisors LLC | 379 | 0,00 | 14 | 8,33 | ||||
| 2025-08-14 | 13F | Bank Of America Corp /de/ | 1 519 906 | 138,40 | 54 169 | 160,72 | ||||
| 2025-08-14 | 13F | Mml Investors Services, Llc | 53 544 | 12,05 | 2 | 0,00 | ||||
| 2025-07-25 | 13F | Cwm, Llc | 830 491 | 17,00 | 30 | 26,09 | ||||
| 2025-07-24 | 13F | Ridgeline Wealth Planning, LLC | 111 469 | 7,62 | 3 973 | 17,69 | ||||
| 2025-08-05 | 13F | Bank Of Montreal /can/ | 6 773 | 6,91 | 241 | 16,99 | ||||
| 2025-08-14 | 13F | Royal Bank Of Canada | 23 157 | 350,09 | 825 | 391,07 | ||||
| 2025-07-28 | 13F | Harbour Investments, Inc. | 54 281 | −49,33 | 1 935 | −44,60 | ||||
| 2025-07-08 | 13F | Parallel Advisors, LLC | 121 | 1,68 | 4 | 33,33 | ||||
| 2025-07-24 | 13F | IFP Advisors, Inc | 5 813 | −19,92 | 207 | −12,29 | ||||
| 2025-07-11 | 13F | SILVER OAK SECURITIES, Inc | 6 765 | −6,46 | 241 | 1,69 | ||||
| 2025-08-14 | 13F | Fmr Llc | 5 529 | 120,89 | 197 | 143,21 | ||||
| 2025-08-14 | 13F | Benjamin Edwards Inc | 26 473 | 0,00 | 943 | 9,40 | ||||
| 2025-07-17 | 13F | Kelly Financial Services LLC | 47 719 | 1 701 | ||||||
| 2025-08-13 | 13F | EverSource Wealth Advisors, LLC | 0 | −100,00 | 0 | |||||
| 2025-08-15 | 13F | Morgan Stanley | 622 | −88,19 | 22 | −87,13 | ||||
| 2025-07-09 | 13F | Baron Wealth Management LLC | 678 704 | 93,77 | 24 189 | 111,91 | ||||
| 2025-08-12 | 13F | SRS Capital Advisors, Inc. | 1 224 | 44 | ||||||
| 2025-08-11 | 13F | Tidemark, LLC | 4 559 | 59,85 | 162 | 76,09 | ||||
| 2025-08-13 | 13F | Jones Financial Companies Lllp | 120 073 | 57,67 | 4 277 | 71,04 | ||||
| 2025-08-25 | 13F | Silverlake Wealth Management Llc | 21 787 | 12,55 | 776 | 23,17 | ||||
| 2025-08-07 | 13F | LOM Asset Management Ltd | 7 155 | 0 | ||||||
| 2025-04-28 | 13F | Rosenberg Matthew Hamilton | 0 | −100,00 | 0 | −100,00 | ||||
| 2025-08-06 | 13F | Commonwealth Equity Services, Llc | 174 616 | −11,66 | 6 | 0,00 | ||||
| 2025-08-13 | 13F | StoneX Group Inc. | 6 665 | 238 | ||||||
| 2025-07-16 | 13F | Perigon Wealth Management, LLC | 6 934 | 247 | ||||||
| 2025-08-11 | 13F | Cascade Wealth Advisors, Inc | 7 720 | 280 | ||||||
| 2025-08-14 | 13F | Federation des caisses Desjardins du Quebec | 715 | 0,00 | 25 | 8,70 | ||||
| 2025-07-29 | 13F | Stratos Wealth Partners, LTD. | 7 488 | 5,30 | 267 | 15,15 | ||||
| 2025-08-05 | 13F | GPS Wealth Strategies Group, LLC | 200 | 0,00 | 7 | 16,67 | ||||
| 2025-08-13 | 13F | Northwestern Mutual Wealth Management Co | 734 473 | 30,07 | 26 177 | 42,25 | ||||
| 2025-05-12 | 13F | Independent Advisor Alliance | 0 | −100,00 | 0 | |||||
| 2025-07-25 | 13F | Atria Wealth Solutions, Inc. | 0 | −100,00 | 0 | |||||
| 2025-07-22 | 13F | Valley National Advisers Inc | 0 | −100,00 | 0 | |||||
| 2025-08-12 | 13F | Titleist Asset Management, Llc | 20 548 | −20,92 | 732 | −13,48 | ||||
| 2025-05-06 | 13F | PFG Advisors | 0 | −100,00 | 0 | |||||
| 2025-08-12 | 13F | Coldstream Capital Management Inc | 0 | −100,00 | 0 | |||||
| 2025-08-12 | 13F | Jpmorgan Chase & Co | 14 395 | 23,36 | 513 | 35,00 | ||||
| 2025-08-14 | 13F | Visionary Wealth Advisors | 81 671 | 2 911 | ||||||
| 2025-08-14 | 13F | Wells Fargo & Company/mn | 288 | 28 700,00 | 10 | |||||
| 2025-08-14 | 13F | Stifel Financial Corp | 242 446 | 18,89 | 8 641 | 30,02 | ||||
| 2025-08-04 | 13F | Savvy Advisors, Inc. | 13 146 | −2,81 | 469 | 6,36 | ||||
| 2025-08-04 | 13F | Atria Investments Llc | 6 164 | 220 | ||||||
| 2025-08-07 | 13F | Winch Advisory Services, LLC | 246 | 0,00 | 9 | 0,00 | ||||
| 2025-08-19 | 13F | Advisory Services Network, LLC | 5 842 | 205 | ||||||
| 2025-07-17 | 13F | Nelson, Van Denburg & Campbell Wealth Management Group, LLC | 6 157 | 0,00 | 219 | 9,50 | ||||
| 2025-08-11 | 13F | Ritter Daniher Financial Advisory LLC / DE | 2 | 0 | ||||||
| 2025-07-22 | 13F | Integrated Capital Management, LLC | 303 380 | 5,50 | 11 | 11,11 | ||||
| 2025-08-13 | 13F | Lido Advisors, LLC | 24 781 | 22,14 | 883 | 33,59 | ||||
| 2025-07-29 | 13F | Fundamentun, Llc | 15 964 | 569 | ||||||
| 2025-07-10 | 13F | Redhawk Wealth Advisors, Inc. | 8 244 | 1,80 | 294 | 11,41 | ||||
| 2025-08-08 | 13F | Empower Advisory Group, LLC | 11 489 | 0,00 | 409 | 9,36 | ||||
| 2025-08-11 | 13F | Slagle Financial, LLC | 37 316 | 17,05 | 1 330 | 28,03 | ||||
| 2025-07-29 | 13F | Goldstein Advisors, LLC | 16 796 | −0,55 | 599 | 8,73 | ||||
| 2025-07-16 | 13F | Owen LaRue, LLC | 107 419 | −0,51 | 3 828 | 8,81 | ||||
| 2025-07-31 | 13F | Hartford Financial Management Inc. | 1 946 | −19,52 | 69 | −11,54 | ||||
| 2025-07-14 | 13F | Sowell Financial Services LLC | 34 611 | 15,64 | 1 234 | 26,46 | ||||
| 2025-08-14 | 13F | Jane Street Group, Llc | 381 022 | 1,14 | 13 580 | 10,61 | ||||
| 2025-07-16 | 13F | Novem Group | 58 601 | −2,50 | 2 089 | 6,64 | ||||
| 2025-08-14 | 13F | Susquehanna International Group, Llp | 0 | −100,00 | 0 | |||||
| 2025-08-01 | 13F | Envestnet Asset Management Inc | 210 825 | 41,08 | 7 514 | 54,27 | ||||
| 2025-08-14 | 13F | Betterment LLC | 9 397 | −3,89 | 0 | |||||
| 2025-08-07 | 13F | Allworth Financial LP | 350 | 0,86 | 12 | 9,09 | ||||
| 2025-08-14 | 13F | Raymond James Financial Inc | 752 548 | 35,11 | 26 821 | 47,75 | ||||
| 2025-07-29 | 13F | Tradewinds Capital Management, LLC | 0 | −100,00 | 0 | |||||
| 2025-07-31 | 13F | CAP Partners, LLC | 19 468 | 6,45 | 694 | 16,28 | ||||
| 2025-08-12 | 13F | Cornerstone Wealth Management, LLC | 26 107 | 3,44 | 930 | 13,14 | ||||
| 2025-07-25 | 13F | Evolution Advisers, Inc. | 2 | 0,00 | 0 | |||||
| 2025-08-14 | 13F | Ameriprise Financial Inc | 91 711 | 79,71 | 3 269 | 96,63 | ||||
| 2025-07-28 | 13F | RFG Advisory, LLC | 30 441 | 19,17 | 1 085 | 30,29 | ||||
| 2025-07-17 | 13F | Prepared Retirement Institute LLC | 114 223 | 1,24 | 4 071 | 10,72 | ||||
| 2025-08-12 | 13F | Steward Partners Investment Advisory, Llc | 56 240 | 99,33 | 2 004 | 118,06 | ||||
| 2025-08-14 | 13F | GWM Advisors LLC | 683 764 | 3,83 | 24 369 | 13,55 | ||||
| 2025-07-10 | 13F | Exchange Traded Concepts, Llc | 874 | 31 | ||||||
| 2025-08-14 | 13F | CoreCap Advisors, LLC | 959 | 0,00 | 34 | 9,68 | ||||
| 2025-08-13 | 13F | Royal Fund Management, LLC | 16 083 | −1,06 | 573 | 8,32 | ||||
| 2025-05-13 | 13F | UBS Group AG | 0 | −100,00 | 0 | |||||
| 2025-07-07 | 13F | Whitaker-Myers Wealth Managers, LTD. | 22 018 | 9,44 | 785 | 19,69 | ||||
| 2025-08-11 | 13F | Principal Securities, Inc. | 3 608 | −3,24 | 129 | 15,32 | ||||
| 2025-08-08 | 13F | Avantax Advisory Services, Inc. | 24 882 | 14,91 | 887 | 25,67 | ||||
| 2025-07-29 | 13F | Private Trust Co Na | 7 926 | −0,60 | 282 | 8,88 | ||||
| 2025-07-29 | 13F | LMG Wealth Partners, LLC | 249 684 | 2,31 | 8 899 | 11,88 | ||||
| 2025-08-08 | 13F | Crossmark Global Holdings, Inc. | 12 167 | 1,82 | 432 | 11,95 | ||||
| 2025-08-08 | 13F | Thoroughbred Financial Services, Llc | 131 978 | −38,81 | 5 | −42,86 | ||||
| 2025-07-11 | 13F | OxenFree Capital LLC | 47 594 | 0,03 | 1 696 | 10,78 | ||||
| 2025-08-12 | 13F | Change Path, LLC | 69 655 | 6,12 | 2 482 | 16,04 | ||||
| 2025-08-18 | 13F | Geneos Wealth Management Inc. | 250 | 0,00 | 9 | 0,00 | ||||
| 2025-07-02 | 13F | HBW Advisory Services LLC | 45 253 | 230,80 | 1 613 | 262,25 | ||||
| 2025-07-24 | 13F | Ronald Blue Trust, Inc. | 250 | 0,00 | 9 | 0,00 | ||||
| 2025-08-08 | 13F | Capital Investment Advisory Services, LLC | 70 | 0,00 | 2 | 0,00 | ||||
| 2025-08-14 | 13F | Great Valley Advisor Group, Inc. | 20 616 | 96,03 | 734 | 113,99 | ||||
| 2025-07-29 | 13F | Koshinski Asset Management, Inc. | 353 793 | 14,01 | 12 609 | 24,68 | ||||
| 2025-08-27 | 13F | Barnes Wealth Management Group, Inc | 7 759 | −2,22 | 277 | 6,98 | ||||
| 2025-07-30 | 13F | Castle Wealth Management Llc | 127 160 | 2,09 | 4 532 | 11,63 | ||||
| 2025-09-04 | 13F/A | Advisor Group Holdings, Inc. | 107 454 | 6,16 | 3 830 | 16,10 | ||||
| 2025-08-05 | 13F | Bank of New York Mellon Corp | 261 023 | 46,17 | 9 303 | 59,86 | ||||
| 2025-08-13 | 13F | Flow Traders U.s. Llc | 65 452 | −32,04 | 2 | −33,33 | ||||
| 2025-07-09 | 13F | Defined Wealth Management, Llc | 119 474 | −1,28 | 4 258 | 7,96 | ||||
| 2025-07-30 | 13F | Crewe Advisors LLC | 1 592 | 57 | ||||||
| 2025-08-07 | 13F | AllGen Financial Advisors, Inc. | 303 123 | 10 803 | ||||||
| 2025-07-14 | 13F | AdvisorNet Financial, Inc | 3 010 | 0,00 | 107 | 9,18 | ||||
| 2025-07-16 | 13F | Highline Wealth Partners Llc | 0 | −100,00 | 0 | |||||
| 2025-07-18 | 13F | Midwest Financial Group LLC | 34 511 | 94,26 | 1 230 | 112,63 | ||||
| 2025-08-12 | 13F | Global Retirement Partners, LLC | 1 208 | 1 489,47 | 43 | 2 050,00 | ||||
| 2025-08-27 | 13F/A | Brinker Capital Investments, LLC | 45 903 | 0,04 | 1 636 | 9,36 | ||||
| 2025-08-12 | 13F | Absolute Capital Management, LLC | 45 000 | 0,00 | 1 604 | 9,35 | ||||
| 2025-06-11 | 13F | Fortitude Financial, LLC | 29 225 | 0,00 | 952 | 8,55 | ||||
| 2025-08-15 | 13F | Equitable Holdings, Inc. | 136 352 | 8,50 | 4 860 | 18,66 | ||||
| 2025-07-16 | 13F | Meridian Financial, LLC | 11 714 | 9,04 | 417 | 19,14 | ||||
| 2025-07-14 | 13F | Southland Equity Partners LLC | 40 423 | 6,45 | 1 441 | 16,41 | ||||
| 2025-04-28 | 13F | Financial Advocates Investment Management | 0 | −100,00 | 0 | |||||
| 2025-07-17 | 13F | Janney Montgomery Scott LLC | 117 339 | −29,23 | 4 | −20,00 | ||||
| 2025-07-23 | 13F | TriaGen Wealth Management LLC | 468 136 | 13,33 | 16 684 | 23,93 | ||||
| 2025-04-21 | 13F | Envestnet Portfolio Solutions, Inc. | 0 | −100,00 | 0 | |||||
| 2025-04-28 | 13F | Smart Money Group LLC | 0 | −100,00 | 0 | |||||
| 2025-08-19 | 13F | Cape Investment Advisory, Inc. | 1 316 | 0,00 | 47 | 9,52 | ||||
| 2025-07-28 | 13F | Mutual Advisors, LLC | 106 332 | 0,83 | 3 859 | 9,20 | ||||
| 2025-08-11 | 13F | Private Advisor Group, LLC | 97 106 | −34,76 | 3 461 | −28,66 | ||||
| 2025-08-13 | 13F | Capital Analysts, Inc. | 1 335 749 | 116,33 | 48 | 135,00 | ||||
| 2025-08-08 | 13F | Cetera Investment Advisers | 636 711 | 9,51 | 22 692 | 19,76 | ||||
| 2025-08-12 | 13F | O'shaughnessy Asset Management, Llc | 391 | 14 | ||||||
| 2025-08-05 | 13F | Sigma Planning Corp | 5 943 | 212 | ||||||
| 2025-08-28 | NP | AAMAX - Absolute Capital Asset Allocator Fund Class A Shares | 45 000 | 0,00 | 1 604 | 9,35 | ||||
| 2025-07-18 | 13F | Truist Financial Corp | 8 228 | 293 | ||||||
| 2025-05-15 | 13F/A | Orion Portfolio Solutions, LLC | 45 886 | 1,38 | 1 495 | 10,09 | ||||
| 2025-08-05 | 13F | BCGM Wealth Management, LLC | 12 610 | −88,09 | 449 | −86,99 | ||||
| 2025-08-14 | 13F | Citadel Advisors Llc | 73 294 | 661,10 | 2 612 | 734,50 | ||||
| 2025-08-07 | 13F | Kestra Private Wealth Services, Llc | 449 890 | 10,18 | 16 034 | 20,49 | ||||
| 2025-07-30 | 13F | Retirement Planning Group | 4 475 833 | 5,09 | 159 519 | 14,93 | ||||
| 2025-07-31 | 13F | Oppenheimer & Co Inc | 59 880 | 0,44 | 2 134 | 9,89 | ||||
| 2025-08-15 | 13F | Kestra Advisory Services, LLC | 226 501 | 14,61 | 8 072 | 25,34 | ||||
| 2025-08-14 | 13F | Mariner, LLC | 432 808 | −15,70 | 15 425 | −7,81 | ||||
| 2025-08-15 | 13F | Koesten, Hirschmann & Crabtree, INC. | 20 | 0,00 | 1 | |||||
| 2025-08-07 | 13F | Legacy Financial Advisors, Inc. | 877 208 | 2,02 | 31 264 | 11,56 | ||||
| 2025-07-03 | 13F | First Hawaiian Bank | 139 987 | 41,79 | 4 989 | 55,08 | ||||
| 2025-07-21 | 13F | Ameritas Advisory Services, LLC | 1 963 | 70 | ||||||
| 2025-08-04 | 13F | Flagship Harbor Advisors, Llc | 404 307 | −0,39 | 14 409 | 8,93 | ||||
| 2025-07-31 | 13F | Cambridge Investment Research Advisors, Inc. | 228 842 | −74,01 | 8 | −71,43 | ||||
| 2025-08-14 | 13F | Wiley Bros.-aintree Capital, Llc | 141 930 | 99,58 | 5 058 | 116,62 | ||||
| 2025-08-15 | 13F | Cornerstone Financial Group, LLC /NE/ | 7 441 | 0,45 | 265 | 4,33 | ||||
| 2025-08-14 | 13F | Comerica Bank | 2 960 | −9,40 | 105 | −0,94 | ||||
| 2025-08-08 | 13F | Emerald Investment Partners, Llc | 5 276 | 1,00 | 188 | 10,59 | ||||
| 2025-07-11 | 13F | Farther Finance Advisors, LLC | 1 187 | 1,80 | 42 | 10,53 | ||||
| 2025-08-12 | 13F | Vickerman Investment Advisors, Inc. | 354 086 | 6,80 | 12 620 | 16,79 | ||||
| 2025-08-26 | NP | FTRAX - Franklin LifeSmart Retirement Income Fund CLASS A | 40 500 | −1,70 | 1 443 | 7,53 | ||||
| 2025-08-14 | 13F | Clark Capital Management Group, Inc. | 26 113 | 0,00 | 931 | 9,28 | ||||
| 2025-08-15 | 13F/A | MONECO Advisors, LLC | 0 | −100,00 | 0 | −100,00 | ||||
| 2025-07-23 | 13F | Godsey & Gibb Associates | 0 | −100,00 | 0 | −100,00 | ||||
| 2025-08-12 | 13F | J.w. Cole Advisors, Inc. | 19 296 | 0,07 | 688 | 9,39 | ||||
| 2025-08-12 | 13F | Franklin Resources Inc | 40 966 | −1,75 | 1 460 | 7,51 | ||||
| 2025-08-06 | 13F | Prospera Financial Services Inc | 38 217 | −0,26 | 1 362 | 9,05 | ||||
| 2025-08-07 | 13F | Blackston Financial Advisory Group, LLC | 10 550 | −9,32 | 376 | −0,79 | ||||
| 2025-08-14 | 13F | Sunbelt Securities, Inc. | 85 | 0,00 | 3 | 0,00 | ||||
| 2025-08-26 | 13F/A | Thrivent Financial For Lutherans | 87 614 | 3 |