Grunnleggende statistikk
| Institusjonelle eiere | 95 total, 95 long only, 0 short only, 0 long/short - change of 9,20% MRQ |
| Gjennomsnittlig porteføljeallokering | 0.3877 % - change of −26,56% MRQ |
| Institusjonelle aksjer (Long) | 4 812 862 (ex 13D/G) - change of 0,04MM shares 0,74% MRQ |
| Institusjonell verdi (Long) | $ 216 888 USD ($1000) |
Institusjonelt eierskap og aksjonærer
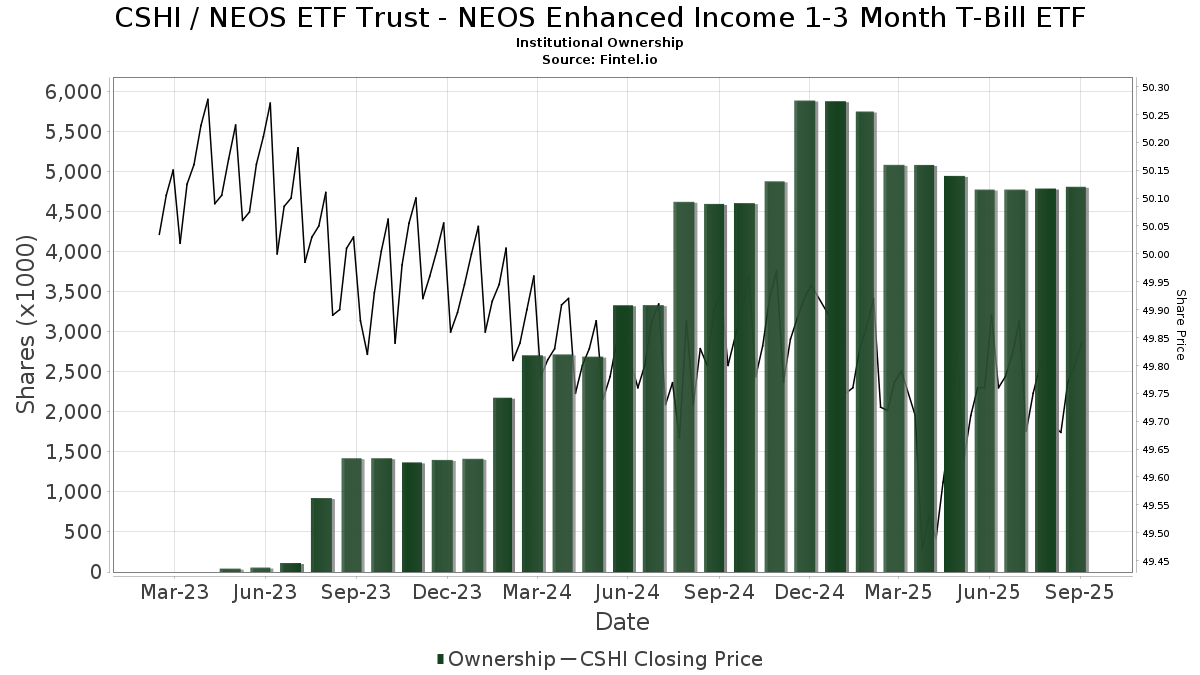
NEOS ETF Trust - NEOS Enhanced Income 1-3 Month T-Bill ETF (US:CSHI) har 95 institusjonelle eiere og aksjonærer som har sendt inn 13D/G- eller 13F-skjemaer til Securities Exchange Commission (SEC). Disse institusjonene eier til sammen 4,812,862 aksjer. De største aksjonærene inkluderer Richard P Slaughter Associates Inc, Gradient Investments LLC, LPL Financial LLC, Atticus Wealth Management, Llc, Commonwealth Equity Services, Llc, Retirement Planning Group, Gainplan LLC, Grantvest Financial Group LLC, Stratos Wealth Partners, LTD., and Integrated Wealth Concepts LLC .
NEOS ETF Trust - NEOS Enhanced Income 1-3 Month T-Bill ETF (ARCA:CSHI) institusjonell eierstruktur viser nåværende posisjoner i selskapet fordelt på institusjoner og fond, samt de siste endringene i posisjonsstørrelse. De største aksjonærene kan være individuelle investorer, verdipapirfond, hedgefond eller institusjoner. Schedule 13D indikerer at investoren eier (eller har eid) mer enn 5 % av selskapet og har til hensikt (eller hadde til hensikt) å aktivt forfølge en endring i forretningsstrategien. Schedule 13G indikerer en passiv investering på over 5 %.
The share price as of September 12, 2025 is 49,82 / share. Previously, on September 16, 2024, the share price was 49,92 / share. This represents a decline of 0,21% over that period.
Fondssentiment-score
Fondssentiment Score (også kjent som akkumulering av eierskap poengsum) viser hvilke aksjer som er mest kjøpt av fond. Den er resultatet av en sofistikert, kvantitativ flerfaktormodell som identifiserer selskaper med de høyeste nivåene av institusjonell akkumulering. Beregningsmodellen for poeng bruker en kombinasjon av den totale økningen i antall offentliggjorte eiere, endringer i porteføljeallokeringen til disse eierne og andre beregninger. Tallet går fra 0 til 100, der høyere tall indikerer en høyere grad av akkumulering i forhold til sammenlignbare selskaper, der 50 er gjennomsnittet.
Oppdateringsfrekvens: Daglig
Sjekk ut Ownership Explorer, som inneholder en liste over de høyest rangerte selskapene.
Institusjonell Put/Call-forhold
I tillegg til å rapportere standard aksje- og gjeldsemisjoner må institusjoner med mer enn 100 millioner kroner i forvaltningskapital også oppgi beholdningen av put- og callopsjoner. Siden put-opsjoner generelt indikerer et negativt sentiment, og call-opsjoner indikerer et positivt sentiment, kan vi få et inntrykk av det generelle institusjonelle sentimentet ved å plotte forholdet mellom put- og call-opsjoner. Diagrammet til høyre viser det historiske forholdet mellom put- og call-opsjoner for dette instrumentet.
Ved å bruke Put/Call-forholdet som en indikator på investorsentimentet kan man overvinne en av de viktigste svakhetene ved å bruke totalt institusjonelt eierskap, nemlig at en betydelig andel av forvaltningskapitalen investeres passivt for å følge indekser. Passivt forvaltede fond kjøper vanligvis ikke opsjoner, slik at indikatoren for put/call-forhold i større grad gjenspeiler stemningen i aktivt forvaltede fond.
13F- og NPORT-arkiveringer
Detaljer om 13F-arkiveringer er gratis. Detaljer om NP-arkiveringer krever et premium-medlemskap. Grønne rader indikerer nye posisjoner. Røde rader indikerer lukkede posisjoner. Klikk på lenke ikonet for å se hele transaksjonshistorikken.
Oppgrader
for å låse opp premiedata og eksportere til Excel. ![]() .
.
| Fildato | Kilde | Investor | Type | Gjennomsnittlig pris (estimert) |
Aksjer | Δ Aksjer (%) |
Rapportert verdi ($1000) | Verdi (%) | Portallokering (%) | |
|---|---|---|---|---|---|---|---|---|---|---|
| 2025-07-09 | 13F | Dynamic Advisor Solutions LLC | 28 432 | −15,82 | 1 414 | −15,69 | ||||
| 2025-08-01 | 13F | Brinker Capital Investments, LLC | 0 | −100,00 | 0 | −100,00 | ||||
| 2025-08-12 | 13F | Global Retirement Partners, LLC | 5 374 | −8,15 | 267 | −8,25 | ||||
| 2025-07-16 | 13F | Essex Financial Services, Inc. | 10 334 | 6,11 | 514 | 6,21 | ||||
| 2025-08-14 | 13F | IHT Wealth Management, LLC | 5 000 | −1,98 | 249 | −1,98 | ||||
| 2025-08-14 | 13F | UBS Group AG | 1 672 | 83 | ||||||
| 2025-08-05 | 13F | Claro Advisors LLC | 18 528 | −20,10 | 921 | −19,91 | ||||
| 2025-08-14 | 13F | Royal Bank Of Canada | 0 | −100,00 | 0 | |||||
| 2025-08-11 | 13F | Cannon Advisors, Inc. | 24 626 | −21,08 | 1 225 | −20,93 | ||||
| 2025-08-14 | 13F | Citadel Advisors Llc | 8 935 | −39,63 | 444 | −39,51 | ||||
| 2025-07-14 | 13F | Ridgewood Investments LLC | 900 | 0,00 | 45 | 0,00 | ||||
| 2025-08-06 | 13F | Commonwealth Equity Services, Llc | 271 409 | 6 165,21 | 13 | |||||
| 2025-08-14 | 13F | Raymond James Financial Inc | 77 | 4 | ||||||
| 2025-04-23 | 13F | International Assets Investment Management, Llc | 0 | −100,00 | 0 | −100,00 | ||||
| 2025-07-23 | 13F | Gainplan LLC | 176 822 | 7,40 | 8 793 | 7,63 | ||||
| 2025-07-08 | 13F | Parallel Advisors, LLC | 306 | 150,82 | 15 | 150,00 | ||||
| 2025-07-29 | 13F | Mattson Financial Services, LLC | 7 221 | −2,71 | 359 | −2,45 | ||||
| 2025-08-08 | 13F | Capital Investment Advisory Services, LLC | 117 845 | 12,15 | 5 860 | 12,37 | ||||
| 2025-08-14 | 13F | Stifel Financial Corp | 68 734 | −3,41 | 3 418 | −3,20 | ||||
| 2025-08-07 | 13F | Summit X, LLC | 47 766 | 2 375 | ||||||
| 2025-04-30 | 13F | Capital Insight Partners, Llc | 0 | −100,00 | 0 | |||||
| 2025-08-11 | 13F | Private Advisor Group, LLC | 15 547 | 773 | ||||||
| 2025-08-11 | 13F | Nations Financial Group Inc, /ia/ /adv | 7 294 | 363 | ||||||
| 2025-07-08 | 13F | Nbc Securities, Inc. | 5 260 | −8,59 | 0 | |||||
| 2025-07-10 | 13F | Worth Asset Management, LLC | 7 976 | −92,57 | 397 | −92,57 | ||||
| 2025-09-10 | 13F | WT Wealth Management | 39 355 | −18,61 | 1 957 | −18,42 | ||||
| 2025-04-24 | 13F | Decker Retirement Planning Inc. | 0 | −100,00 | 0 | |||||
| 2025-08-14 | 13F | MGB Wealth Management, LLC | 1 500 | 75 | ||||||
| 2025-07-10 | 13F | Secure Asset Management, LLC | 4 117 | −17,84 | 205 | −17,74 | ||||
| 2025-07-22 | 13F | Wealthcare Advisory Partners LLC | 58 976 | 1 004,21 | 2 933 | 1 006,42 | ||||
| 2025-08-06 | 13F | Rps Advisory Solutions Llc | 4 501 | −64,12 | 224 | −64,15 | ||||
| 2025-07-25 | 13F | Cwm, Llc | 22 011 | 1 | ||||||
| 2025-08-06 | 13F | New Millennium Group LLC | 1 | 0 | ||||||
| 2025-08-08 | 13F | Hartland & Co., LLC | 7 187 | 0,28 | 357 | 0,56 | ||||
| 2025-08-14 | 13F | Napa Wealth Management | 26 989 | −82,56 | 1 342 | −82,53 | ||||
| 2025-05-13 | 13F | Aptus Capital Advisors, LLC | 0 | −100,00 | 0 | |||||
| 2025-05-16 | 13F | Coppell Advisory Solutions LLC | 0 | −100,00 | 0 | |||||
| 2025-07-08 | 13F | Gradient Investments LLC | 429 661 | −0,68 | 21 367 | −0,48 | ||||
| 2025-08-08 | 13F | Larson Financial Group LLC | 328 | 1,55 | 16 | 0,00 | ||||
| 2025-07-21 | 13F | DHJJ Financial Advisors, Ltd. | 410 | 0,00 | 20 | 0,00 | ||||
| 2025-07-17 | 13F | Nelson, Van Denburg & Campbell Wealth Management Group, LLC | 0 | −100,00 | 0 | |||||
| 2025-07-30 | 13F | Retirement Planning Group | 242 407 | −9,37 | 12 055 | −9,19 | ||||
| 2025-07-08 | 13F | Richard P Slaughter Associates Inc | 600 007 | 2,17 | 29 838 | 2,38 | ||||
| 2025-08-14 | 13F | Old Mission Capital Llc | 30 326 | −72,15 | 1 508 | −72,09 | ||||
| 2025-08-18 | 13F | Tactive Advisors, LLC | 24 179 | 181,25 | 1 202 | 180,84 | ||||
| 2025-08-13 | 13F | Empire Financial Management Company, LLC | 11 894 | −0,31 | 592 | −0,17 | ||||
| 2025-07-10 | 13F | PMV Capital Advisers, LLC | 8 170 | −1,74 | 406 | −1,46 | ||||
| 2025-05-14 | 13F | Ameriprise Financial Inc | 0 | −100,00 | 0 | −100,00 | ||||
| 2025-07-11 | 13F | Farther Finance Advisors, LLC | 2 428 | 121 | ||||||
| 2025-07-18 | 13F | Precision Wealth Strategies, LLC | 115 220 | 11,01 | 5 730 | 11,22 | ||||
| 2025-07-29 | 13F | Latitude Advisors, LLC | 27 214 | −5,79 | 1 353 | −5,58 | ||||
| 2025-08-06 | 13F | Cherry Creek Investment Advisors, Inc. | 5 287 | 28,51 | 263 | 28,43 | ||||
| 2025-04-22 | 13F | Bright Futures Wealth Management, LLC. | 13 849 | 117,55 | 686 | 116,77 | ||||
| 2025-08-01 | 13F | Gwn Securities Inc. | 0 | −100,00 | 0 | |||||
| 2025-05-19 | 13F/A | Jane Street Group, Llc | 0 | −100,00 | 0 | −100,00 | ||||
| 2025-08-13 | 13F | Flow Traders U.s. Llc | 5 948 | −79,55 | 0 | −100,00 | ||||
| 2025-08-14 | 13F | Susquehanna International Group, Llp | 0 | −100,00 | 0 | |||||
| 2025-08-01 | 13F | FSA Advisors, Inc. | 70 165 | 343,41 | 3 489 | 322,91 | ||||
| 2025-07-25 | 13F | We Are One Seven, LLC | 7 051 | −48,89 | 351 | −48,83 | ||||
| 2025-07-28 | 13F | Mutual Advisors, LLC | 50 710 | 39,36 | 2 522 | 39,82 | ||||
| 2025-08-04 | 13F | Creative Financial Designs Inc /adv | 600 | 0,00 | 30 | 0,00 | ||||
| 2025-08-14 | 13F | Mml Investors Services, Llc | 145 960 | −16,14 | 7 | −12,50 | ||||
| 2025-08-11 | 13F | Cornerstone Planning Group LLC | 0 | −100,00 | 0 | |||||
| 2025-07-22 | 13F | Berger Financial Group, Inc | 4 064 | 202 | ||||||
| 2025-08-12 | 13F | LPL Financial LLC | 414 929 | 29,80 | 20 634 | 30,06 | ||||
| 2025-07-14 | 13F | AdvisorNet Financial, Inc | 0 | −100,00 | 0 | |||||
| 2025-07-29 | 13F | Private Trust Co Na | 2 000 | 0,00 | 99 | 0,00 | ||||
| 2025-08-14 | 13F | CoreCap Advisors, LLC | 17 695 | 79,28 | 880 | 79,75 | ||||
| 2025-08-14 | 13F | Atomi Financial Group, Inc. | 142 523 | 25,30 | 7 088 | 25,54 | ||||
| 2025-09-04 | 13F/A | Advisor Group Holdings, Inc. | 28 715 | −88,36 | 1 428 | −88,34 | ||||
| 2025-08-14 | 13F | Ausdal Financial Partners, Inc. | 7 447 | 370 | ||||||
| 2025-08-15 | 13F | Global View Capital Management LLC | 34 655 | −9,73 | 1 723 | −9,55 | ||||
| 2025-08-01 | 13F | United Capital Management of KS, Inc. | 4 991 | −2,61 | 248 | −2,36 | ||||
| 2025-08-14 | 13F | Mercer Global Advisors Inc /adv | 61 861 | −23,55 | 3 076 | −23,39 | ||||
| 2025-08-14 | 13F | GWM Advisors LLC | 53 479 | −2,35 | 2 660 | −2,13 | ||||
| 2025-08-14 | 13F | Integrated Wealth Concepts LLC | 149 629 | 5,35 | 7 441 | 5,58 | ||||
| 2025-05-15 | 13F | Bank Of America Corp /de/ | 0 | −100,00 | 0 | |||||
| 2025-08-14 | 13F | Camarda Financial Advisors, LLC | 28 928 | −57,77 | 1 439 | −57,69 | ||||
| 2025-08-06 | 13F | AE Wealth Management LLC | 80 | 9,59 | 4 | 0,00 | ||||
| 2025-07-16 | 13F | Owen LaRue, LLC | 29 088 | 89,81 | 1 447 | 90,26 | ||||
| 2025-08-13 | 13F | First Trust Advisors Lp | 4 187 | −4,56 | 208 | −4,15 | ||||
| 2025-08-12 | 13F | Gladstone Institutional Advisory LLC | 60 219 | 5,63 | 2 995 | 5,83 | ||||
| 2025-08-15 | 13F | Equitable Holdings, Inc. | 10 307 | −8,84 | 513 | −8,73 | ||||
| 2025-08-15 | 13F | Brown Financial Advisors | 16 965 | −2,49 | 844 | −2,32 | ||||
| 2025-08-06 | 13F | Able Wealth Management LLC | 17 714 | 881 | ||||||
| 2025-08-12 | 13F | Steward Partners Investment Advisory, Llc | 1 956 | 5,50 | 97 | 5,43 | ||||
| 2025-08-01 | 13F | Ashton Thomas Private Wealth, LLC | 19 807 | 2,30 | 985 | 2,60 | ||||
| 2025-07-29 | 13F | Stratos Wealth Partners, LTD. | 156 635 | 32,20 | 7 789 | 32,47 | ||||
| 2025-07-23 | 13F | MADDEN SECURITIES Corp | 25 865 | 1 286 | ||||||
| 2025-07-31 | 13F | Cambridge Investment Research Advisors, Inc. | 0 | −100,00 | 0 | |||||
| 2025-07-11 | 13F | SILVER OAK SECURITIES, Inc | 9 921 | −1,28 | 493 | −1,00 | ||||
| 2025-07-23 | 13F | Heck Capital Advisors, LLC | 13 594 | 20,00 | 676 | 20,28 | ||||
| 2025-08-14 | 13F | Sunbelt Securities, Inc. | 0 | −100,00 | 0 | |||||
| 2025-05-14 | 13F | Delta Investment Management, LLC | 0 | −100,00 | 0 | |||||
| 2025-04-28 | 13F | D.a. Davidson & Co. | 0 | −100,00 | 0 | |||||
| 2025-08-11 | 13F | Inspire Advisors, LLC | 42 224 | 20,59 | 2 100 | 20,84 | ||||
| 2025-08-01 | 13F | Envestnet Asset Management Inc | 12 071 | −5,25 | 600 | −5,06 | ||||
| 2025-08-15 | 13F | Morgan Stanley | 1 | 0,00 | 0 | |||||
| 2025-05-14 | 13F | Orion Portfolio Solutions, LLC | 25 394 | 0,00 | 1 265 | 0,00 | ||||
| 2025-08-06 | 13F | Legacy Investment Solutions, LLC | 2 | −98,40 | 0 | −100,00 | ||||
| 2025-08-12 | 13F | Proequities, Inc. | 0 | 0 | ||||||
| 2025-04-17 | 13F | Great Lakes Retirement, Inc. | 0 | −100,00 | 0 | |||||
| 2025-08-11 | 13F | HighTower Advisors, LLC | 39 625 | 9,09 | 1 971 | 9,32 | ||||
| 2025-07-08 | 13F | Paladin Wealth, LLC | 17 826 | −7,75 | 886 | −7,61 | ||||
| 2025-08-22 | 13F | Carter Financial Group, INC. | 9 562 | 476 | ||||||
| 2025-08-12 | 13F | CIBC Private Wealth Group, LLC | 720 | 0,00 | 36 | 0,00 | ||||
| 2025-07-29 | 13F | Madison Wealth Partners, Inc | 13 525 | −37,49 | 673 | −37,37 | ||||
| 2025-08-14 | 13F | Fmr Llc | 4 | 300,00 | 0 | |||||
| 2025-08-13 | 13F | Capital Analysts, Inc. | 545 | 0 | ||||||
| 2025-07-10 | 13F | Atticus Wealth Management, Llc | 336 056 | −10,49 | 16 712 | −10,30 | ||||
| 2025-08-13 | 13F | Grantvest Financial Group LLC | 162 287 | 18,81 | 8 071 | 19,06 | ||||
| 2025-08-06 | 13F | Legacy Wealth Managment, LLC/ID | 2 | −95,12 | 0 | −100,00 | ||||
| 2025-04-23 | 13F | Spire Wealth Management | 0 | −100,00 | 0 | |||||
| 2025-07-22 | 13F | Belpointe Asset Management LLC | 17 391 | −9,86 | 865 | −9,72 | ||||
| 2025-08-04 | 13F | Impact Partnership Wealth, LLC | 12 497 | 621 | ||||||
| 2025-08-07 | 13F | Allworth Financial LP | 11 633 | 2,86 | 578 | 3,21 | ||||
| 2025-08-14 | 13F | Warren Averett Asset Management, LLC | 7 734 | −10,50 | 385 | −10,28 |