Grunnleggende statistikk
| Institusjonelle eiere | 94 total, 94 long only, 0 short only, 0 long/short - change of 2,17% MRQ |
| Gjennomsnittlig porteføljeallokering | 0.7822 % - change of −6,93% MRQ |
| Institusjonelle aksjer (Long) | 15 842 798 (ex 13D/G) - change of 2,74MM shares 20,88% MRQ |
| Institusjonell verdi (Long) | $ 408 930 USD ($1000) |
Institusjonelt eierskap og aksjonærer
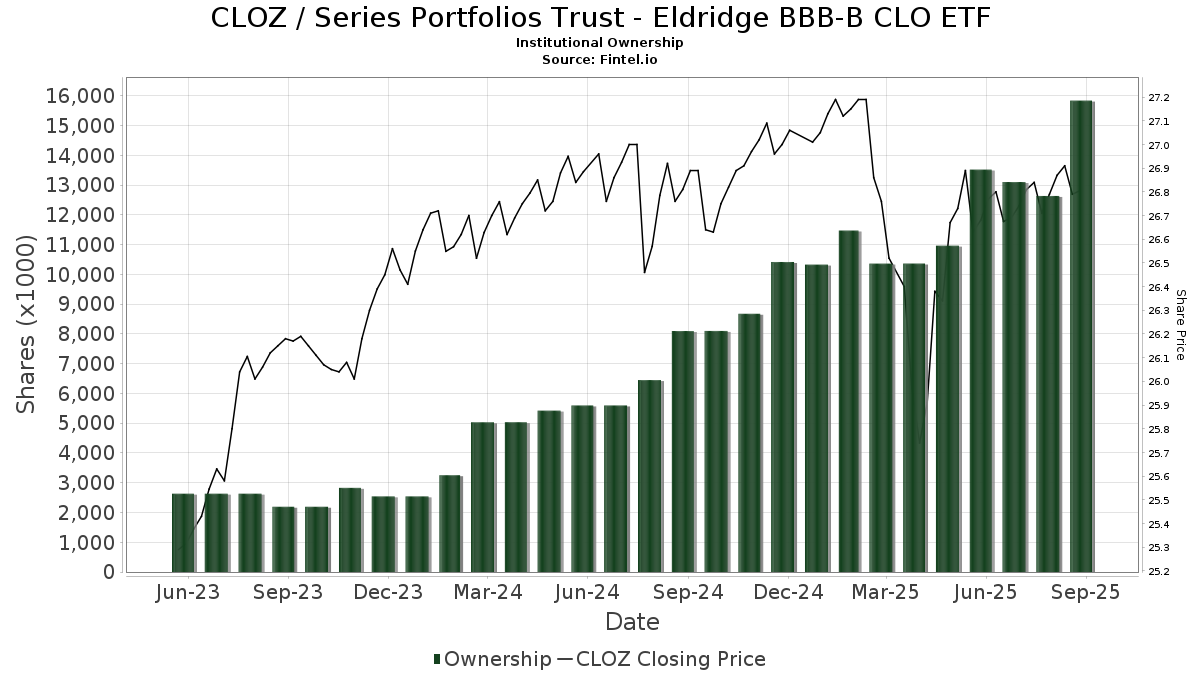
Series Portfolios Trust - Eldridge BBB-B CLO ETF (US:CLOZ) har 94 institusjonelle eiere og aksjonærer som har sendt inn 13D/G- eller 13F-skjemaer til Securities Exchange Commission (SEC). Disse institusjonene eier til sammen 15,842,798 aksjer. De største aksjonærene inkluderer Security Benefit Life Insurance Co /ks/, Schechter Investment Advisors, LLC, SRS Capital Advisors, Inc., Goldman Sachs Group Inc, Kovitz Investment Group Partners, LLC, State of New Jersey Common Pension Fund D, Guardian Financial Partners, LLC, GFRAX - Goldman Sachs High Yield Floating Rate Fund Class A Shares, Gradient Investments LLC, and Black Swift Group, LLC .
Series Portfolios Trust - Eldridge BBB-B CLO ETF (ARCA:CLOZ) institusjonell eierstruktur viser nåværende posisjoner i selskapet fordelt på institusjoner og fond, samt de siste endringene i posisjonsstørrelse. De største aksjonærene kan være individuelle investorer, verdipapirfond, hedgefond eller institusjoner. Schedule 13D indikerer at investoren eier (eller har eid) mer enn 5 % av selskapet og har til hensikt (eller hadde til hensikt) å aktivt forfølge en endring i forretningsstrategien. Schedule 13G indikerer en passiv investering på over 5 %.
The share price as of September 12, 2025 is 26,84 / share. Previously, on September 13, 2024, the share price was 26,82 / share. This represents an increase of 0,07% over that period.
Fondssentiment-score
Fondssentiment Score (også kjent som akkumulering av eierskap poengsum) viser hvilke aksjer som er mest kjøpt av fond. Den er resultatet av en sofistikert, kvantitativ flerfaktormodell som identifiserer selskaper med de høyeste nivåene av institusjonell akkumulering. Beregningsmodellen for poeng bruker en kombinasjon av den totale økningen i antall offentliggjorte eiere, endringer i porteføljeallokeringen til disse eierne og andre beregninger. Tallet går fra 0 til 100, der høyere tall indikerer en høyere grad av akkumulering i forhold til sammenlignbare selskaper, der 50 er gjennomsnittet.
Oppdateringsfrekvens: Daglig
Sjekk ut Ownership Explorer, som inneholder en liste over de høyest rangerte selskapene.
Institusjonell Put/Call-forhold
I tillegg til å rapportere standard aksje- og gjeldsemisjoner må institusjoner med mer enn 100 millioner kroner i forvaltningskapital også oppgi beholdningen av put- og callopsjoner. Siden put-opsjoner generelt indikerer et negativt sentiment, og call-opsjoner indikerer et positivt sentiment, kan vi få et inntrykk av det generelle institusjonelle sentimentet ved å plotte forholdet mellom put- og call-opsjoner. Diagrammet til høyre viser det historiske forholdet mellom put- og call-opsjoner for dette instrumentet.
Ved å bruke Put/Call-forholdet som en indikator på investorsentimentet kan man overvinne en av de viktigste svakhetene ved å bruke totalt institusjonelt eierskap, nemlig at en betydelig andel av forvaltningskapitalen investeres passivt for å følge indekser. Passivt forvaltede fond kjøper vanligvis ikke opsjoner, slik at indikatoren for put/call-forhold i større grad gjenspeiler stemningen i aktivt forvaltede fond.
13F- og NPORT-arkiveringer
Detaljer om 13F-arkiveringer er gratis. Detaljer om NP-arkiveringer krever et premium-medlemskap. Grønne rader indikerer nye posisjoner. Røde rader indikerer lukkede posisjoner. Klikk på lenke ikonet for å se hele transaksjonshistorikken.
Oppgrader
for å låse opp premiedata og eksportere til Excel. ![]() .
.
| Fildato | Kilde | Investor | Type | Gjennomsnittlig pris (estimert) |
Aksjer | Δ Aksjer (%) |
Rapportert verdi ($1000) | Verdi (%) | Portallokering (%) | |
|---|---|---|---|---|---|---|---|---|---|---|
| 2025-07-25 | 13F | We Are One Seven, LLC | 37 101 | −0,24 | 992 | 0,40 | ||||
| 2025-08-19 | NP | GSHIX - Goldman Sachs High Yield Fund Institutional | 370 775 | 9 915 | ||||||
| 2025-07-23 | 13F | Vontobel Holding Ltd. | 8 000 | 0,00 | 214 | 0,47 | ||||
| 2025-08-19 | NP | GFRAX - Goldman Sachs High Yield Floating Rate Fund Class A Shares | 737 892 | 313,98 | 19 731 | 316,71 | ||||
| 2025-09-12 | 13F/A | Valeo Financial Advisors, LLC | 123 764 | 0,00 | 3 309 | 0,64 | ||||
| 2025-07-08 | 13F | Parallel Advisors, LLC | 3 600 | −10,00 | 96 | −9,43 | ||||
| 2025-08-14 | 13F | Mariner, LLC | 154 776 | −33,60 | 4 139 | −33,18 | ||||
| 2025-08-14 | 13F | Bienville Capital Management, LLC | 109 768 | 2 935 | ||||||
| 2025-08-15 | 13F | Morgan Stanley | 1 275 | −16,12 | 34 | −15,00 | ||||
| 2025-08-08 | 13F | Gts Securities Llc | 0 | −100,00 | 0 | |||||
| 2025-08-13 | 13F | Cresset Asset Management, LLC | 0 | −100,00 | 0 | |||||
| 2025-08-14 | 13F | Goldman Sachs Group Inc | 1 172 835 | 462,65 | 31 362 | 466,29 | ||||
| 2025-08-04 | 13F | Assetmark, Inc | 300 | −58,39 | 8 | −57,89 | ||||
| 2025-08-13 | 13F | Mount Yale Investment Advisors, LLC | 206 | 6 | ||||||
| 2025-07-15 | 13F | FLP Wealth Management, LLC | 0 | −100,00 | 0 | |||||
| 2025-08-19 | 13F | Newbridge Financial Services Group, Inc. | 18 246 | 127,11 | 488 | 128,64 | ||||
| 2025-08-26 | 13F | Claris Financial LLC | 34 463 | 922 | ||||||
| 2025-05-16 | 13F | Empowered Funds, LLC | 0 | −100,00 | 0 | |||||
| 2025-08-13 | 13F/A | Claudia M.p. Batlle, Crp (r) Llc | 34 882 | 11,58 | 933 | 12,29 | ||||
| 2025-07-10 | 13F | CWC Advisors, LLC. | 137 504 | 10,68 | 3 677 | 11,39 | ||||
| 2025-08-08 | 13F | Cedar Wealth Management, LLC | 94 596 | 6,46 | 2 529 | 7,16 | ||||
| 2025-08-19 | 13F | Hohimer Wealth Management, Llc | 10 000 | 0,00 | 267 | 0,75 | ||||
| 2025-08-28 | NP | FLOAX - Power Floating Rate Index Fund Class A | 0 | −100,00 | 0 | −100,00 | ||||
| 2025-08-12 | 13F | SRS Capital Advisors, Inc. | 1 423 147 | 38 055 | ||||||
| 2025-08-15 | 13F | Kestra Advisory Services, LLC | 66 335 | 1 774 | ||||||
| 2025-07-21 | 13F | Triad Wealth Partners, LLC | 7 584 | −5,87 | 203 | −5,61 | ||||
| 2025-08-04 | 13F | Bay Colony Advisory Group, Inc d/b/a Bay Colony Advisors | 0 | −100,00 | 0 | −100,00 | ||||
| 2025-08-13 | 13F | Natixis Advisors, L.p. | 150 380 | 16,84 | 4 | 33,33 | ||||
| 2025-07-16 | 13F | Perigon Wealth Management, LLC | 0 | −100,00 | 0 | |||||
| 2025-08-13 | 13F | Renaissance Technologies Llc | 103 527 | 2 768 | ||||||
| 2025-08-15 | 13F | Tower Research Capital LLC (TRC) | 143 824 | 29 251,84 | 3 846 | 29 476,92 | ||||
| 2025-07-24 | 13F | WMG Financial Advisors, LLC | 64 650 | 55,22 | 1 729 | 56,24 | ||||
| 2025-08-01 | 13F | Envestnet Asset Management Inc | 139 740 | −50,29 | 3 737 | −49,98 | ||||
| 2025-08-12 | 13F | Proequities, Inc. | 0 | 0 | ||||||
| 2025-08-14 | 13F/A | Barclays Plc | 318 582 | 448,80 | 9 | 700,00 | ||||
| 2025-08-14 | 13F | Old Mission Capital Llc | 119 928 | 171,38 | 3 207 | 173,08 | ||||
| 2025-07-24 | 13F | Baldwin Brothers Inc/ma | 28 812 | −6,85 | 770 | −6,21 | ||||
| 2025-08-14 | 13F | Mml Investors Services, Llc | 0 | −100,00 | 0 | |||||
| 2025-07-15 | 13F | Elevated Capital Advisors, LLC | 19 865 | 0,00 | 528 | 0,00 | ||||
| 2025-07-17 | 13F | Sound Income Strategies, LLC | 88 616 | 286,46 | 2 370 | 289,00 | ||||
| 2025-07-14 | 13F | Sowell Financial Services LLC | 149 931 | −49,16 | 4 009 | −48,84 | ||||
| 2025-07-25 | 13F | Almanack Investment Partners, LLC. | 96 888 | 278,53 | 2 591 | 280,88 | ||||
| 2025-08-28 | NP | SIRAX - Sierra Tactical All Asset Fund Class A | 174 600 | 4 669 | ||||||
| 2025-07-30 | 13F | Mid-American Wealth Advisory Group, Inc. | 8 | 0 | ||||||
| 2025-08-13 | 13F | Basso Capital Management, L.p. | 3 500 | 94 | ||||||
| 2025-08-13 | 13F | Flow Traders U.s. Llc | 0 | −100,00 | 0 | |||||
| 2025-08-14 | 13F | Hilltop Holdings Inc. | 29 850 | 141,02 | 798 | 142,55 | ||||
| 2025-05-01 | 13F | Schechter Investment Advisors, LLC | 1 623 358 | 20,94 | 43 133 | 19,23 | ||||
| 2025-08-11 | 13F | Nordwand Advisors, LLC | 22 600 | 0,00 | 604 | 0,67 | ||||
| 2025-08-28 | NP | Northern Lights Fund Trust - Sierra Tactical Risk Spectrum 70 Fund Investor Class | 14 900 | −31,34 | 398 | −31,85 | ||||
| 2025-08-08 | 13F | Fortis Group Advisors, LLC | 0 | −100,00 | 0 | |||||
| 2025-08-04 | 13F | Impact Partnership Wealth, LLC | 27 582 | 738 | ||||||
| 2025-07-31 | 13F | Guardian Financial Partners, LLC | 772 041 | 1,98 | 20 644 | 2,63 | ||||
| 2025-05-06 | 13F | a16z Perennial Management, L.P. | 0 | −100,00 | 0 | −100,00 | ||||
| 2025-08-14 | 13F | Napa Wealth Management | 17 686 | −5,25 | 473 | −4,65 | ||||
| 2025-08-28 | NP | Northern Lights Fund Trust - Sierra Tactical Risk Spectrum 30 Fund Instl Class | 93 900 | 2 511 | ||||||
| 2025-05-29 | NP | SSIZX - Sierra Tactical Core Income Fund Class A Shares | 0 | −100,00 | 0 | −100,00 | ||||
| 2025-08-14 | 13F | Jane Street Group, Llc | 303 824 | 254,83 | 8 124 | 257,10 | ||||
| 2025-08-14 | 13F | Royal Bank Of Canada | 5 699 | −63,46 | 152 | −63,29 | ||||
| 2025-07-31 | 13F | Cambridge Investment Research Advisors, Inc. | 11 351 | −61,21 | 0 | |||||
| 2025-08-13 | 13F | Rockport Wealth LLC | 88 686 | 11,78 | 2 371 | 12,48 | ||||
| 2025-08-18 | 13F | Tactive Advisors, LLC | 12 352 | 330 | ||||||
| 2025-07-28 | 13F | Copia Wealth Management | 29 141 | −0,57 | 779 | 0,13 | ||||
| 2025-08-11 | 13F | Knott David M Jr | 47 807 | 0,00 | 1 278 | 0,63 | ||||
| 2025-05-30 | NP | GDMA - Gadsden Dynamic Multi-Asset ETF | 0 | −100,00 | 0 | −100,00 | ||||
| 2025-08-13 | 13F | VestGen Advisors, LLC | 9 903 | −34,75 | 265 | −34,49 | ||||
| 2025-08-14 | 13F | Hrt Financial Lp | 0 | −100,00 | 0 | |||||
| 2025-08-12 | 13F | Fortis Capital Management LLC | 0 | −100,00 | 0 | −100,00 | ||||
| 2025-07-28 | 13F | Naviter Wealth, LLC | 0 | −100,00 | 0 | |||||
| 2025-05-08 | 13F | Plante Moran Financial Advisors, LLC | 0 | −100,00 | 0 | |||||
| 2025-07-09 | 13F | Reyes Financial Architecture, Inc. | 1 653 | 44 | ||||||
| 2025-07-31 | 13F | Darden Wealth Group Inc | 18 550 | 496 | ||||||
| 2025-08-14 | 13F | Kovitz Investment Group Partners, LLC | 1 164 679 | 7,88 | 31 144 | 8,58 | ||||
| 2025-04-28 | 13F | Mutual Advisors, LLC | 0 | −100,00 | 0 | −100,00 | ||||
| 2025-07-07 | 13F | Insight Wealth Strategies, LLC | 9 718 | 2,11 | 260 | 3,17 | ||||
| 2025-08-12 | 13F | Jpmorgan Chase & Co | 0 | −100,00 | 0 | |||||
| 2025-08-07 | 13F | Nwam Llc | 0 | −100,00 | 0 | |||||
| 2025-08-11 | 13F | Wealthspire Advisors, LLC | 12 922 | 346 | ||||||
| 2025-08-12 | 13F | Steward Partners Investment Advisory, Llc | 500 | 13 | ||||||
| 2025-08-14 | 13F | Stifel Financial Corp | 139 571 | 3 732 | ||||||
| 2025-08-05 | 13F | Verity Asset Management, Inc. | 44 424 | −34,65 | 1 188 | −34,27 | ||||
| 2025-07-30 | NP | Northern Lights Fund Trust IV - Brookstone Yield ETF | 278 951 | 2,89 | 7 507 | 2,23 | ||||
| 2025-08-06 | 13F | Spurstone Advisory Services, LLC | 14 | 0,00 | 0 | |||||
| 2025-07-08 | 13F | Gradient Investments LLC | 494 630 | 1,51 | 13 226 | 2,15 | ||||
| 2025-07-14 | 13F | Chris Bulman Inc | 0 | −100,00 | 0 | |||||
| 2025-05-01 | 13F | Kerntke Otto McGlone Wealth Management Group | 0 | −100,00 | 0 | |||||
| 2025-08-14 | 13F | Bank Of America Corp /de/ | 9 | 0 | ||||||
| 2025-04-24 | 13F | Wright Fund Managment, LLC | 0 | −100,00 | 0 | |||||
| 2025-08-06 | 13F | AE Wealth Management LLC | 43 796 | −24,85 | 1 171 | −24,35 | ||||
| 2025-08-14 | 13F | UBS Group AG | 11 063 | −92,78 | 296 | −92,75 | ||||
| 2025-07-25 | 13F | Cwm, Llc | 197 | 0 | ||||||
| 2025-07-29 | 13F | Koshinski Asset Management, Inc. | 12 802 | 342 | ||||||
| 2025-08-06 | 13F | Commonwealth Equity Services, Llc | 10 825 | −67,01 | 0 | |||||
| 2025-08-14 | 13F | BI Asset Management Fondsmaeglerselskab A/S | 47 999 | 0,00 | 1 | 0,00 | ||||
| 2025-07-25 | 13F | Griffin Asset Management, Inc. | 20 996 | 561 | ||||||
| 2025-08-06 | 13F | New Millennium Group LLC | 35 | 0,00 | 1 | |||||
| 2025-04-22 | 13F | Castleview Partners, Llc | 0 | −100,00 | 0 | |||||
| 2025-05-19 | 13F/A | Advisory Alpha, LLC | 0 | −100,00 | 0 | −100,00 | ||||
| 2025-07-29 | 13F | Primoris Wealth Advisors, Llc | 23 500 | 128,16 | 628 | 130,04 | ||||
| 2025-08-11 | 13F | Principal Securities, Inc. | 737 | 20 | ||||||
| 2025-05-15 | 13F | Warren Averett Asset Management, LLC | 0 | −100,00 | 0 | −100,00 | ||||
| 2025-07-25 | 13F | Sequoia Financial Advisors, LLC | 11 964 | 2,10 | 320 | 2,57 | ||||
| 2025-04-15 | 13F | Transform Wealth, LLC | 138 314 | −18,76 | 3 675 | −20,40 | ||||
| 2025-08-11 | 13F | Pineridge Advisors LLC | 300 | 0,67 | 8 | 14,29 | ||||
| 2025-09-04 | 13F/A | Advisor Group Holdings, Inc. | 22 471 | −50,94 | 601 | −50,62 | ||||
| 2025-08-06 | 13F | Ethos Financial Group, LLC | 28 653 | 78,31 | 766 | 75,69 | ||||
| 2025-08-11 | 13F | HighTower Advisors, LLC | 118 769 | 289,67 | 3 176 | 292,46 | ||||
| 2025-08-07 | 13F | Security Benefit Life Insurance Co /ks/ | 1 625 576 | 0,00 | 43 468 | 0,64 | ||||
| 2025-08-12 | 13F | Gladstone Institutional Advisory LLC | 45 850 | −5,53 | 1 226 | −4,89 | ||||
| 2025-05-20 | 13F | Belpointe Asset Management LLC | 0 | −100,00 | 0 | −100,00 | ||||
| 2025-08-05 | 13F | Bank Of Montreal /can/ | 0 | −100,00 | 0 | |||||
| 2025-05-12 | 13F | Founders Financial Securities Llc | 0 | −100,00 | 0 | |||||
| 2025-08-11 | 13F | Inspire Advisors, LLC | 0 | −100,00 | 0 | |||||
| 2025-07-29 | 13F | Mattson Financial Services, LLC | 0 | −100,00 | 0 | |||||
| 2025-05-05 | 13F | Lindbrook Capital, Llc | 5 500 | −47,62 | 146 | −48,23 | ||||
| 2025-08-12 | 13F | Manchester Capital Management LLC | 4 000 | 0,00 | 107 | 0,00 | ||||
| 2025-07-31 | 13F | State of New Jersey Common Pension Fund D | 1 000 000 | 0,00 | 26 740 | 0,64 | ||||
| 2025-08-08 | 13F | Donoghue Forlines LLC | 0 | −100,00 | 0 | |||||
| 2025-08-28 | NP | Northern Lights Fund Trust - Sierra Tactical Risk Spectrum 50 Fund Investor Class | 119 600 | 3 198 | ||||||
| 2025-08-14 | 13F | Arete Wealth Advisors, LLC | 0 | −100,00 | 0 | |||||
| 2025-07-30 | 13F | Brookstone Capital Management | 421 192 | −0,07 | 11 263 | 0,56 | ||||
| 2025-08-14 | 13F | Susquehanna International Group, Llp | 0 | −100,00 | 0 | |||||
| 2025-08-06 | 13F | Black Swift Group, LLC | 433 340 | −14,94 | 11 588 | −14,40 | ||||
| 2025-08-12 | 13F | CIBC Private Wealth Group, LLC | 3 722 | 0,00 | 100 | 5,32 | ||||
| 2025-07-15 | 13F | Fifth Third Bancorp | 34 372 | 0,00 | 919 | 0,66 | ||||
| 2025-07-18 | 13F | Truist Financial Corp | 0 | −100,00 | 0 | |||||
| 2025-08-04 | 13F | Atria Investments Llc | 165 953 | −40,85 | 4 438 | −40,48 | ||||
| 2025-05-01 | 13F | Park Square Financial Group, LLC | 0 | −100,00 | 0 | |||||
| 2025-08-11 | 13F | Private Advisor Group, LLC | 0 | −100,00 | 0 | |||||
| 2025-08-14 | 13F | Citadel Advisors Llc | 51 614 | −33,14 | 1 380 | −32,72 | ||||
| 2025-07-28 | 13F | Harbour Investments, Inc. | 11 757 | 0,00 | 314 | 0,64 | ||||
| 2025-08-07 | 13F | Allworth Financial LP | 1 700 | 45 |