Grunnleggende statistikk
| Institusjonelle eiere | 147 total, 147 long only, 0 short only, 0 long/short - change of 8,82% MRQ |
| Gjennomsnittlig porteføljeallokering | 0.3855 % - change of 2,54% MRQ |
| Institusjonelle aksjer (Long) | 35 507 500 (ex 13D/G) - change of 7,65MM shares 27,44% MRQ |
| Institusjonell verdi (Long) | $ 840 352 USD ($1000) |
Institusjonelt eierskap og aksjonærer
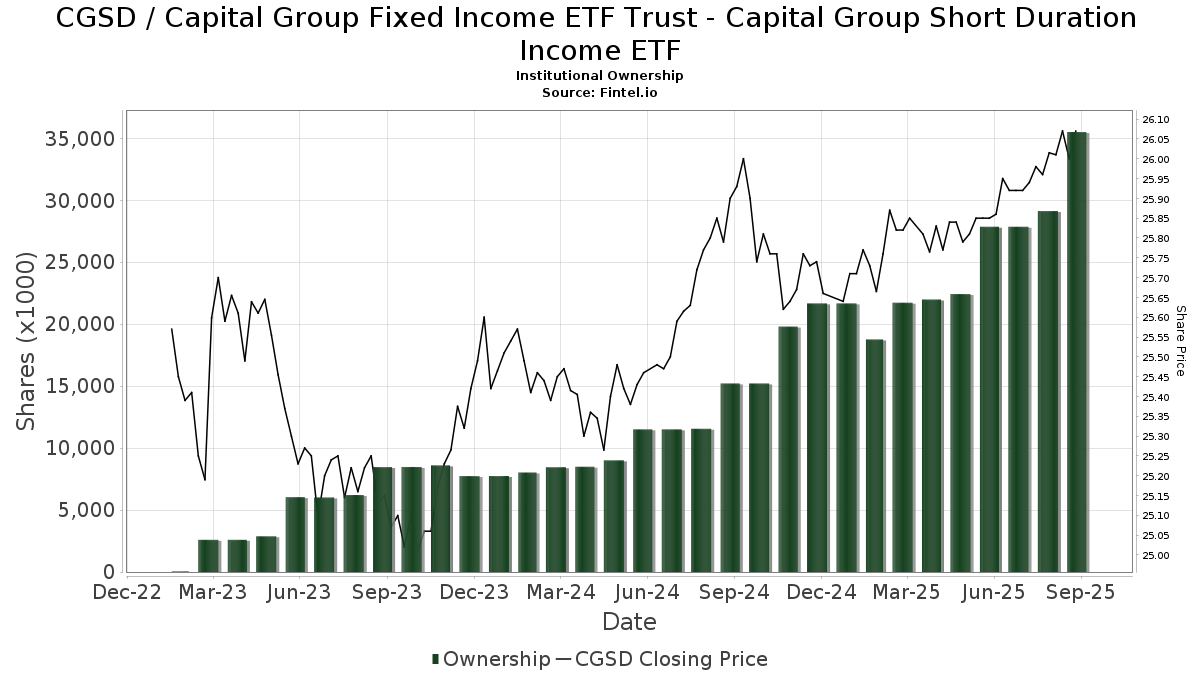
Capital Group Fixed Income ETF Trust - Capital Group Short Duration Income ETF (US:CGSD) har 147 institusjonelle eiere og aksjonærer som har sendt inn 13D/G- eller 13F-skjemaer til Securities Exchange Commission (SEC). Disse institusjonene eier til sammen 35,507,500 aksjer. De største aksjonærene inkluderer Morgan Stanley, LPL Financial LLC, Capital Group Private Client Services, Inc., Commonwealth Equity Services, Llc, Cetera Investment Advisers, McIlrath & Eck, LLC, Advisor Group Holdings, Inc., Envestnet Asset Management Inc, WNY Asset Management, LLC, and Raymond James Financial Inc .
Capital Group Fixed Income ETF Trust - Capital Group Short Duration Income ETF (ARCA:CGSD) institusjonell eierstruktur viser nåværende posisjoner i selskapet fordelt på institusjoner og fond, samt de siste endringene i posisjonsstørrelse. De største aksjonærene kan være individuelle investorer, verdipapirfond, hedgefond eller institusjoner. Schedule 13D indikerer at investoren eier (eller har eid) mer enn 5 % av selskapet og har til hensikt (eller hadde til hensikt) å aktivt forfølge en endring i forretningsstrategien. Schedule 13G indikerer en passiv investering på over 5 %.
The share price as of September 12, 2025 is 26,06 / share. Previously, on September 13, 2024, the share price was 25,93 / share. This represents an increase of 0,50% over that period.
Fondssentiment-score
Fondssentiment Score (også kjent som akkumulering av eierskap poengsum) viser hvilke aksjer som er mest kjøpt av fond. Den er resultatet av en sofistikert, kvantitativ flerfaktormodell som identifiserer selskaper med de høyeste nivåene av institusjonell akkumulering. Beregningsmodellen for poeng bruker en kombinasjon av den totale økningen i antall offentliggjorte eiere, endringer i porteføljeallokeringen til disse eierne og andre beregninger. Tallet går fra 0 til 100, der høyere tall indikerer en høyere grad av akkumulering i forhold til sammenlignbare selskaper, der 50 er gjennomsnittet.
Oppdateringsfrekvens: Daglig
Sjekk ut Ownership Explorer, som inneholder en liste over de høyest rangerte selskapene.
Institusjonell Put/Call-forhold
I tillegg til å rapportere standard aksje- og gjeldsemisjoner må institusjoner med mer enn 100 millioner kroner i forvaltningskapital også oppgi beholdningen av put- og callopsjoner. Siden put-opsjoner generelt indikerer et negativt sentiment, og call-opsjoner indikerer et positivt sentiment, kan vi få et inntrykk av det generelle institusjonelle sentimentet ved å plotte forholdet mellom put- og call-opsjoner. Diagrammet til høyre viser det historiske forholdet mellom put- og call-opsjoner for dette instrumentet.
Ved å bruke Put/Call-forholdet som en indikator på investorsentimentet kan man overvinne en av de viktigste svakhetene ved å bruke totalt institusjonelt eierskap, nemlig at en betydelig andel av forvaltningskapitalen investeres passivt for å følge indekser. Passivt forvaltede fond kjøper vanligvis ikke opsjoner, slik at indikatoren for put/call-forhold i større grad gjenspeiler stemningen i aktivt forvaltede fond.
13F- og NPORT-arkiveringer
Detaljer om 13F-arkiveringer er gratis. Detaljer om NP-arkiveringer krever et premium-medlemskap. Grønne rader indikerer nye posisjoner. Røde rader indikerer lukkede posisjoner. Klikk på lenke ikonet for å se hele transaksjonshistorikken.
Oppgrader
for å låse opp premiedata og eksportere til Excel. ![]() .
.
| Fildato | Kilde | Investor | Type | Gjennomsnittlig pris (estimert) |
Aksjer | Δ Aksjer (%) |
Rapportert verdi ($1000) | Verdi (%) | Portallokering (%) | |
|---|---|---|---|---|---|---|---|---|---|---|
| 2025-07-30 | 13F | Cullen/frost Bankers, Inc. | 4 056 | 51,34 | 105 | 52,17 | ||||
| 2025-07-23 | 13F | Tcfg Wealth Management, Llc | 36 977 | 21,85 | 959 | 22,48 | ||||
| 2025-04-10 | 13F | TrueWealth Advisors, LLC | 0 | −100,00 | 0 | |||||
| 2025-09-04 | 13F/A | Advisor Group Holdings, Inc. | 1 106 573 | 20,07 | 28 695 | 20,64 | ||||
| 2025-07-11 | 13F | Petredis Investment Advisors Llc | 118 482 | 3 073 | ||||||
| 2025-07-15 | 13F | Garrett Investment Advisors LLC | 12 985 | −3,74 | 337 | −3,45 | ||||
| 2025-08-12 | 13F | SRS Capital Advisors, Inc. | 70 | 2 | ||||||
| 2025-08-13 | 13F | RFP Financial Group LLC | 25 544 | −11,76 | 662 | −11,38 | ||||
| 2025-07-16 | 13F | Signature Resources Capital Management, LLC | 2 284 | 197,40 | 59 | 210,53 | ||||
| 2025-08-04 | 13F | Arkadios Wealth Advisors | 8 238 | 214 | ||||||
| 2025-08-11 | 13F | Private Advisor Group, LLC | 317 271 | −6,49 | 8 228 | −6,03 | ||||
| 2025-08-14 | 13F | UBS Group AG | 881 595 | −0,50 | 22 864 | −0,01 | ||||
| 2025-07-24 | 13F | Stonebridge Financial Group, LLC | 40 202 | 61,96 | 1 043 | 62,81 | ||||
| 2025-07-25 | 13F | Envestnet Portfolio Solutions, Inc. | 12 910 | 335 | ||||||
| 2025-08-15 | 13F | Kestra Advisory Services, LLC | 171 688 | 3,96 | 4 453 | 4,46 | ||||
| 2025-08-11 | 13F | Principal Securities, Inc. | 8 300 | 0,00 | 215 | 1,42 | ||||
| 2025-08-12 | 13F | Lodestone Wealth Management LLC | 168 654 | −2,55 | 4 374 | −2,06 | ||||
| 2025-08-12 | 13F | Jpmorgan Chase & Co | 0 | 0 | ||||||
| 2025-08-14 | 13F | Susquehanna International Group, Llp | 0 | −100,00 | 0 | |||||
| 2025-08-13 | 13F | Townsquare Capital Llc | 0 | −100,00 | 0 | |||||
| 2025-08-14 | 13F | Citadel Advisors Llc | 207 589 | 30,45 | 5 384 | 31,07 | ||||
| 2025-07-22 | 13F | Merit Financial Group, LLC | 20 427 | 530 | ||||||
| 2025-08-11 | 13F | Inspire Advisors, LLC | 97 244 | 0,74 | 2 522 | 1,24 | ||||
| 2025-07-10 | 13F | Financial Management Network Inc | 147 558 | 10,21 | 3 817 | 10,51 | ||||
| 2025-07-28 | 13F | Sagespring Wealth Partners, Llc | 8 051 | 209 | ||||||
| 2025-04-11 | 13F | Fjell Capital, LLC | 0 | −100,00 | 0 | |||||
| 2025-04-30 | 13F | J Hagan Capital, Inc. | 176 837 | 4 534 | ||||||
| 2025-08-11 | 13F | Perennial Investment Advisors, LLC | 28 570 | 12,97 | 741 | 13,50 | ||||
| 2025-07-11 | 13F | LongView Wealth Management | 26 157 | −52,56 | 678 | −52,35 | ||||
| 2025-07-29 | 13F | International Assets Investment Management, Llc | 126 072 | −0,27 | 3 270 | 0,21 | ||||
| 2025-08-14 | 13F | GWM Advisors LLC | 263 378 | 52,81 | 6 831 | 53,55 | ||||
| 2025-07-16 | 13F | ORG Partners LLC | 581 | 15 | ||||||
| 2025-07-17 | 13F | Johnson Bixby & Associates, LLC | 7 779 | 0,00 | 202 | 0,50 | ||||
| 2025-07-29 | 13F | Burford Brothers, Inc. | 27 731 | −6,02 | 719 | −5,52 | ||||
| 2025-07-22 | 13F | DAVENPORT & Co LLC | 24 066 | 1,35 | 624 | 1,96 | ||||
| 2025-04-21 | 13F | Beacon Capital Management, LLC | 0 | −100,00 | 0 | |||||
| 2025-07-15 | 13F | Hartmann Taylor Wealth Management, LLC | 11 125 | 11,25 | 289 | 11,63 | ||||
| 2025-08-06 | 13F | Cannon Financial Strategists, Inc. | 28 998 | 752 | ||||||
| 2025-08-14 | 13F | Clg Llc | 65 908 | 3,69 | 1 709 | 4,21 | ||||
| 2025-07-25 | 13F | We Are One Seven, LLC | 13 950 | −4,12 | 362 | −3,73 | ||||
| 2025-08-14 | 13F | Royal Bank Of Canada | 798 718 | 68,64 | 20 715 | 69,46 | ||||
| 2025-07-25 | 13F | Atria Wealth Solutions, Inc. | 123 450 | −3,59 | 3 194 | −3,36 | ||||
| 2025-07-09 | 13F | Dynamic Advisor Solutions LLC | 56 324 | 38,90 | 1 461 | 39,58 | ||||
| 2025-08-14 | 13F | Wiley Bros.-aintree Capital, Llc | 76 778 | 2 007 | ||||||
| 2025-08-04 | 13F | Bay Colony Advisory Group, Inc d/b/a Bay Colony Advisors | 25 153 | −23,83 | 652 | −23,47 | ||||
| 2025-08-15 | 13F | Captrust Financial Advisors | 877 337 | 18,77 | 22 754 | 19,34 | ||||
| 2025-07-24 | 13F | Cyndeo Wealth Partners, LLC | 33 023 | 2,10 | 856 | 2,64 | ||||
| 2025-05-14 | 13F | Flow Traders U.s. Llc | 0 | −100,00 | 0 | |||||
| 2025-08-07 | 13F | Kestra Private Wealth Services, Llc | 344 503 | 12,99 | 8 935 | 13,53 | ||||
| 2025-07-31 | 13F | Moloney Securities Asset Management, LLC | 0 | −100,00 | 0 | |||||
| 2025-08-04 | 13F | WNY Asset Management, LLC | 960 267 | 6,47 | 24 905 | 6,99 | ||||
| 2025-08-11 | 13F | Aptus Capital Advisors, LLC | 28 650 | 0,00 | 743 | 0,54 | ||||
| 2025-08-14 | 13F | Great Valley Advisor Group, Inc. | 328 320 | 11,42 | 8 515 | 11,97 | ||||
| 2025-08-27 | 13F/A | Brinker Capital Investments, LLC | 16 010 | 415 | ||||||
| 2025-08-13 | 13F | Gateway Wealth Partners, LLC | 0 | −100,00 | 0 | |||||
| 2025-08-18 | 13F/A | Kestra Investment Management, LLC | 202 348 | 1 313,64 | 5 248 | 1 321,95 | ||||
| 2025-07-22 | 13F | Beacon Financial Advisory LLC | 10 526 | 273 | ||||||
| 2025-08-14 | 13F | Guardian Wealth Advisors, Llc / Nc | 28 650 | 0,00 | 743 | 0,54 | ||||
| 2025-08-11 | 13F | Beta Wealth Group, Inc. | 493 239 | −1,07 | 12 792 | −0,58 | ||||
| 2025-07-30 | 13F | Bleakley Financial Group, LLC | 38 232 | −15,70 | 992 | −15,30 | ||||
| 2025-08-12 | 13F | Deutsche Bank Ag\ | 956 | 25 | ||||||
| 2025-08-14 | 13F | Mpwm Advisory Solutions, Llc | 6 642 | −47,47 | 172 | −47,24 | ||||
| 2025-08-04 | 13F | Bridgewealth Advisory Group, LLC | 787 980 | 745,30 | 20 436 | 749,73 | ||||
| 2025-08-06 | 13F | Souders Financial Advisors | 398 518 | 9,15 | 10 336 | 9,68 | ||||
| 2025-08-11 | 13F | Western Wealth Management, LLC | 44 348 | 1,66 | 1 150 | 2,22 | ||||
| 2025-08-13 | 13F | Baird Financial Group, Inc. | 37 110 | 0,00 | 962 | 0,52 | ||||
| 2025-07-28 | 13F | RFG Advisory, LLC | 26 973 | 6,57 | 700 | 7,04 | ||||
| 2025-05-09 | 13F | Delta Financial Group, Inc. | 11 671 | 4,72 | 0 | |||||
| 2025-07-08 | 13F | IAM Advisory, LLC | 523 928 | 13 588 | ||||||
| 2025-08-13 | 13F | Strategic Family Wealth Counselors, L.L.C. | 17 623 | 0,00 | 457 | 0,66 | ||||
| 2025-08-12 | 13F | Titleist Asset Management, Llc | 10 449 | 3,51 | 271 | 4,23 | ||||
| 2025-08-12 | 13F | Steward Partners Investment Advisory, Llc | 6 345 | −15,54 | 165 | −15,03 | ||||
| 2025-08-04 | 13F | Saxony Capital Management, LLC | 93 898 | 1,75 | 2 435 | 2,27 | ||||
| 2025-08-14 | 13F | Benjamin Edwards Inc | 145 255 | −7,51 | 3 767 | −7,06 | ||||
| 2025-07-28 | 13F | Harbour Investments, Inc. | 43 913 | 22,12 | 1 139 | 22,63 | ||||
| 2025-08-12 | 13F | Rather & Kittrell, Inc. | 7 781 | 0,00 | 202 | 0,50 | ||||
| 2025-08-12 | 13F | Global Retirement Partners, LLC | 29 810 | 6 675,00 | 773 | 6 927,27 | ||||
| 2025-07-24 | 13F | IFP Advisors, Inc | 879 | 1,15 | 23 | 0,00 | ||||
| 2025-07-29 | 13F | DeDora Capital, Inc. | 78 163 | 16,29 | 2 027 | 16,90 | ||||
| 2025-08-13 | 13F | StoneX Group Inc. | 143 466 | 0,86 | 3 721 | 1,33 | ||||
| 2025-08-14 | 13F | Raymond James Financial Inc | 939 933 | 44,98 | 24 377 | 45,68 | ||||
| 2025-08-11 | 13F | Nations Financial Group Inc, /ia/ /adv | 13 194 | 26,37 | 342 | 27,14 | ||||
| 2025-08-04 | 13F | Pensionmark Financial Group, Llc | 21 191 | 166,08 | 550 | 167,80 | ||||
| 2025-08-12 | 13F | Founders Financial Alliance, LLC | 44 934 | 115,00 | 1 165 | 116,14 | ||||
| 2025-07-14 | 13F | AdvisorNet Financial, Inc | 780 | 0,00 | 20 | 0,00 | ||||
| 2025-07-15 | 13F | Norden Group Llc | 558 923 | −5,45 | 14 496 | −4,99 | ||||
| 2025-08-13 | 13F | Capital International Investors | 91 002 | −1,08 | 2 360 | −0,59 | ||||
| 2025-08-14 | 13F | Jane Street Group, Llc | 41 133 | −68,07 | 1 067 | −67,93 | ||||
| 2025-07-24 | 13F | MSH Capital Advisors LLC | 19 134 | 144,15 | 496 | 145,54 | ||||
| 2025-07-10 | 13F | Exchange Traded Concepts, Llc | 1 905 | 49 | ||||||
| 2025-09-09 | 13F | NWF Advisory Services Inc. | 181 076 | −0,71 | 4 696 | −0,21 | ||||
| 2025-08-13 | 13F | Congress Wealth Management LLC / DE / | 25 376 | 8,71 | 658 | 9,30 | ||||
| 2025-08-14 | 13F | Bank Of America Corp /de/ | 1 905 | 49 | ||||||
| 2025-08-07 | 13F | Allworth Financial LP | 9 736 | −1,88 | 253 | −1,56 | ||||
| 2025-08-14 | 13F | Comerica Bank | 7 663 | 15,01 | 199 | 15,79 | ||||
| 2025-07-10 | 13F | Wealth Enhancement Advisory Services, Llc | 640 707 | 37,23 | 16 575 | 37,55 | ||||
| 2025-08-01 | 13F | Ashton Thomas Private Wealth, LLC | 9 752 | 0,00 | 253 | 0,40 | ||||
| 2025-08-12 | 13F | Wood Tarver Financial Group, LLC | 170 110 | 58,80 | 4 | −99,86 | ||||
| 2025-08-18 | 13F | Geneos Wealth Management Inc. | 106 406 | −2,33 | 2 760 | −1,81 | ||||
| 2025-07-31 | 13F | Oppenheimer & Co Inc | 8 821 | −0,05 | 229 | 0,44 | ||||
| 2025-07-24 | 13F | Us Bancorp \de\ | 0 | −100,00 | 0 | |||||
| 2025-08-13 | 13F | EverSource Wealth Advisors, LLC | 117 | 20,62 | 3 | 50,00 | ||||
| 2025-07-23 | 13F | Valmark Advisers, Inc. | 66 413 | 14,98 | 1 722 | 15,57 | ||||
| 2025-08-14 | 13F | Smartleaf Asset Management LLC | 5 023 | −2,16 | 130 | −1,52 | ||||
| 2025-05-07 | 13F | Trilogy Capital Inc. | 0 | −100,00 | 0 | |||||
| 2025-08-13 | 13F | Continuum Advisory, LLC | 21 181 | −5,53 | 549 | −5,02 | ||||
| 2025-07-16 | 13F | Freestate Advisors LLC | 28 854 | 197,74 | 748 | 199,20 | ||||
| 2025-08-08 | 13F | Cetera Investment Advisers | 1 839 269 | 21,20 | 47 701 | 21,78 | ||||
| 2025-08-04 | 13F | Assetmark, Inc | 514 | 13 | ||||||
| 2025-07-08 | 13F | Nbc Securities, Inc. | 1 574 | 0,00 | 0 | |||||
| 2025-08-06 | 13F | Prospera Financial Services Inc | 16 141 | −1,93 | 419 | −1,42 | ||||
| 2025-08-05 | 13F | Bank of New York Mellon Corp | 8 243 | 214 | ||||||
| 2025-08-15 | 13F | Morgan Stanley | 4 345 569 | 72,41 | 112 702 | 73,24 | ||||
| 2025-08-14 | 13F | Mml Investors Services, Llc | 408 059 | 3,86 | 11 | 0,00 | ||||
| 2025-07-17 | 13F | Janney Montgomery Scott LLC | 22 826 | 14,45 | 1 | |||||
| 2025-08-06 | 13F | Commonwealth Equity Services, Llc | 2 099 696 | 15,11 | 54 | 14,89 | ||||
| 2025-08-14 | 13F | Sei Investments Co | 40 945 | 1 062 | ||||||
| 2025-07-10 | 13F | Sovran Advisors, LLC | 117 239 | 122,87 | 3 034 | 123,42 | ||||
| 2025-07-30 | 13F | Smith Thornton Advisors LLC | 51 540 | 0,00 | 1 337 | 0,45 | ||||
| 2025-07-31 | 13F | Richards, Merrill & Peterson, Inc. | 84 763 | 12,59 | 2 198 | 13,12 | ||||
| 2025-07-21 | 13F | Ameritas Advisory Services, LLC | 14 253 | −32,22 | 370 | −31,92 | ||||
| 2025-08-05 | 13F | Aurdan Capital Management, LLC | 18 370 | 2,35 | 476 | 2,81 | ||||
| 2025-07-14 | 13F | Sowell Financial Services LLC | 33 217 | 112,44 | 861 | 113,65 | ||||
| 2025-08-13 | 13F | BlackDiamond Wealth Management Inc. | 114 890 | −1,38 | 2 977 | −0,97 | ||||
| 2025-07-18 | 13F | Truist Financial Corp | 35 558 | −6,50 | 922 | −6,01 | ||||
| 2025-07-31 | 13F | Cambridge Investment Research Advisors, Inc. | 241 240 | 21,20 | 6 | 20,00 | ||||
| 2025-05-14 | 13F | Oarsman Capital, Inc. | 0 | −100,00 | 0 | −100,00 | ||||
| 2025-08-13 | 13F | Capital Group Private Client Services, Inc. | 2 244 927 | 3,38 | 58 222 | 3,88 | ||||
| 2025-08-14 | 13F | Ausdal Financial Partners, Inc. | 16 719 | 8,37 | 434 | 8,79 | ||||
| 2025-07-22 | 13F | Confluence Wealth Services, Inc. | 38 086 | 0,62 | 988 | 1,23 | ||||
| 2025-08-13 | 13F | Capital Analysts, Inc. | 8 256 | 7,58 | 0 | |||||
| 2025-08-13 | 13F | Jones Financial Companies Lllp | 738 301 | 76,98 | 19 129 | 77,60 | ||||
| 2025-08-14 | 13F | Wells Fargo & Company/mn | 800 831 | 62,85 | 20 770 | 63,64 | ||||
| 2025-08-12 | 13F | Entruity Wealth, LLC | 228 480 | 0,13 | 5 926 | 0,61 | ||||
| 2025-07-16 | 13F | St Germain D J Co Inc | 2 900 | 0,00 | 75 | 1,35 | ||||
| 2025-08-14 | 13F | Stifel Financial Corp | 230 493 | 14,07 | 5 978 | 14,61 | ||||
| 2025-08-04 | 13F | Creekmur Asset Management LLC | 209 717 | 5 439 | ||||||
| 2025-07-29 | 13F | Stratos Wealth Partners, LTD. | 23 223 | 602 | ||||||
| 2025-07-09 | 13F | Pines Wealth Management, LLC | 29 761 | 15,87 | 770 | 16,34 | ||||
| 2025-07-28 | 13F | Mutual Advisors, LLC | 30 733 | −4,61 | 798 | −4,32 | ||||
| 2025-07-29 | 13F | Private Trust Co Na | 2 738 | 173,80 | 71 | 184,00 | ||||
| 2025-07-21 | 13F | Ameriflex Group, Inc. | 0 | −100,00 | 0 | |||||
| 2025-08-12 | 13F | LPL Financial LLC | 3 955 676 | 40,10 | 102 590 | 40,78 | ||||
| 2025-08-08 | 13F | New England Capital Financial Advisors LLC | 259 718 | 6,89 | 6 736 | 7,40 | ||||
| 2025-05-12 | 13F | Independent Advisor Alliance | 0 | −100,00 | 0 | |||||
| 2025-08-11 | 13F | Synergy Investment Management, LLC | 0 | −100,00 | 0 | |||||
| 2025-08-08 | 13F | Avantax Advisory Services, Inc. | 48 050 | 7,56 | 1 246 | 8,16 | ||||
| 2025-08-14 | 13F | Integrated Wealth Concepts LLC | 8 310 | 3,51 | 216 | 3,86 | ||||
| 2025-07-30 | 13F | Brookstone Capital Management | 25 366 | 36,03 | 658 | 36,59 | ||||
| 2025-07-28 | 13F | Eq Wealth Advisors, Llc | 159 264 | 24,85 | 4 131 | 25,46 | ||||
| 2025-07-14 | 13F | U.S. Capital Wealth Advisors, LLC | 10 970 | 0,00 | 285 | 0,35 | ||||
| 2025-08-11 | 13F | Rothschild Investment Llc | 162 502 | 1,62 | 4 214 | 2,11 | ||||
| 2025-08-15 | 13F | Equitable Holdings, Inc. | 14 539 | 21,27 | 377 | 22,01 | ||||
| 2025-08-14 | 13F | Mariner, LLC | 87 476 | 55,67 | 2 269 | 56,41 | ||||
| 2025-07-22 | 13F | SOL Capital Management CO | 137 435 | −4,46 | 4 | 0,00 | ||||
| 2025-08-04 | 13F | Spire Wealth Management | 4 958 | 1,12 | 129 | 1,59 | ||||
| 2025-07-10 | 13F | Global Financial Private Client, LLC | 8 215 | 0,00 | 213 | 0,47 | ||||
| 2025-08-14 | 13F | CoreCap Advisors, LLC | 193 | 0,00 | 5 | 25,00 | ||||
| 2025-08-12 | 13F | Proequities, Inc. | 0 | 0 | ||||||
| 2025-08-14 | 13F | McIlrath & Eck, LLC | 1 168 716 | −2,97 | 30 311 | −2,50 | ||||
| 2025-08-13 | 13F | Northwestern Mutual Wealth Management Co | 251 030 | 4,15 | 6 510 | 4,65 | ||||
| 2025-08-08 | 13F | Capital Investment Advisory Services, LLC | 190 | 0,00 | 5 | 0,00 | ||||
| 2025-08-01 | 13F | Envestnet Asset Management Inc | 1 035 466 | 21,35 | 26 855 | 21,94 |