Grunnleggende statistikk
| Institusjonelle eiere | 100 total, 100 long only, 0 short only, 0 long/short - change of −5,61% MRQ |
| Gjennomsnittlig porteføljeallokering | 0.2928 % - change of −8,85% MRQ |
| Institusjonelle aksjer (Long) | 7 692 445 (ex 13D/G) - change of −0,23MM shares −2,86% MRQ |
| Institusjonell verdi (Long) | $ 447 112 USD ($1000) |
Institusjonelt eierskap og aksjonærer
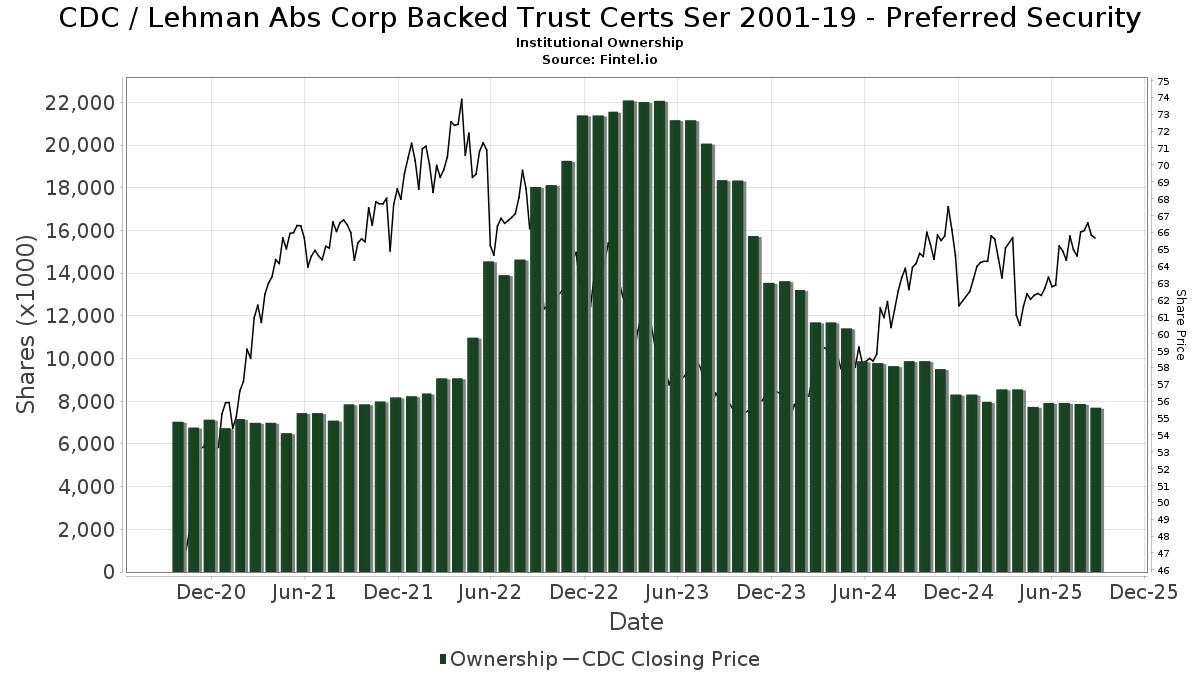
Lehman Abs Corp Backed Trust Certs Ser 2001-19 - Preferred Security (US:CDC) har 100 institusjonelle eiere og aksjonærer som har sendt inn 13D/G- eller 13F-skjemaer til Securities Exchange Commission (SEC). Disse institusjonene eier til sammen 7,692,445 aksjer. De største aksjonærene inkluderer Morgan Stanley, Raymond James Financial Inc, LPL Financial LLC, Bank Of America Corp /de/, Northwestern Mutual Wealth Management Co, SILVER OAK SECURITIES, Inc, Atlantic Family Wealth, Llc, Cwm, Llc, Royal Bank Of Canada, and Wells Fargo & Company/mn .
Lehman Abs Corp Backed Trust Certs Ser 2001-19 - Preferred Security (OTCPK:CDC) institusjonell eierstruktur viser nåværende posisjoner i selskapet fordelt på institusjoner og fond, samt de siste endringene i posisjonsstørrelse. De største aksjonærene kan være individuelle investorer, verdipapirfond, hedgefond eller institusjoner. Schedule 13D indikerer at investoren eier (eller har eid) mer enn 5 % av selskapet og har til hensikt (eller hadde til hensikt) å aktivt forfølge en endring i forretningsstrategien. Schedule 13G indikerer en passiv investering på over 5 %.
The share price as of September 10, 2025 is 65,63 / share. Previously, on September 10, 2024, the share price was 63,22 / share. This represents an increase of 3,81% over that period.
Fondssentiment-score
Fondssentiment Score (også kjent som akkumulering av eierskap poengsum) viser hvilke aksjer som er mest kjøpt av fond. Den er resultatet av en sofistikert, kvantitativ flerfaktormodell som identifiserer selskaper med de høyeste nivåene av institusjonell akkumulering. Beregningsmodellen for poeng bruker en kombinasjon av den totale økningen i antall offentliggjorte eiere, endringer i porteføljeallokeringen til disse eierne og andre beregninger. Tallet går fra 0 til 100, der høyere tall indikerer en høyere grad av akkumulering i forhold til sammenlignbare selskaper, der 50 er gjennomsnittet.
Oppdateringsfrekvens: Daglig
Sjekk ut Ownership Explorer, som inneholder en liste over de høyest rangerte selskapene.
Institusjonell Put/Call-forhold
I tillegg til å rapportere standard aksje- og gjeldsemisjoner må institusjoner med mer enn 100 millioner kroner i forvaltningskapital også oppgi beholdningen av put- og callopsjoner. Siden put-opsjoner generelt indikerer et negativt sentiment, og call-opsjoner indikerer et positivt sentiment, kan vi få et inntrykk av det generelle institusjonelle sentimentet ved å plotte forholdet mellom put- og call-opsjoner. Diagrammet til høyre viser det historiske forholdet mellom put- og call-opsjoner for dette instrumentet.
Ved å bruke Put/Call-forholdet som en indikator på investorsentimentet kan man overvinne en av de viktigste svakhetene ved å bruke totalt institusjonelt eierskap, nemlig at en betydelig andel av forvaltningskapitalen investeres passivt for å følge indekser. Passivt forvaltede fond kjøper vanligvis ikke opsjoner, slik at indikatoren for put/call-forhold i større grad gjenspeiler stemningen i aktivt forvaltede fond.
13F- og NPORT-arkiveringer
Detaljer om 13F-arkiveringer er gratis. Detaljer om NP-arkiveringer krever et premium-medlemskap. Grønne rader indikerer nye posisjoner. Røde rader indikerer lukkede posisjoner. Klikk på lenke ikonet for å se hele transaksjonshistorikken.
Oppgrader
for å låse opp premiedata og eksportere til Excel. ![]() .
.
| Fildato | Kilde | Investor | Type | Gjennomsnittlig pris (estimert) |
Aksjer | Δ Aksjer (%) |
Rapportert verdi ($1000) | Verdi (%) | Portallokering (%) | |
|---|---|---|---|---|---|---|---|---|---|---|
| 2025-08-05 | 13F | Tiaa Trust, National Association | 3 556 | 227 | ||||||
| 2025-08-11 | 13F | HighTower Advisors, LLC | 32 324 | 3,81 | 2 059 | 0,64 | ||||
| 2025-07-22 | 13F | Unique Wealth, Llc | 7 573 | −33,03 | 482 | −35,13 | ||||
| 2025-08-12 | 13F | Proequities, Inc. | 0 | 0 | ||||||
| 2025-08-18 | 13F | Pacific Center for Financial Services | 227 | 0,00 | 14 | 0,00 | ||||
| 2025-07-31 | 13F | Brinker Capital Investments, LLC | 0 | −100,00 | 0 | −100,00 | ||||
| 2025-09-04 | 13F/A | Advisor Group Holdings, Inc. | 75 773 | 19,99 | 4 829 | 16,31 | ||||
| 2025-08-05 | 13F | Integrity Financial Corp /WA | 3 556 | 0,03 | 227 | −3,00 | ||||
| 2025-07-25 | 13F | Atria Wealth Solutions, Inc. | 7 442 | 474 | ||||||
| 2025-08-01 | 13F | Envestnet Asset Management Inc | 167 067 | −3,36 | 10 644 | −6,31 | ||||
| 2025-08-14 | 13F | Wiley Bros.-aintree Capital, Llc | 47 032 | −0,14 | 3 018 | −1,31 | ||||
| 2025-08-15 | 13F | Equitable Holdings, Inc. | 8 364 | −0,05 | 533 | −3,10 | ||||
| 2025-08-07 | 13F | PFG Advisors | 27 684 | 7,47 | 1 764 | 4,20 | ||||
| 2025-08-14 | 13F | Ameriprise Financial Inc | 143 382 | −12,49 | 9 139 | −15,15 | ||||
| 2025-07-15 | 13F | Axis Wealth Partners, LLC | 13 063 | −0,99 | 832 | −4,04 | ||||
| 2025-08-13 | 13F | EverSource Wealth Advisors, LLC | 384 | −83,28 | 24 | −84,00 | ||||
| 2025-07-09 | 13F | Dynamic Advisor Solutions LLC | 4 211 | 4,39 | 268 | 1,13 | ||||
| 2025-07-24 | 13F | IFP Advisors, Inc | 3 647 | −4,25 | 232 | −7,20 | ||||
| 2025-04-21 | 13F | Nelson, Van Denburg & Campbell Wealth Management Group, LLC | 0 | −100,00 | 0 | |||||
| 2025-08-08 | 13F | Gts Securities Llc | 7 771 | 495 | ||||||
| 2025-07-30 | 13F | Smith Thornton Advisors LLC | 8 480 | −1,17 | 540 | −4,09 | ||||
| 2025-08-08 | 13F | Larson Financial Group LLC | 69 | 0,00 | 4 | 0,00 | ||||
| 2025-08-14 | 13F | Royal Bank Of Canada | 310 273 | 2,05 | 19 768 | −1,07 | ||||
| 2025-08-06 | 13F | Commonwealth Equity Services, Llc | 181 300 | −0,45 | 12 | 0,00 | ||||
| 2025-08-12 | 13F | Garrett Wealth Advisory Group, LLC | 121 243 | −0,58 | 7 724 | −3,62 | ||||
| 2025-04-30 | 13F | Alpha Cubed Investments, LLC | 0 | −100,00 | 0 | −100,00 | ||||
| 2025-08-12 | 13F | one8zero8, LLC | 3 300 | −35,42 | 210 | −37,31 | ||||
| 2025-07-21 | 13F | Patriot Financial Group Insurance Agency, LLC | 7 901 | 0,43 | 503 | −2,71 | ||||
| 2025-07-31 | 13F | Cambridge Investment Research Advisors, Inc. | 170 500 | −19,20 | 11 | −23,08 | ||||
| 2025-08-11 | 13F | Private Advisor Group, LLC | 93 487 | −1,72 | 5 956 | −4,72 | ||||
| 2025-08-01 | 13F | Advisory Alpha, LLC | 4 598 | −0,07 | 293 | −3,31 | ||||
| 2025-08-08 | 13F | Comprehensive Financial Planning, Inc./PA | 7 304 | 0,93 | 465 | −2,11 | ||||
| 2025-04-15 | 13F | Noble Wealth Management PBC | 980 | −3,64 | 64 | 1,59 | ||||
| 2025-07-25 | 13F | Cwm, Llc | 318 509 | 6,73 | 20 | 5,26 | ||||
| 2025-08-14 | 13F | Citadel Advisors Llc | 41 620 | 1 062,25 | 2 652 | 1 028,09 | ||||
| 2025-08-08 | 13F | Avantax Advisory Services, Inc. | 24 647 | −19,33 | 1 570 | −21,77 | ||||
| 2025-08-14 | 13F | Goldman Sachs Group Inc | 60 972 | 16,84 | 3 885 | 13,27 | ||||
| 2025-04-23 | 13F | Crewe Advisors LLC | 0 | −100,00 | 0 | |||||
| 2025-08-12 | 13F | J.w. Cole Advisors, Inc. | 20 698 | −22,30 | 1 319 | −24,69 | ||||
| 2025-08-06 | 13F | Rps Advisory Solutions Llc | 4 373 | −17,51 | 279 | −20,11 | ||||
| 2025-07-15 | 13F | Mather Group, Llc. | 37 805 | −0,84 | 2 409 | −3,87 | ||||
| 2025-07-29 | 13F | Private Trust Co Na | 2 200 | 0,00 | 140 | −2,78 | ||||
| 2025-08-01 | 13F | Bessemer Group Inc | 0 | −100,00 | 0 | |||||
| 2025-08-13 | 13F | Russell Investments Group, Ltd. | 11 040 | 703 | ||||||
| 2025-08-11 | 13F | Beta Wealth Group, Inc. | 0 | −100,00 | 0 | |||||
| 2025-07-28 | 13F | Harbour Investments, Inc. | 158 | 0,00 | 10 | 0,00 | ||||
| 2025-08-14 | 13F | Money Concepts Capital Corp | 51 550 | −7,05 | 3 284 | −9,88 | ||||
| 2025-08-14 | 13F | Comerica Bank | 3 203 | −0,25 | 204 | −3,32 | ||||
| 2025-07-21 | 13F | DHJJ Financial Advisors, Ltd. | 901 | 0,00 | 57 | −3,39 | ||||
| 2025-08-15 | 13F | Keel Point, LLC | 0 | −100,00 | 0 | |||||
| 2025-08-14 | 13F | UBS Group AG | 106 084 | −24,40 | 6 759 | −26,71 | ||||
| 2025-08-14 | 13F | Fmr Llc | 434 | −32,50 | 28 | −35,71 | ||||
| 2025-08-05 | 13F | Huntington National Bank | 72 | −4,05 | ||||||
| 2025-08-13 | 13F | Northwestern Mutual Wealth Management Co | 507 659 | −1,88 | 32 343 | −4,88 | ||||
| 2025-05-12 | 13F | Independent Advisor Alliance | 0 | −100,00 | 0 | |||||
| 2025-08-14 | 13F | Jane Street Group, Llc | 9 456 | 132,56 | 602 | 125,47 | ||||
| 2025-07-25 | 13F | NorthRock Partners, LLC | 2 023 | 0,00 | 129 | −3,03 | ||||
| 2025-08-15 | 13F | Morgan Stanley | 1 258 993 | −2,55 | 80 211 | −5,53 | ||||
| 2025-07-16 | 13F | Signaturefd, Llc | 0 | −100,00 | 0 | |||||
| 2025-08-19 | 13F | Newbridge Financial Services Group, Inc. | 200 | 0,00 | 13 | −7,69 | ||||
| 2025-08-12 | 13F | LPL Financial LLC | 599 519 | −2,90 | 38 195 | −5,87 | ||||
| 2025-08-14 | 13F | Operose Advisors LLC | 136 | 0,00 | 9 | 0,00 | ||||
| 2025-08-15 | 13F | Koesten, Hirschmann & Crabtree, INC. | 24 | 0,00 | 2 | 0,00 | ||||
| 2025-07-29 | 13F | Salus Financial Advisors, LLC | 18 037 | −0,62 | 1 149 | −3,61 | ||||
| 2025-08-12 | 13F | CIBC Private Wealth Group, LLC | 300 | 0,00 | 19 | 11,76 | ||||
| 2025-08-14 | 13F | Susquehanna International Group, Llp | 27 693 | 90,82 | 1 764 | 85,10 | ||||
| 2025-07-29 | 13F | Stratos Wealth Partners, LTD. | 11 364 | −4,98 | 724 | −7,77 | ||||
| 2025-08-14 | 13F | Wells Fargo & Company/mn | 238 715 | −0,53 | 15 209 | −3,57 | ||||
| 2025-07-23 | 13F | Prime Capital Investment Advisors, LLC | 0 | −100,00 | 0 | |||||
| 2025-08-14 | 13F | Old Mission Capital Llc | 4 634 | 295 | ||||||
| 2025-08-07 | 13F | Allworth Financial LP | 4 303 | 0,00 | 274 | 3,01 | ||||
| 2025-08-12 | 13F | Steward Partners Investment Advisory, Llc | 5 427 | −3,67 | 346 | −6,76 | ||||
| 2025-08-14 | 13F/A | Rockefeller Capital Management L.P. | 21 978 | −6,88 | 1 400 | −9,74 | ||||
| 2025-08-15 | 13F | Tower Research Capital LLC (TRC) | 17 | −29,17 | 1 | 0,00 | ||||
| 2025-08-11 | 13F | Advisor Resource Council | 0 | −100,00 | 0 | |||||
| 2025-03-17 | 13F/A | Wealth Enhancement Advisory Services, Llc | 0 | −100,00 | 0 | |||||
| 2025-08-12 | 13F | NWF Advisory Services Inc. | 0 | −100,00 | 0 | |||||
| 2025-08-06 | 13F | Vantage Financial Partners, LLC | 6 595 | −26,86 | 420 | −29,05 | ||||
| 2025-07-14 | 13F | Strategic Planning Group, Llc | 22 367 | 9,43 | 1 425 | 6,11 | ||||
| 2025-07-21 | 13F | Ameritas Advisory Services, LLC | 637 | 41 | ||||||
| 2025-08-12 | 13F | Park Square Financial Group, LLC | 34 | 0,00 | 2 | 0,00 | ||||
| 2025-08-14 | 13F | Bank Of America Corp /de/ | 577 860 | 1,03 | 36 815 | −2,06 | ||||
| 2025-08-14 | 13F | Sunbelt Securities, Inc. | 313 | 66,49 | 20 | 58,33 | ||||
| 2025-08-08 | 13F | Cetera Investment Advisers | 50 661 | 3,59 | 3 228 | 0,40 | ||||
| 2025-08-07 | 13F | Kestra Private Wealth Services, Llc | 9 124 | 0,39 | 581 | −2,68 | ||||
| 2025-08-11 | 13F | Aptus Capital Advisors, LLC | 248 | 0,81 | 16 | −6,25 | ||||
| 2025-08-15 | 13F | First Heartland Consultants, Inc. | 5 474 | 0,00 | 349 | −3,06 | ||||
| 2025-08-13 | 13F | Rsm Us Wealth Management Llc | 5 491 | 0,00 | 350 | −3,06 | ||||
| 2025-08-14 | 13F | Two Sigma Investments, Lp | 0 | −100,00 | 0 | |||||
| 2025-07-30 | 13F | Strategic Blueprint, LLC | 54 597 | 0,98 | 3 478 | −2,11 | ||||
| 2025-08-14 | 13F | Great Valley Advisor Group, Inc. | 9 758 | −18,59 | 622 | −21,09 | ||||
| 2025-07-30 | 13F/A | KPP Advisory Services LLC | 25 207 | −1,83 | 1 606 | −4,86 | ||||
| 2025-08-14 | 13F | Integrated Wealth Concepts LLC | 113 394 | −2,69 | 7 224 | −5,67 | ||||
| 2025-07-11 | 13F | Farther Finance Advisors, LLC | 413 | 0,00 | 26 | −3,70 | ||||
| 2025-08-14 | 13F | Becker Capital Management Inc | 0 | −100,00 | 0 | |||||
| 2025-07-11 | 13F | SILVER OAK SECURITIES, Inc | 499 265 | −2,64 | 31 808 | −4,46 | ||||
| 2025-08-14 | 13F | CoreCap Advisors, LLC | 6 789 | −2,05 | 433 | −5,05 | ||||
| 2025-08-14 | 13F | Mariner, LLC | 6 108 | 0,59 | 389 | −2,51 | ||||
| 2025-08-05 | 13F | GPS Wealth Strategies Group, LLC | 11 919 | −0,96 | 759 | −3,92 | ||||
| 2025-08-12 | 13F | Jpmorgan Chase & Co | 241 | −61,38 | 15 | −63,41 | ||||
| 2025-07-21 | 13F | Ameriflex Group, Inc. | 6 096 | 0,25 | 386 | −3,26 | ||||
| 2025-08-12 | 13F | Global Retirement Partners, LLC | 5 404 | −0,07 | 344 | 1,78 | ||||
| 2025-08-12 | 13F | Atlantic Family Wealth, Llc | 374 605 | 1,09 | 23 866 | −1,85 | ||||
| 2025-08-13 | 13F | StoneX Group Inc. | 12 570 | −0,56 | 801 | −3,61 | ||||
| 2025-08-13 | 13F | Keystone Financial Group | 33 906 | −3,97 | 2 160 | −6,90 | ||||
| 2025-08-14 | 13F | Hrt Financial Lp | 5 455 | 77,11 | 0 | |||||
| 2025-08-14 | 13F | GWM Advisors LLC | 41 889 | −4,96 | 2 669 | −7,87 | ||||
| 2025-07-08 | 13F | Nbc Securities, Inc. | 400 | 0,00 | 0 | |||||
| 2025-08-12 | 13F | Calton & Associates, Inc. | 6 161 | −7,17 | 393 | −10,09 | ||||
| 2025-07-24 | 13F | Capital Advisors, Ltd. LLC | 162 | 0,00 | 0 | |||||
| 2025-08-04 | 13F | Atria Investments Llc | 0 | −100,00 | 0 | |||||
| 2025-08-04 | 13F | Flagship Harbor Advisors, Llc | 8 571 | 0,86 | 546 | −2,15 | ||||
| 2025-08-14 | 13F | Stifel Financial Corp | 72 661 | 4,39 | 4 629 | 1,20 | ||||
| 2025-08-18 | 13F | Geneos Wealth Management Inc. | 2 682 | 22,30 | 171 | 18,06 | ||||
| 2025-05-12 | 13F | Claro Advisors LLC | 0 | −100,00 | 0 | −100,00 | ||||
| 2025-08-14 | 13F | Raymond James Financial Inc | 758 693 | −9,09 | 48 336 | −11,87 | ||||
| 2025-08-15 | 13F | Kestra Advisory Services, LLC | 18 321 | 15,07 | 1 167 | 11,57 | ||||
| 2025-05-15 | 13F | CAPROCK Group, Inc. | 43 162 | 0,33 | 2 837 | 5,35 | ||||
| 2025-07-18 | 13F | Truist Financial Corp | 38 049 | −1,24 | 2 424 | −4,23 |