Grunnleggende statistikk
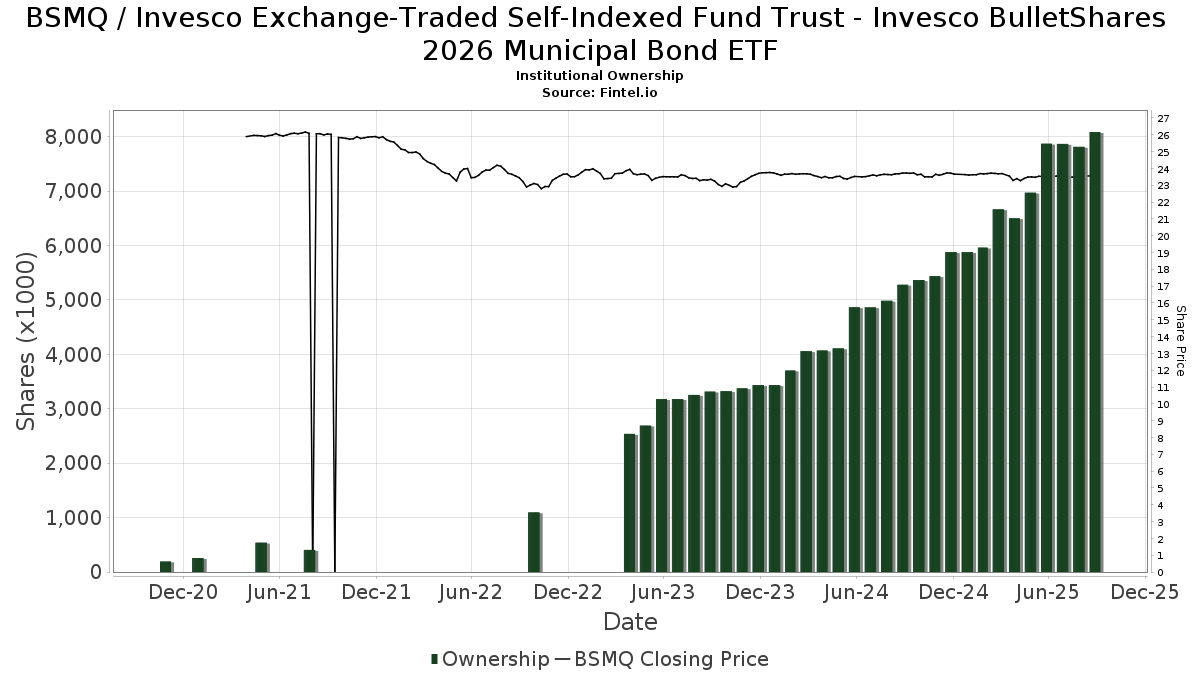
| Institusjonelle eiere | 144 total, 144 long only, 0 short only, 0 long/short - change of 5,84% MRQ |
| Gjennomsnittlig porteføljeallokering | 0.0921 % - change of −0,74% MRQ |
| Institusjonelle aksjer (Long) | 8 088 533 (ex 13D/G) - change of 0,22MM shares 2,73% MRQ |
| Institusjonell verdi (Long) | $ 176 705 USD ($1000) |
Institusjonelt eierskap og aksjonærer
Invesco Exchange-Traded Self-Indexed Fund Trust - Invesco BulletShares 2026 Municipal Bond ETF (US:BSMQ) har 144 institusjonelle eiere og aksjonærer som har sendt inn 13D/G- eller 13F-skjemaer til Securities Exchange Commission (SEC). Disse institusjonene eier til sammen 8,088,533 aksjer. De største aksjonærene inkluderer Wells Fargo & Company/mn, LPL Financial LLC, Morgan Stanley, Bank Of America Corp /de/, Truist Financial Corp, Invesco Ltd., Commonwealth Equity Services, Llc, Bank of New York Mellon Corp, Central Valley Advisors, Llc, and UBS Group AG .
Invesco Exchange-Traded Self-Indexed Fund Trust - Invesco BulletShares 2026 Municipal Bond ETF (NasdaqGM:BSMQ) institusjonell eierstruktur viser nåværende posisjoner i selskapet fordelt på institusjoner og fond, samt de siste endringene i posisjonsstørrelse. De største aksjonærene kan være individuelle investorer, verdipapirfond, hedgefond eller institusjoner. Schedule 13D indikerer at investoren eier (eller har eid) mer enn 5 % av selskapet og har til hensikt (eller hadde til hensikt) å aktivt forfølge en endring i forretningsstrategien. Schedule 13G indikerer en passiv investering på over 5 %.
The share price as of September 9, 2025 is 23,58 / share. Previously, on September 10, 2024, the share price was 23,69 / share. This represents a decline of 0,45% over that period.
Fondssentiment-score
Fondssentiment Score (også kjent som akkumulering av eierskap poengsum) viser hvilke aksjer som er mest kjøpt av fond. Den er resultatet av en sofistikert, kvantitativ flerfaktormodell som identifiserer selskaper med de høyeste nivåene av institusjonell akkumulering. Beregningsmodellen for poeng bruker en kombinasjon av den totale økningen i antall offentliggjorte eiere, endringer i porteføljeallokeringen til disse eierne og andre beregninger. Tallet går fra 0 til 100, der høyere tall indikerer en høyere grad av akkumulering i forhold til sammenlignbare selskaper, der 50 er gjennomsnittet.
Oppdateringsfrekvens: Daglig
Sjekk ut Ownership Explorer, som inneholder en liste over de høyest rangerte selskapene.
Institusjonell Put/Call-forhold
I tillegg til å rapportere standard aksje- og gjeldsemisjoner må institusjoner med mer enn 100 millioner kroner i forvaltningskapital også oppgi beholdningen av put- og callopsjoner. Siden put-opsjoner generelt indikerer et negativt sentiment, og call-opsjoner indikerer et positivt sentiment, kan vi få et inntrykk av det generelle institusjonelle sentimentet ved å plotte forholdet mellom put- og call-opsjoner. Diagrammet til høyre viser det historiske forholdet mellom put- og call-opsjoner for dette instrumentet.
Ved å bruke Put/Call-forholdet som en indikator på investorsentimentet kan man overvinne en av de viktigste svakhetene ved å bruke totalt institusjonelt eierskap, nemlig at en betydelig andel av forvaltningskapitalen investeres passivt for å følge indekser. Passivt forvaltede fond kjøper vanligvis ikke opsjoner, slik at indikatoren for put/call-forhold i større grad gjenspeiler stemningen i aktivt forvaltede fond.
13F- og NPORT-arkiveringer
Detaljer om 13F-arkiveringer er gratis. Detaljer om NP-arkiveringer krever et premium-medlemskap. Grønne rader indikerer nye posisjoner. Røde rader indikerer lukkede posisjoner. Klikk på lenke ikonet for å se hele transaksjonshistorikken.
Oppgrader
for å låse opp premiedata og eksportere til Excel. ![]() .
.
| Fildato | Kilde | Investor | Type | Gjennomsnittlig pris (estimert) |
Aksjer | Δ Aksjer (%) |
Rapportert verdi ($1000) | Verdi (%) | Portallokering (%) | |
|---|---|---|---|---|---|---|---|---|---|---|
| 2025-07-10 | 13F | Sterling Financial Group, Inc. | 18 408 | −0,83 | 434 | −1,14 | ||||
| 2025-07-14 | 13F | AdvisorNet Financial, Inc | 911 | 0,00 | 21 | 0,00 | ||||
| 2025-07-11 | 13F | Farther Finance Advisors, LLC | 3 026 | 89,12 | 71 | 91,89 | ||||
| 2025-07-09 | 13F | Central Valley Advisors, Llc | 182 424 | −1,44 | 4 298 | −1,67 | ||||
| 2025-07-25 | 13F | Cwm, Llc | 10 796 | 0,67 | 0 | |||||
| 2025-08-06 | 13F | Commonwealth Equity Services, Llc | 291 874 | −5,53 | 7 | −14,29 | ||||
| 2025-08-12 | 13F | Proequities, Inc. | 0 | 0 | ||||||
| 2025-08-06 | 13F | Prospera Financial Services Inc | 12 153 | 0,02 | 286 | 0,00 | ||||
| 2025-07-21 | 13F | Precedent Wealth Partners, Llc | 111 085 | 9,94 | 2 617 | 9,73 | ||||
| 2025-08-13 | 13F | VestGen Advisors, LLC | 149 868 | 1,39 | 3 526 | 1,03 | ||||
| 2025-08-14 | 13F | Royal Bank Of Canada | 22 829 | −0,64 | 538 | −0,74 | ||||
| 2025-07-28 | 13F | Harbour Investments, Inc. | 17 608 | 2,18 | 415 | 1,97 | ||||
| 2025-08-14 | 13F | Integrated Wealth Concepts LLC | 149 088 | 32,55 | 3 513 | 32,28 | ||||
| 2025-07-22 | 13F | Wealthcare Advisory Partners LLC | 17 754 | 6,41 | 418 | 6,36 | ||||
| 2025-08-01 | 13F | Envestnet Asset Management Inc | 170 080 | −19,56 | 4 007 | −19,73 | ||||
| 2025-04-23 | 13F | Creative Financial Designs Inc /adv | 0 | −100,00 | 0 | |||||
| 2025-08-15 | 13F | Cooksen Wealth, LLC | 14 776 | 0,00 | 348 | 0,00 | ||||
| 2025-07-29 | 13F | Wingate Wealth Advisors, Inc. | 15 033 | 0,71 | 354 | 0,57 | ||||
| 2025-07-28 | 13F | Tlwm | 22 458 | 0,00 | 529 | −0,19 | ||||
| 2025-08-11 | 13F | Western Wealth Management, LLC | 10 900 | 257 | ||||||
| 2025-07-08 | 13F | Legacy Private Trust Co. | 73 835 | 14,41 | 1 740 | 14,18 | ||||
| 2025-08-08 | 13F | Cetera Investment Advisers | 15 204 | 9,07 | 358 | 8,81 | ||||
| 2025-08-07 | 13F | Midland Wealth Advisors Llc | 0 | −100,00 | 0 | |||||
| 2025-08-11 | 13F | Aptus Capital Advisors, LLC | 60 907 | 8,24 | 1 435 | 7,98 | ||||
| 2025-08-11 | 13F | Landaas & Co /wi /adv | 9 986 | 235 | ||||||
| 2025-08-12 | 13F | Kohmann Bosshard Financial Services, LLC | 10 302 | 0,00 | 243 | −0,41 | ||||
| 2025-07-17 | 13F | Oak Family Advisors, Llc | 15 338 | 6,97 | 361 | 6,80 | ||||
| 2025-08-08 | 13F | Larson Financial Group LLC | 5 337 | 0,00 | 126 | −0,79 | ||||
| 2025-09-04 | 13F/A | Advisor Group Holdings, Inc. | 170 171 | −7,84 | 4 009 | −8,03 | ||||
| 2025-08-11 | 13F | HighTower Advisors, LLC | 35 457 | 49,34 | 835 | 49,11 | ||||
| 2025-08-14 | 13F | Warren Averett Asset Management, LLC | 23 412 | 13,32 | 552 | 13,14 | ||||
| 2025-07-15 | 13F | Accurate Wealth Management, LLC | 23 724 | 560 | ||||||
| 2025-07-18 | 13F | Truist Financial Corp | 298 961 | −1,06 | 7 044 | −1,26 | ||||
| 2025-07-22 | 13F | Marietta Wealth Management, LLC | 21 245 | 501 | ||||||
| 2025-08-12 | 13F | YANKCOM Partnership | 21 440 | 42,81 | 505 | 42,66 | ||||
| 2025-07-11 | 13F | AA Financial Advisors, LLC | 21 557 | −4,78 | 508 | −5,06 | ||||
| 2025-08-12 | 13F | Cornerstone Wealth Management, LLC | 56 185 | 21,78 | 1 324 | 21,49 | ||||
| 2025-08-19 | 13F | Anchor Investment Management, LLC | 3 000 | 0,00 | 71 | 0,00 | ||||
| 2025-07-21 | 13F | Crews Bank & Trust | 8 475 | 0,00 | 200 | −0,50 | ||||
| 2025-07-28 | 13F | Mutual Advisors, LLC | 8 935 | 210 | ||||||
| 2025-07-23 | 13F | WESPAC Advisors, LLC | 26 036 | 48,78 | 613 | 48,43 | ||||
| 2025-08-08 | 13F | Francis Financial, Inc. | 8 635 | 0,00 | 203 | 0,00 | ||||
| 2025-08-14 | 13F | Foronjy Financial Llc | 22 530 | 531 | ||||||
| 2025-08-14 | 13F | Jane Street Group, Llc | 84 524 | −26,31 | 1 991 | −26,48 | ||||
| 2025-08-14 | 13F | Ameriprise Financial Inc | 10 254 | 242 | ||||||
| 2025-07-15 | 13F | Garrett Investment Advisors LLC | 34 564 | −40,92 | 814 | −41,06 | ||||
| 2025-08-11 | 13F | PAX Financial Group, LLC | 48 414 | −12,59 | 1 141 | −12,78 | ||||
| 2025-07-30 | 13F | Brookstone Capital Management | 9 478 | 0,97 | 223 | 0,90 | ||||
| 2025-08-05 | 13F | Hills Bank & Trust Co | 78 182 | 3,38 | 1 842 | 3,14 | ||||
| 2025-08-12 | 13F | Northeast Planning Associates, Inc. / Nh / | 11 077 | 13,02 | 261 | 12,55 | ||||
| 2025-08-08 | 13F | Pnc Financial Services Group, Inc. | 27 874 | −49,66 | 657 | −49,81 | ||||
| 2025-07-08 | 13F | Webster Bank, N. A. | 11 772 | −12,65 | 277 | −12,89 | ||||
| 2025-07-10 | 13F | Wealth Enhancement Advisory Services, Llc | 26 471 | 0,00 | 623 | −0,16 | ||||
| 2025-08-06 | 13F | Paulson Wealth Management Inc. | 40 104 | −9,92 | 945 | −10,18 | ||||
| 2025-08-12 | 13F | Steward Partners Investment Advisory, Llc | 1 060 | 25 | ||||||
| 2025-07-18 | 13F | Foundry Financial Group, Inc. | 8 500 | 0,00 | 200 | 0,00 | ||||
| 2025-07-16 | 13F | Tassel Capital Management, Inc. | 15 546 | 0,71 | 366 | 0,55 | ||||
| 2025-07-31 | 13F | Resonant Capital Advisors, LLC | 65 489 | −2,99 | 1 543 | −3,20 | ||||
| 2025-08-06 | 13F | SNS Financial Group, LLC | 10 620 | 250 | ||||||
| 2025-08-01 | 13F | First Command Advisory Services, Inc. | 57 914 | 0,56 | 1 364 | 0,37 | ||||
| 2025-08-13 | 13F | Vermillion & White Wealth Management Group, LLC | 28 249 | −27,58 | 666 | −27,72 | ||||
| 2025-08-14 | 13F | Comerica Bank | 3 072 | 0,00 | 72 | 0,00 | ||||
| 2025-07-23 | 13F | Opulen Financial Group LLC | 12 599 | 0,71 | 297 | 0,34 | ||||
| 2025-08-13 | 13F | Farnam Financial LLC | 56 263 | 0,00 | 1 326 | −0,23 | ||||
| 2025-08-11 | 13F | Pinnacle Financial Group, LLC / IL | 0 | −100,00 | 0 | |||||
| 2025-07-25 | 13F | Hobbs Group Advisors, LLC | 19 097 | −47,43 | 450 | −47,61 | ||||
| 2025-08-13 | 13F | Capital Analysts, Inc. | 1 317 | 0,00 | 0 | |||||
| 2025-08-05 | 13F | Bank of New York Mellon Corp | 196 529 | −5,51 | 4 630 | −5,70 | ||||
| 2025-08-12 | 13F | Farmers National Bank | 63 128 | 1,85 | 1 487 | 1,64 | ||||
| 2025-08-13 | 13F | Denver Wealth Management, Inc. | 13 181 | −4,20 | 311 | −4,32 | ||||
| 2025-05-14 | 13F | Change Path, LLC | 0 | −100,00 | 0 | |||||
| 2025-07-10 | 13F | Voisard Asset Management Group, Inc. | 44 212 | 14,65 | 1 042 | 14,40 | ||||
| 2025-08-12 | 13F | OneAscent Financial Services LLC | 132 059 | 7,85 | 3 | 50,00 | ||||
| 2025-08-07 | 13F | Resources Investment Advisors, LLC. | 34 883 | 2,49 | 822 | 2,24 | ||||
| 2025-08-06 | 13F | Atlantic Union Bankshares Corp | 165 321 | 11,55 | 3 895 | 11,29 | ||||
| 2025-08-15 | 13F | Captrust Financial Advisors | 19 556 | 0,00 | 461 | −0,22 | ||||
| 2025-04-11 | 13F | Davis Capital Management | 14 767 | 0,00 | 349 | 0,00 | ||||
| 2025-08-14 | 13F | UBS Group AG | 177 892 | −2,51 | 4 191 | −2,72 | ||||
| 2025-08-01 | 13F | Gwn Securities Inc. | 0 | −100,00 | 0 | |||||
| 2025-08-14 | 13F | Fmr Llc | 69 | −68,35 | 2 | −80,00 | ||||
| 2025-08-05 | 13F | Sigma Planning Corp | 0 | −100,00 | 0 | |||||
| 2025-07-24 | 13F | IFP Advisors, Inc | 1 129 | −37,49 | 27 | −38,10 | ||||
| 2025-07-01 | 13F | Harbor Investment Advisory, Llc | 150 | 0,00 | 4 | 0,00 | ||||
| 2025-07-17 | 13F | Nelson, Van Denburg & Campbell Wealth Management Group, LLC | 9 613 | 0,00 | 226 | 0,00 | ||||
| 2025-08-14 | 13F | IHT Wealth Management, LLC | 13 296 | 0,00 | 313 | 0,00 | ||||
| 2025-07-16 | 13F | Signaturefd, Llc | 41 651 | 0,00 | 981 | −0,20 | ||||
| 2025-08-01 | 13F | Koss-Olinger Consulting, LLC | 31 181 | 188,77 | 735 | 187,84 | ||||
| 2025-08-12 | 13F | Heritage Trust Co | 20 236 | 4,38 | 477 | 4,16 | ||||
| 2025-04-15 | 13F | Members Wealth Llc | 8 485 | 200 | ||||||
| 2025-08-13 | 13F | Brown Advisory Inc | 34 400 | 0,00 | 810 | −0,25 | ||||
| 2025-08-14 | 13F | Benjamin Edwards Inc | 18 310 | −1,64 | 431 | −1,82 | ||||
| 2025-08-11 | 13F | Principal Securities, Inc. | 2 926 | −26,20 | 69 | −26,88 | ||||
| 2025-08-18 | 13F | Geneos Wealth Management Inc. | 375 | 0,00 | 9 | 0,00 | ||||
| 2025-07-14 | 13F | Clear Harbor Asset Management, LLC | 20 415 | 0,20 | 481 | −0,21 | ||||
| 2025-08-14 | 13F | GWM Advisors LLC | 160 743 | 6,17 | 3 787 | 5,96 | ||||
| 2025-07-28 | 13F | BRYN MAWR TRUST Co | 4 214 | 99 | ||||||
| 2025-07-07 | 13F | Horizons Wealth Management | 13 216 | 1,22 | 311 | 0,97 | ||||
| 2025-07-22 | 13F | Knights of Columbus Asset Advisors LLC | 7 050 | 0,00 | 166 | 0,00 | ||||
| 2025-08-13 | 13F | MONECO Advisors, LLC | 129 978 | 45,15 | 3 062 | 44,84 | ||||
| 2025-08-14 | 13F | Colony Group, LLC | 89 748 | 10,91 | 2 114 | 10,68 | ||||
| 2025-08-05 | 13F | Key FInancial Inc | 104 371 | 6,28 | 2 459 | 6,04 | ||||
| 2025-08-12 | 13F | Jacobi Capital Management LLC | 12 176 | 24,55 | 287 | 24,35 | ||||
| 2025-08-13 | 13F | Beacon Pointe Advisors, LLC | 31 179 | −0,66 | 735 | −0,94 | ||||
| 2025-08-14 | 13F | Diversify Advisory Services, LLC | 9 169 | 0,73 | 216 | 1,42 | ||||
| 2025-08-15 | 13F | Morgan Stanley | 462 536 | −8,94 | 10 897 | −9,14 | ||||
| 2025-07-25 | 13F | Yarger Wealth Strategies, Llc | 17 082 | 402 | ||||||
| 2025-08-13 | 13F | Jones Financial Companies Lllp | 18 091 | 91,18 | 426 | 90,58 | ||||
| 2025-08-13 | 13F | Northwestern Mutual Wealth Management Co | 79 348 | −5,07 | 1 869 | −5,27 | ||||
| 2025-08-14 | 13F | Wells Fargo & Company/mn | 640 934 | 1,19 | 15 100 | 0,98 | ||||
| 2025-08-19 | 13F | Advisory Services Network, LLC | 10 410 | 244 | ||||||
| 2025-08-01 | 13F | Clark Asset Management, LLC | 27 830 | 29,94 | 656 | 29,70 | ||||
| 2025-07-17 | 13F | Venture Visionary Partners LLC | 11 363 | 0,00 | 268 | −0,37 | ||||
| 2025-08-13 | 13F | Flow Traders U.s. Llc | 0 | −100,00 | 0 | |||||
| 2025-07-01 | 13F | Confluence Investment Management Llc | 110 838 | −3,06 | 2 611 | −3,26 | ||||
| 2025-08-14 | 13F | Bank Of America Corp /de/ | 340 698 | 15,96 | 8 027 | 15,72 | ||||
| 2025-08-14 | 13F | Stifel Financial Corp | 57 444 | 15,20 | 1 353 | 14,95 | ||||
| 2025-08-04 | 13F | AlphaStar Capital Management, LLC | 46 348 | 14,44 | 1 092 | 14,12 | ||||
| 2025-07-25 | 13F | Astoria Portfolio Advisors LLC. | 36 626 | −22,93 | 861 | −22,17 | ||||
| 2025-08-26 | 13F/A | Thrivent Financial For Lutherans | 67 542 | 395,94 | 2 | |||||
| 2025-08-12 | 13F | Jpmorgan Chase & Co | 0 | −100,00 | 0 | |||||
| 2025-08-14 | 13F | Mml Investors Services, Llc | 81 897 | 20,26 | 2 | 0,00 | ||||
| 2025-08-07 | 13F | Addison Advisors LLC | 15 000 | −4,21 | 353 | −4,34 | ||||
| 2025-07-16 | 13F | ORG Partners LLC | 850 | 0,00 | 20 | 0,00 | ||||
| 2025-08-11 | 13F | Private Advisor Group, LLC | 32 899 | 17,83 | 775 | 17,60 | ||||
| 2025-07-22 | 13F | Kickstand Ventures, Llc. | 18 536 | 14,46 | 437 | 14,14 | ||||
| 2025-08-08 | 13F | Meridian Wealth Management, LLC | 32 532 | 0,00 | 766 | −0,26 | ||||
| 2025-08-14 | 13F | EP Wealth Advisors, Inc. | 12 016 | −26,61 | 283 | −26,68 | ||||
| 2025-07-14 | 13F | Sentinel Pension Advisors Inc | 37 957 | −2,04 | 894 | −2,19 | ||||
| 2025-07-22 | 13F | Duncan Williams Asset Management, LLC | 18 536 | 437 | ||||||
| 2025-08-11 | 13F | Elequin Capital Lp | 27 234 | 642 | ||||||
| 2025-07-28 | 13F | Axxcess Wealth Management, Llc | 8 993 | 212 | ||||||
| 2025-08-11 | 13F | Howard Wealth Management, Llc | 14 685 | 16,46 | 346 | 16,16 | ||||
| 2025-08-13 | 13F | Cary Street Partners Financial Llc | 8 950 | 0,00 | 211 | −0,47 | ||||
| 2025-08-06 | 13F | Savant Capital, LLC | 30 660 | 0,06 | 722 | −0,14 | ||||
| 2025-03-25 | 13F | Higgins & Schmidt Wealth Strategies LLC | 0 | −100,00 | 0 | −100,00 | ||||
| 2025-08-05 | 13F | Huntington National Bank | 338 | −40,04 | ||||||
| 2025-08-19 | 13F | Asset Dedication, LLC | 131 581 | 14,54 | 3 100 | 14,31 | ||||
| 2025-08-14 | 13F | Raymond James Financial Inc | 159 077 | 4,26 | 3 748 | 4,03 | ||||
| 2025-04-15 | 13F | Collier Financial | 11 195 | −19,32 | 264 | −19,27 | ||||
| 2025-08-13 | 13F | Invesco Ltd. | 296 072 | 4,27 | 6 975 | 4,04 | ||||
| 2025-08-12 | 13F | MAI Capital Management | 1 375 | 0,73 | 32 | 0,00 | ||||
| 2025-08-15 | 13F | Equitable Holdings, Inc. | 10 797 | −18,74 | 254 | −18,85 | ||||
| 2025-08-25 | 13F | Silverlake Wealth Management Llc | 13 083 | 0,00 | 308 | 0,00 | ||||
| 2025-08-12 | 13F | LPL Financial LLC | 500 997 | 18,43 | 11 803 | 18,18 | ||||
| 2025-08-13 | 13F | Lido Advisors, LLC | 27 410 | 8,73 | 646 | 8,40 | ||||
| 2025-07-29 | 13F | Latitude Advisors, LLC | 0 | −100,00 | 0 | |||||
| 2025-07-10 | 13F | Focus Financial Network, Inc. | 39 126 | −50,31 | 922 | −50,46 | ||||
| 2025-07-25 | 13F | Bill Few Associates, Inc. | 17 462 | 0,00 | 411 | −0,24 | ||||
| 2025-08-13 | 13F | StoneX Group Inc. | 22 224 | −21,61 | 524 | −21,82 | ||||
| 2025-07-16 | 13F | Kathmere Capital Management, LLC | 55 773 | 150,97 | 1 314 | 150,76 | ||||
| 2025-07-29 | 13F | Private Trust Co Na | 12 125 | −24,57 | 286 | −24,80 | ||||
| 2025-07-31 | 13F | Carnegie Capital Asset Management, LLC | 23 685 | −16,85 | 558 | −16,34 | ||||
| 2025-07-21 | 13F | Old Second National Bank Of Aurora | 5 744 | −27,08 | 135 | −27,03 | ||||
| 2025-07-30 | 13F | Eqis Capital Management, Inc. | 11 926 | −4,52 | 281 | −4,76 | ||||
| 2025-07-14 | 13F | Masso Torrence Wealth Management Inc. | 12 953 | 8,37 | 305 | 8,16 | ||||
| 2025-08-04 | 13F | Atria Investments Llc | 0 | −100,00 | 0 | |||||
| 2025-07-21 | 13F | River Street Advisors LLC | 18 302 | 431 |