Grunnleggende statistikk
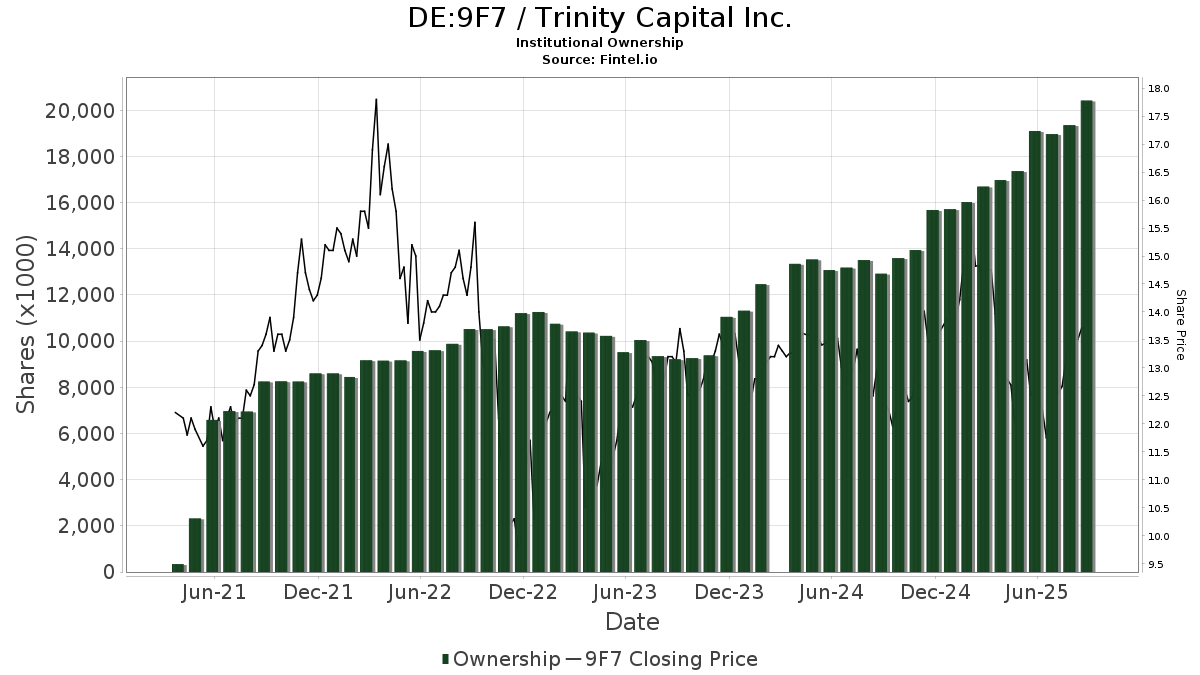
| Institusjonelle aksjer (Long) | 20 420 598 - 29,04% (ex 13D/G) - change of 1,32MM shares 6,90% MRQ |
| Institusjonell verdi (Long) | $ 284 937 USD ($1000) |
Institusjonelt eierskap og aksjonærer
Trinity Capital Inc. (DE:9F7) har 153 institusjonelle eiere og aksjonærer som har sendt inn 13D/G- eller 13F-skjemaer til Securities Exchange Commission (SEC). Disse institusjonene eier til sammen 20,420,598 aksjer. De største aksjonærene inkluderer Van Eck Associates Corp, BIZD - VanEck Vectors BDC Income ETF, Melia Wealth LLC, Rockefeller Capital Management L.P., Invesco Ltd., Emerald Advisers, Llc, KBWD - Invesco KBW High Dividend Yield Financial ETF, QVT Financial LP, Two Sigma Advisers, Lp, and UBS Group AG .
Trinity Capital Inc. (DB:9F7) institusjonell eierstruktur viser nåværende posisjoner i selskapet fordelt på institusjoner og fond, samt de siste endringene i posisjonsstørrelse. De største aksjonærene kan være individuelle investorer, verdipapirfond, hedgefond eller institusjoner. Schedule 13D indikerer at investoren eier (eller har eid) mer enn 5 % av selskapet og har til hensikt (eller hadde til hensikt) å aktivt forfølge en endring i forretningsstrategien. Schedule 13G indikerer en passiv investering på over 5 %.
The share price as of September 12, 2025 is 13,49 / share. Previously, on September 13, 2024, the share price was 12,35 / share. This represents an increase of 9,23% over that period.
Fondssentiment-score
Fondssentiment Score (også kjent som akkumulering av eierskap poengsum) viser hvilke aksjer som er mest kjøpt av fond. Den er resultatet av en sofistikert, kvantitativ flerfaktormodell som identifiserer selskaper med de høyeste nivåene av institusjonell akkumulering. Beregningsmodellen for poeng bruker en kombinasjon av den totale økningen i antall offentliggjorte eiere, endringer i porteføljeallokeringen til disse eierne og andre beregninger. Tallet går fra 0 til 100, der høyere tall indikerer en høyere grad av akkumulering i forhold til sammenlignbare selskaper, der 50 er gjennomsnittet.
Oppdateringsfrekvens: Daglig
Sjekk ut Ownership Explorer, som inneholder en liste over de høyest rangerte selskapene.
13F- og NPORT-arkiveringer
Detaljer om 13F-arkiveringer er gratis. Detaljer om NP-arkiveringer krever et premium-medlemskap. Grønne rader indikerer nye posisjoner. Røde rader indikerer lukkede posisjoner. Klikk på lenke ikonet for å se hele transaksjonshistorikken.
Oppgrader
for å låse opp premiedata og eksportere til Excel. ![]() .
.
| Fildato | Kilde | Investor | Type | Gjennomsnittlig pris (estimert) |
Aksjer | Δ Aksjer (%) |
Rapportert verdi ($1000) | Verdi (%) | Portallokering (%) | |
|---|---|---|---|---|---|---|---|---|---|---|
| 2025-08-06 | 13F | Round Rock Advisors, LLC | 580 619 | 8,95 | 8 169 | 1,11 | ||||
| 2025-07-31 | 13F | Oppenheimer & Co Inc | 30 390 | 15,50 | 428 | 7,29 | ||||
| 2025-08-06 | 13F | First Horizon Advisors, Inc. | 2 289 | 32 | ||||||
| 2025-08-13 | 13F | Invesco Ltd. | 838 194 | 2,66 | 11 793 | −4,72 | ||||
| 2025-06-25 | NP | HSSAX - Emerald Banking and Finance Fund Class A | 59 403 | 0,00 | 863 | −4,96 | ||||
| 2025-08-13 | 13F | Texas Capital Bank Wealth Management Services Inc | 22 066 | −48,84 | 310 | −52,53 | ||||
| 2025-03-28 | NP | DVDN - Kingsbarn Dividend Opportunity ETF | 3 879 | 59 | ||||||
| 2025-08-14 | 13F | Tudor Investment Corp Et Al | 20 077 | 36,31 | 282 | 26,46 | ||||
| 2025-08-13 | 13F | Legacy Capital Wealth Partners, LLC | 89 257 | −3,08 | 1 256 | −10,10 | ||||
| 2025-08-06 | 13F | Commonwealth Equity Services, Llc | 138 248 | 16,22 | 2 | 0,00 | ||||
| 2025-08-01 | 13F | Y-Intercept (Hong Kong) Ltd | 151 828 | 2 136 | ||||||
| 2025-08-14 | 13F | Kovitz Investment Group Partners, LLC | 18 553 | −4,07 | 271 | −7,85 | ||||
| 2025-08-13 | 13F | Townsquare Capital Llc | 0 | −100,00 | 0 | |||||
| 2025-07-28 | 13F | Axxcess Wealth Management, Llc | 0 | −100,00 | 0 | |||||
| 2025-08-12 | 13F | Advisors Asset Management, Inc. | 268 699 | 40,29 | 3 781 | 30,21 | ||||
| 2025-08-01 | 13F | Envestnet Asset Management Inc | 54 411 | 0,25 | 766 | −6,93 | ||||
| 2025-05-15 | 13F | CAPROCK Group, Inc. | 21 000 | 329 | ||||||
| 2025-07-30 | 13F | D.a. Davidson & Co. | 20 590 | 95,39 | 290 | 81,76 | ||||
| 2025-08-14 | 13F | Jane Street Group, Llc | Put | 0 | −100,00 | 0 | −100,00 | |||
| 2025-08-14 | 13F | Ameriprise Financial Inc | 296 212 | 6,31 | 4 157 | −1,59 | ||||
| 2025-08-14 | 13F | Vident Advisory, LLC | 46 640 | 109,91 | 656 | 95,24 | ||||
| 2025-07-08 | 13F/A | Salem Investment Counselors Inc | 500 | 7 | ||||||
| 2025-09-10 | NP | Putnam ETF Trust - Putnam BDC ETF - | 513 629 | 22,55 | 7 699 | 26,44 | ||||
| 2025-08-12 | 13F | CIBC Private Wealth Group, LLC | 2 253 | 0,00 | 32 | 3,33 | ||||
| 2025-08-15 | 13F | Morgan Stanley | 276 839 | 48,85 | 3 895 | 38,17 | ||||
| 2025-07-01 | 13F | Confluence Investment Management Llc | 59 052 | 0,01 | 831 | −7,26 | ||||
| 2025-07-18 | 13F | PFG Investments, LLC | 13 129 | −0,57 | 185 | −8,00 | ||||
| 2025-08-13 | 13F | ExodusPoint Capital Management, LP | 0 | −100,00 | 0 | |||||
| 2025-08-13 | 13F | Kennedy Capital Management, Inc. | 265 864 | 8,56 | 3 741 | 0,75 | ||||
| 2025-08-14 | 13F | Bank Of America Corp /de/ | 188 121 | 67,64 | 2 647 | 55,56 | ||||
| 2025-05-15 | 13F | Mariner, LLC | 0 | −100,00 | 0 | |||||
| 2025-08-14 | 13F | Jane Street Group, Llc | Call | 10 300 | 1,98 | 145 | −5,88 | |||
| 2025-08-14 | 13F | Jane Street Group, Llc | 19 186 | 270 | ||||||
| 2025-08-12 | 13F | Jpmorgan Chase & Co | 3 843 | 54 | ||||||
| 2025-08-22 | NP | Eagle Point Enhanced Income Trust | 74 896 | 1 054 | ||||||
| 2025-08-06 | 13F | Smh Capital Advisors Inc | 135 485 | −0,39 | 1 906 | −7,52 | ||||
| 2025-08-12 | 13F | Hillsdale Investment Management Inc. | 0 | −100,00 | 0 | |||||
| 2025-08-14 | 13F | Millennium Management Llc | 491 727 | 34,99 | 6 919 | 25,28 | ||||
| 2025-08-13 | 13F | Beacon Pointe Advisors, LLC | 52 400 | 737 | ||||||
| 2025-08-14 | 13F | Aquatic Capital Management LLC | 27 140 | −39,77 | 382 | −44,22 | ||||
| 2025-07-31 | 13F | MQS Management LLC | 10 114 | 142 | ||||||
| 2025-07-18 | 13F | Trust Co Of Vermont | 1 400 | −79,86 | 20 | −81,90 | ||||
| 2025-08-14 | 13F | UBS Group AG | 591 316 | 30,47 | 8 320 | 21,09 | ||||
| 2025-08-14 | 13F | Schonfeld Strategic Advisors LLC | 15 332 | 216 | ||||||
| 2025-07-10 | 13F | Moody National Bank Trust Division | 18 537 | 1,12 | 261 | −6,14 | ||||
| 2025-07-10 | 13F | Wealth Enhancement Advisory Services, Llc | 16 524 | 22,60 | 236 | 15,69 | ||||
| 2025-05-15 | 13F | Concentric Capital Strategies, LP | 0 | −100,00 | 0 | |||||
| 2025-08-13 | 13F | Russell Investments Group, Ltd. | 25 | −92,82 | 0 | −100,00 | ||||
| 2025-09-04 | 13F/A | Advisor Group Holdings, Inc. | 60 877 | 49,63 | 857 | 38,74 | ||||
| 2025-08-14 | 13F | McIlrath & Eck, LLC | 4 186 | 0,00 | 59 | −7,94 | ||||
| 2025-08-29 | 13F | Total Investment Management Inc | 100 | 1 | ||||||
| 2025-08-05 | 13F | Simplex Trading, Llc | 261 | 0 | ||||||
| 2025-07-22 | 13F | Awm Capital, Llc | 64 583 | 14,77 | 952 | 8,06 | ||||
| 2025-08-12 | 13F | BlackRock, Inc. | 315 266 | 30,74 | 4 436 | 21,34 | ||||
| 2025-08-12 | 13F | Dynamic Technology Lab Private Ltd | 26 177 | 24,06 | 368 | 15,00 | ||||
| 2025-08-04 | 13F | Emerald Mutual Fund Advisers Trust | 577 713 | 0,00 | 8 128 | −7,19 | ||||
| 2025-08-08 | 13F | Cetera Investment Advisers | 72 808 | −1,69 | 1 024 | −8,73 | ||||
| 2025-08-14 | 13F | Principal Street Partners, LLC | 24 713 | −7,54 | 348 | −14,32 | ||||
| 2025-08-13 | 13F | Quantbot Technologies LP | 155 851 | 322,26 | 2 193 | 292,13 | ||||
| 2025-08-13 | 13F | PharVision Advisers, LLC | 26 488 | 89,73 | 373 | 76,30 | ||||
| 2025-08-15 | 13F | CI Private Wealth, LLC | 209 838 | 159,64 | 2 952 | 140,98 | ||||
| 2025-08-14 | 13F/A | Rockefeller Capital Management L.P. | 895 784 | 1,89 | 12 604 | −5,43 | ||||
| 2025-07-28 | 13F | Melia Wealth LLC | 1 148 936 | 4,08 | 16 166 | −3,41 | ||||
| 2025-04-17 | 13F | Sound Income Strategies, LLC | 0 | −100,00 | 0 | |||||
| 2025-08-14 | 13F | Gotham Asset Management, LLC | 50 000 | 54,80 | 704 | 43,76 | ||||
| 2025-08-15 | 13F | Tower Research Capital LLC (TRC) | 90 | 172,73 | 1 | |||||
| 2025-08-14 | 13F | Van Eck Associates Corp | 1 520 403 | 10,63 | 21 | 5,00 | ||||
| 2025-08-12 | 13F | Financial Advocates Investment Management | 15 250 | 215 | ||||||
| 2025-08-13 | 13F | Bare Financial Services, Inc | 258 | 4 | ||||||
| 2025-08-12 | 13F | Entropy Technologies, LP | 0 | −100,00 | 0 | |||||
| 2025-08-28 | NP | TRIFX - Catalyst/SMH Total Return Income Fund Class A | 70 337 | 0,00 | 990 | −7,22 | ||||
| 2025-05-30 | NP | PRISX - T. Rowe Price Financial Services Fund, Inc. This fund is a listed as child fund of Price T Rowe Associates Inc /md/ and if that institution has disclosed ownership in this security, then these positions will not be double counted when calculating total shares and total value | 93 024 | −52,42 | 1 410 | −50,16 | ||||
| 2025-08-14 | 13F | Balyasny Asset Management Llc | 0 | −100,00 | 0 | |||||
| 2025-07-28 | NP | KBWD - Invesco KBW High Dividend Yield Financial ETF This fund is a listed as child fund of Invesco Ltd. and if that institution has disclosed ownership in this security, then these positions will not be double counted when calculating total shares and total value | 803 349 | −16,31 | 11 697 | −26,42 | ||||
| 2025-08-13 | 13F | Truvestments Capital Llc | 2 573 | −10,25 | 36 | −16,28 | ||||
| 2025-08-14 | 13F | Royal Bank Of Canada | 34 239 | 33,07 | 482 | 23,59 | ||||
| 2025-08-08 | 13F | Geode Capital Management, Llc | 14 443 | 0,00 | 203 | −6,88 | ||||
| 2025-08-12 | 13F | SRS Capital Advisors, Inc. | 622 | 0,00 | 9 | −11,11 | ||||
| 2025-07-25 | NP | First Trust Specialty Finance & Financial Opportunities Fund This fund is a listed as child fund of First Trust Advisors Lp and if that institution has disclosed ownership in this security, then these positions will not be double counted when calculating total shares and total value | 48 000 | 0,00 | 699 | −12,09 | ||||
| 2025-08-11 | 13F | Lsv Asset Management | 10 161 | 3,54 | 0 | |||||
| 2025-05-14 | 13F | Northwestern Mutual Wealth Management Co | 0 | −100,00 | 0 | |||||
| 2025-08-15 | 13F | Keel Point, LLC | 12 426 | 0,00 | 175 | −7,45 | ||||
| 2025-07-16 | 13F | Eagle Global Advisors Llc | 21 280 | 0,00 | 299 | −7,14 | ||||
| 2025-08-14 | 13F | Sovereign's Capital Management, LLC | 140 268 | 0,00 | 1 974 | −7,20 | ||||
| 2025-08-11 | 13F | Alps Advisors Inc | 23 152 | 3,46 | 326 | −4,13 | ||||
| 2025-08-13 | 13F | Rinkey Investments | 11 957 | −41,63 | 168 | −45,81 | ||||
| 2025-07-29 | 13F | Private Trust Co Na | 1 685 | 24 | ||||||
| 2025-08-12 | 13F | Clear Street Markets Llc | 0 | −100,00 | 0 | |||||
| 2025-07-16 | 13F | Exeter Financial, LLC | 10 166 | 143 | ||||||
| 2025-07-31 | 13F | Catalyst Capital Advisors LLC | 70 337 | 0,00 | 990 | −7,22 | ||||
| 2025-08-14 | 13F | Wells Fargo & Company/mn | 154 759 | 257,68 | 2 177 | 232,37 | ||||
| 2025-08-14 | 13F | Raymond James Financial Inc | 58 792 | 9,90 | 827 | 2,10 | ||||
| 2025-08-18 | 13F | Geneos Wealth Management Inc. | 7 566 | 6,53 | 106 | −0,93 | ||||
| 2025-07-10 | 13F | Peoples Bank/KS | 0 | −100,00 | 0 | |||||
| 2025-04-22 | 13F | Synergy Financial Management, LLC | 0 | −100,00 | 0 | |||||
| 2025-08-14 | 13F | Smartleaf Asset Management LLC | 76 | −50,97 | 1 | −50,00 | ||||
| 2025-07-21 | 13F | Mirae Asset Global Investments Co., Ltd. | 25 000 | 78,57 | 352 | 58,82 | ||||
| 2025-07-28 | 13F | Naviter Wealth, LLC | 21 970 | 18,12 | 320 | 8,84 | ||||
| 2025-06-23 | NP | PPNMX - SmallCap Growth Fund I R-3 | 179 519 | 0,00 | 2 608 | −5,03 | ||||
| 2025-07-22 | 13F | Gsa Capital Partners Llp | 12 330 | −38,77 | 0 | |||||
| 2025-07-18 | 13F | Union Bancaire Privee, UBP SA | 11 760 | 5,08 | 24 658 | 14 489,94 | ||||
| 2025-07-31 | 13F | Quest Partners LLC | 61 157 | 64 275,79 | 860 | 85 900,00 | ||||
| 2025-08-04 | 13F | Emerald Advisers, Llc | 829 710 | 3,87 | 11 674 | −3,59 | ||||
| 2025-08-11 | 13F | Empowered Funds, LLC | 14 168 | −8,33 | 199 | −14,96 | ||||
| 2025-08-26 | NP | GAFCX - Virtus AlphaSimplex Global Alternatives Fund Class C | 2 493 | 35 | ||||||
| 2025-08-12 | 13F | Aigen Investment Management, Lp | 12 758 | 180 | ||||||
| 2025-07-24 | 13F | Ronald Blue Trust, Inc. | 5 929 | 40,33 | 83 | 29,69 | ||||
| 2025-08-11 | 13F | Hexagon Capital Partners LLC | 0 | −100,00 | 0 | |||||
| 2025-08-13 | 13F | EverSource Wealth Advisors, LLC | 1 598 | 58,06 | 22 | 46,67 | ||||
| 2025-08-15 | 13F | Kestra Advisory Services, LLC | 13 677 | 192 | ||||||
| 2025-08-08 | 13F | Creative Planning | 0 | −100,00 | 0 | |||||
| 2025-08-12 | 13F | LPL Financial LLC | 459 325 | 23,15 | 6 463 | 14,29 | ||||
| 2025-06-27 | NP | LBO - WHITEWOLF Publicly Listed Private Equity ETF | 15 456 | 14,29 | 225 | 8,74 | ||||
| 2025-05-15 | 13F | Talon Private Wealth, LLC | 0 | −100,00 | 0 | −100,00 | ||||
| 2025-08-14 | 13F | Susquehanna International Group, Llp | Call | 223 200 | 3 140 | |||||
| 2025-08-08 | 13F | Pnc Financial Services Group, Inc. | 3 000 | 0,00 | 42 | −6,67 | ||||
| 2025-08-14 | 13F | Susquehanna International Group, Llp | Put | 15 100 | 212 | |||||
| 2025-07-31 | 13F | Caitong International Asset Management Co., Ltd | 32 | 0,00 | 0 | |||||
| 2025-08-13 | 13F | Marshall Wace, Llp | 24 563 | 346 | ||||||
| 2025-08-14 | 13F | Cubist Systematic Strategies, LLC | 92 690 | −20,94 | 1 304 | −26,62 | ||||
| 2025-07-02 | 13F | First Financial Bank - Trust Division | 38 665 | 0,00 | 544 | −7,17 | ||||
| 2025-04-22 | 13F | Cambridge Investment Research Advisors, Inc. | 0 | −100,00 | 0 | |||||
| 2025-07-25 | 13F | Cwm, Llc | 288 | 3,60 | 0 | |||||
| 2025-08-14 | 13F | Alliancebernstein L.p. | 0 | −100,00 | 0 | |||||
| 2025-08-19 | 13F | Advisory Services Network, LLC | 160 176 | 52,66 | 2 401 | 51,01 | ||||
| 2025-08-11 | 13F | Private Advisor Group, LLC | 26 478 | 19,47 | 373 | 11,04 | ||||
| 2025-08-14 | 13F | Price T Rowe Associates Inc /md/ | 0 | −100,00 | 0 | |||||
| 2025-08-14 | 13F | State Street Corp | 56 370 | 257,75 | 822 | 233,74 | ||||
| 2025-07-24 | NP | FNCMX - Fidelity Nasdaq Composite Index Fund This fund is a listed as child fund of Fmr Llc and if that institution has disclosed ownership in this security, then these positions will not be double counted when calculating total shares and total value | 14 443 | 0,00 | 210 | −12,13 | ||||
| 2025-07-09 | 13F | Triumph Capital Management | 0 | −100,00 | 0 | |||||
| 2025-07-30 | 13F | Denali Advisors Llc | 102 530 | 1 443 | ||||||
| 2025-08-14 | 13F | Bnp Paribas Arbitrage, Sa | 68 | 1 | ||||||
| 2025-08-12 | 13F | Trexquant Investment LP | 190 369 | −23,78 | 2 678 | −29,27 | ||||
| 2025-08-12 | 13F | Franklin Resources Inc | 507 169 | 53,28 | 7 136 | 42,24 | ||||
| 2025-05-14 | 13F | Susquehanna International Group, Llp | 0 | −100,00 | 0 | −100,00 | ||||
| 2025-08-14 | 13F | Verition Fund Management LLC | 0 | −100,00 | 0 | |||||
| 2025-07-15 | 13F | Colonial River Wealth Management, LLC | 0 | −100,00 | 0 | |||||
| 2025-08-13 | 13F | Jump Financial, LLC | 135 320 | 1 904 | ||||||
| 2025-08-14 | 13F | Hrt Financial Lp | 210 981 | 39,16 | 3 | 0,00 | ||||
| 2025-08-14 | 13F | Ambassador Advisors, LLC | 247 098 | 4,38 | 3 477 | −3,12 | ||||
| 2025-08-14 | 13F | Qube Research & Technologies Ltd | 264 187 | 8,12 | 3 717 | 0,35 | ||||
| 2025-08-14 | 13F | First Commonwealth Financial Corp /pa/ | 23 741 | 0,00 | 334 | −6,96 | ||||
| 2025-08-21 | NP | BIZD - VanEck Vectors BDC Income ETF | 1 464 692 | 5,83 | 20 608 | −1,77 | ||||
| 2025-05-12 | 13F | Fmr Llc | 0 | −100,00 | 0 | |||||
| 2025-08-14 | 13F | Citadel Advisors Llc | Put | 10 400 | −61,90 | 146 | −64,65 | |||
| 2025-08-14 | 13F | Harvest Investment Services, LLC | 11 979 | 0,13 | 169 | −7,18 | ||||
| 2025-08-14 | 13F | GWM Advisors LLC | 10 238 | 2,84 | 144 | −4,00 | ||||
| 2025-07-29 | 13F | Chicago Partners Investment Group LLC | 97 296 | −0,10 | 1 461 | 8,54 | ||||
| 2025-08-14 | 13F | PDT Partners, LLC | 0 | −100,00 | 0 | |||||
| 2025-08-11 | 13F | Citigroup Inc | 0 | −100,00 | 0 | |||||
| 2025-08-14 | 13F | Citadel Advisors Llc | Call | 163 500 | 54,25 | 2 300 | 43,21 | |||
| 2025-05-28 | NP | SMLV - SPDR SSGA US Small Cap Low Volatility Index ETF This fund is a listed as child fund of State Street Corp and if that institution has disclosed ownership in this security, then these positions will not be double counted when calculating total shares and total value | 80 482 | 28,20 | 1 220 | 34,36 | ||||
| 2025-08-07 | 13F | Allworth Financial LP | 3 778 | 53 | ||||||
| 2025-08-14 | 13F | Boothbay Fund Management, Llc | 10 058 | 142 | ||||||
| 2025-08-12 | 13F | Cornerstone Wealth Management, LLC | 32 453 | 10,48 | 457 | 2,47 | ||||
| 2025-07-30 | NP | BFOR - Barron's 400 ETF | 23 152 | −8,89 | 337 | −19,76 | ||||
| 2025-07-14 | 13F | U.S. Capital Wealth Advisors, LLC | 21 000 | 295 | ||||||
| 2025-05-15 | 13F | EJF Capital LLC | 0 | −100,00 | 0 | |||||
| 2025-07-17 | 13F | GraniteShares Advisors LLC | 193 748 | 6,67 | 2 726 | −0,98 | ||||
| 2025-07-11 | 13F | Annex Advisory Services, LLC | 12 227 | 0,00 | 172 | −7,03 | ||||
| 2025-08-13 | 13F | Guggenheim Capital Llc | 39 261 | 5,73 | 552 | −1,78 | ||||
| 2025-08-14 | 13F | Group One Trading, L.p. | 14 378 | −2,98 | 202 | −9,82 | ||||
| 2025-08-14 | 13F | QVT Financial LP | Put | 750 000 | 10 552 | |||||
| 2025-08-13 | 13F | Jones Financial Companies Lllp | 326 | 226,00 | 5 | 300,00 | ||||
| 2025-05-14 | 13F | Comerica Bank | 0 | −100,00 | 0 | |||||
| 2025-08-07 | 13F | Hennion & Walsh Asset Management, Inc. | 255 096 | 3,22 | 3 589 | −4,19 | ||||
| 2025-05-14 | 13F | Campbell & CO Investment Adviser LLC | 0 | −100,00 | 0 | |||||
| 2025-07-09 | 13F | Sunpointe, LLC | 12 000 | 175 | ||||||
| 2025-07-11 | 13F | Farther Finance Advisors, LLC | 2 450 | 0,00 | 34 | −10,53 | ||||
| 2025-08-13 | 13F | M&t Bank Corp | 12 000 | 0,00 | 169 | −7,18 | ||||
| 2025-08-14 | 13F | Two Sigma Investments, Lp | 537 558 | −43,17 | 7 563 | −47,26 | ||||
| 2025-08-04 | 13F | Canton Hathaway, LLC | 96 571 | 1,38 | 1 | 0,00 | ||||
| 2025-05-13 | 13F | BKD Wealth Advisors, LLC | 0 | −100,00 | 0 | |||||
| 2025-08-12 | 13F | Global Retirement Partners, LLC | 1 203 | 0,00 | 17 | −5,88 | ||||
| 2025-08-14 | 13F | Quarry LP | 8 746 | 96,89 | 123 | 83,58 | ||||
| 2025-08-14 | 13F | Brevan Howard Capital Management LP | 62 231 | 876 | ||||||
| 2025-08-13 | 13F | Northern Trust Corp | 93 592 | 785,78 | 1 317 | 722,50 | ||||
| 2025-07-21 | 13F | Ameriflex Group, Inc. | 0 | −100,00 | 0 | |||||
| 2025-08-13 | 13F | JT Stratford LLC | 10 855 | 153 | ||||||
| 2025-08-14 | 13F | D. E. Shaw & Co., Inc. | 19 452 | −81,59 | 274 | −82,95 | ||||
| 2025-07-29 | NP | NKMCX - North Square Kennedy MicroCap Fund Class I | 11 913 | 81,35 | 173 | 60,19 | ||||
| 2025-07-28 | 13F | Harbour Investments, Inc. | 0 | −100,00 | 0 | |||||
| 2025-08-12 | 13F | Proequities, Inc. | 0 | 0 | ||||||
| 2025-08-14 | 13F | Citadel Advisors Llc | 0 | −100,00 | 0 | −100,00 | ||||
| 2025-08-14 | 13F | Ares Management Llc | 545 723 | 0,00 | 7 678 | −7,19 | ||||
| 2025-08-14 | 13F | Goldman Sachs Group Inc | 97 208 | −28,87 | 1 368 | −33,99 | ||||
| 2025-08-29 | NP | GraniteShares ETF Trust - GraniteShares HIPS US High Income ETF | 193 748 | 6,67 | 2 726 | −0,98 | ||||
| 2025-07-03 | 13F | Garde Capital, Inc. | 1 548 | 0,00 | 22 | −8,70 | ||||
| 2025-06-25 | NP | HSPGX - Emerald Growth Fund Class A | 338 791 | 0,00 | 4 923 | −5,04 | ||||
| 2025-08-14 | 13F | Two Sigma Advisers, Lp | 709 500 | −35,12 | 9 983 | −39,79 | ||||
| 2025-08-14 | 13F | Stifel Financial Corp | 423 164 | −0,30 | 5 954 | −7,48 | ||||
| 2025-08-12 | 13F | XTX Topco Ltd | 0 | −100,00 | 0 |
Other Listings
| US:TRIN | USD 16,11 |