Grunnleggende statistikk
| Short Interest | 1 472 388 shares - source: NYSE |
| Short Interest Ratio | 5,16 Days to Cover |
| Off-Exchange Short Volume | 47 415 shares - source: FINRA (inc. Dark Pool volume) |
| Off-Exchange Short Volume Ratio | 44,44 % - source: FINRA (inc. Dark Pool volume) |
Introduksjon
Denne short rente-trackeren inneholder en rekke data om korte renter, hentet fra en rekke ulike partnere. Dataene er organisert etter oppdateringshyppighet, med intradag-data øverst (tilgjengelighet av short aksjer, short lånegebyr-rate), daglige data ( short volum, mislykkede leveranser) i midten, og de langsomst oppdaterte dataene (kort rente) nederst. Merk at korte renter publiseres to ganger i måneden, etter en tidsplan fastsatt av FINRA.
Short Squeeze Score
Short Squeeze Score er resultatet av en sofistikert, flerfaktorbasert kvantitativ modell som identifiserer selskaper som har høyest risiko for å oppleve en short squeeze. Scoringsmodellen bruker en kombinasjon av korte renter, flyt, gebyrsatser for shortlån og andre beregninger. Tallet går fra 0 til 100, der høyere tall indikerer høyere risiko for en short squeeze i forhold til sammenlignbare selskaper, mens 50 er gjennomsnittet.
Oppdateringsfrekvens: Intradag
Se våre lister over short squeeze for USA, Canada, Australia og Hongkong.
Short lånegebyr-rate
WPP / WPP plc - Depositary Receipt (Common Stock) short lånegebyr-rate er vist i tabellen nedenfor. Denne tabellen viser renten som må betales av en shortselger av US:WPP til långiveren av det aktuelle verdipapiret. Dette gebyret vises som en årlig prosentsats (ÅOP). Långivere er fond eller enkeltpersoner som eier verdipapiret og som har meddelt megleren at de er villige til å låne det ut. Utbytte som utbetales til et shorted verdipapir, går til eieren/långiveren av verdipapiret, ikke til låntakeren.
- Start, Min., Maks., Siste (lånepriser)
- Disse representerer dagens innlånsrenter, med renten ved starten av dagen, ved slutten av dagen (eller senest inneværende dag), dagens minimumsrente og dagens maksimumsrente. I motsetning til de implisitte innlånsrentene for opsjoner, presenterer kilden vår for disse dataene dem alltid som positive tall, og de representerer en annualisert rente som låntakeren betaler for aksjene.
Oppdateringsfrekvens: Intradag hvert 30. minutt.
Siste oppdatering
: 24 minutes ago
| Dato | Start | Min | Maks | Siste |
|---|---|---|---|---|
| 2025-09-11 | 0,66 | 0,66 | 0,66 | 0,66 |
| 2025-09-10 | 2,54 | 0,66 | 2,54 | 0,66 |
| 2025-09-09 | 0,63 | 0,63 | 2,54 | 2,54 |
| 2025-09-08 | 0,66 | 0,62 | 0,66 | 0,63 |
| 2025-09-05 | 0,58 | 0,58 | 0,66 | 0,66 |
| 2025-09-04 | 0,58 | 0,58 | 0,58 | 0,58 |
| 2025-09-03 | 0,57 | 0,57 | 0,58 | 0,58 |
| 2025-09-02 | 0,59 | 0,54 | 0,63 | 0,57 |
| 2025-09-01 | 0,59 | 0,59 | 0,59 | 0,59 |
| 2025-08-29 | 0,54 | 0,54 | 0,59 | 0,59 |
Short-salgsvolum (utenfor børs levert av FINRA)
WPP / WPP plc - Depositary Receipt (Common Stock) short-salgsvolumet utenfor børs vises i følgende diagram. Shortsalgsvolumet viser antall handler som er markert som shortsalg på ulike handelsplasser. Hvis du vil ha mer informasjon om hvordan du tolker disse dataene, kan du lese denne informasjonsmeldingen fra FINRA.
Oppdateringsfrekvens: Daglig ved dagens slutt
- FINRAs ikke-fritatte volum
- Antall short-aksjer som er omsatt. Dette tallet oppgis ikke av FINRA, men vi beregner det ved å trekke "fritatt" fra "Short-volumet"
- FINRA fritatte volum
- Antall short-aksjer solgt som var fritatt fra uptick-regelen. Dette oppgis av FINRA. Dette tallet er inkludert i både "Short Volum" og " Totale volum".
- FINRAs short-volum
- Antall shortsolgte aksjer rapportert av FINRA. Dette inkluderer både fritatte og ikke-fritatte.
- FINRAs totale volum
- Totalt antall aksjer handlet utenfor børs rapportert av FINRA.
- FINRAs forholdstall for shortvolum
- FINRAs short-volum / FINRAs totale volum
| Markedsdato | FINRA Ikke-fritatt volum |
FINRA Fritatt volum |
FINRAs Short volum |
FINRAs Totale volum |
FINRA Short Volum Forholdstall |
||||
|---|---|---|---|---|---|---|---|---|---|
| 2025-09-10 | 47 415 | + | 0 | = | 47 415 | / | 106 689 | = | 44,44 |
| 2025-09-09 | 33 545 | + | 0 | = | 33 545 | / | 62 681 | = | 53,52 |
| 2025-09-08 | 54 880 | + | 0 | = | 54 880 | / | 111 382 | = | 49,27 |
| 2025-09-05 | 31 289 | + | 1 700 | = | 32 989 | / | 90 441 | = | 36,48 |
| 2025-09-04 | 47 717 | + | 0 | = | 47 717 | / | 157 431 | = | 30,31 |
| 2025-09-03 | 82 427 | + | 0 | = | 82 427 | / | 132 592 | = | 62,17 |
| 2025-09-02 | 98 878 | + | 0 | = | 98 878 | / | 196 930 | = | 50,21 |
| 2025-08-29 | 57 784 | + | 1 358 | = | 59 142 | / | 124 692 | = | 47,43 |
| 2025-08-28 | 55 558 | + | 547 | = | 56 105 | / | 114 991 | = | 48,79 |
| 2025-08-27 | 41 641 | + | 0 | = | 41 641 | / | 75 138 | = | 55,42 |
Short-salgsvolum (kombinert børs + utenfor børs)
Det kombinerte short-salgsvolumet på og utenfor børs for WPP / WPP plc - Depositary Receipt (Common Stock) er oppgitt i tabellen nedenfor. For å beregne et nøyaktig shortvolumforhold samler vi inn data fra en rekke handelsplasser, men ikke ALLE handelsplasser. Dette er viktig fordi det betyr at de aggregerte kolonnene for short- og totalvolum ikke viser de faktiske volumene på tvers av alle handelsplasser, men bare de handelsplassene vi sporer.
- FINRA Short-volum
- Antall short-aksjer handlet utenfor børs rapportert av FINRA. Dette inkluderer både fritatte og ikke-fritatte.
- CBOE Short-volum
- Antall short-aksjer handlet rapportert av CBOE.
- PSX/BX Short-volum
- Antall short-aksjer handlet rapportert av NASDAQ på handelsplassene PSX/BX
- Aggregert Short-volum
- FINRA short-volum + CBOE short-volum + PSX/BX short-volum. Dette er ikke det totale shortvolumet på alle handelsplasser.
- Aggregert totalt volum
- FINRA Totalt volum + CBOE Totalt volum + PSX/BX Totalt volum. Dette er ikke det totale volumet på alle handelsplasser.
- Aggregert Short-volum-forhold
- Aggregert shortvolum / aggregert totalt volum.
* Kolonnen for aggregert shortvolum og aggregert totalvolum viser ikke det faktiske totalvolumet på alle markedsplasser, men bare de markedsplassene vi følger.
Mislykkede leveranser
Verdiene for totalt antall aksjer som ikke ble levert, representerer den samlede nettosaldoen av aksjer som ikke ble levert på en bestemt oppgjørsdag. Mislykkede leveranser på en gitt dag er et kumulativt antall av alle mislykkede leveranser frem til den dagen, pluss nye mislykkede leveranser som inntreffer den dagen, minus mislykkede leveranser som gjøres opp den dagen. Tallet er ikke et daglig antall mislykkede leveranser, men et kombinert tall som inkluderer både nye mislykkede leveranser på rapporteringsdagen og eksisterende mislykkede leveranser. Med andre ord gjenspeiler disse tallene det aggregerte antallet mislykkede leveranser på et bestemt tidspunkt, og kan ha liten eller ingen sammenheng med gårsdagens aggregerte leveranser. Det er derfor viktig å merke seg at det ikke er mulig å fastslå alderen på feilene ved å se på disse tallene. Hvis alle aksjene ble levert på en bestemt dag, vil det ikke være noen oppføring i tabellen.
Oppdateringsfrekvens: SEC publiserer daglige data i batcher som leveres to ganger i måneden med ca. to ukers forsinkelse. For eksempel vil daglige data for mars måned komme i midten av april.
Disse dataene er IKKE splittjusterte - de gjenspeiler rådataene fra SEC.
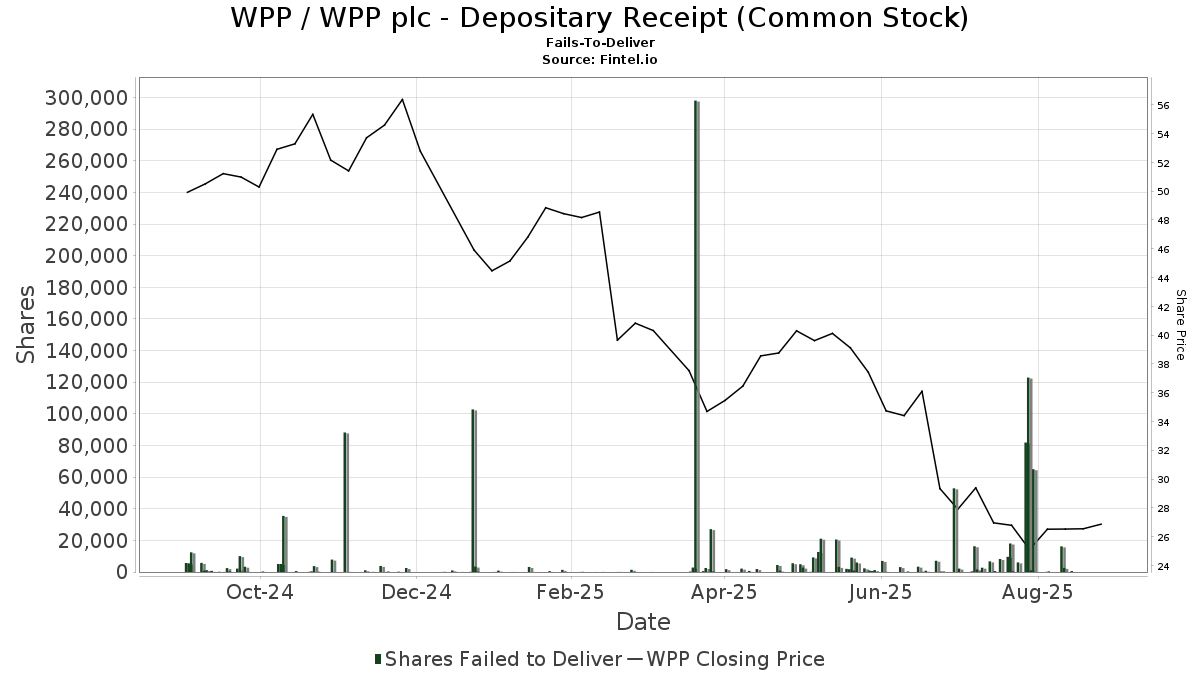
| Dato | Pris | Kvantitet | Verdi |
|---|---|---|---|
| 2025-08-14 | 25,11 | 64 974 | 1 631 497,14 |
| 2025-08-13 | 24,55 | 1 094 | 26 857,70 |
| 2025-08-12 | 24,67 | 122 946 | 3 033 077,82 |
| 2025-08-11 | 24,75 | 81 855 | 2 025 911,25 |
| 2025-08-08 | 26,17 | 6 064 | 158 694,88 |
| 2025-08-07 | 26,79 | 36 | 964,44 |
| 2025-08-06 | 26,95 | 475 | 12 801,25 |
| 2025-08-05 | 26,64 | 18 023 | 480 132,72 |
| 2025-08-04 | 26,78 | 9 620 | 257 623,60 |
| 2025-08-01 | 27,08 | 8 191 | 221 812,28 |
| 2025-07-30 | 27,60 | 617 | 17 029,20 |
| 2025-07-28 | 29,27 | 6 728 | 196 928,56 |
| 2025-07-25 | 29,21 | 2 724 | 79 568,04 |
| 2025-07-24 | 29,39 | 158 | 4 643,62 |
| 2025-07-23 | 28,82 | 1 653 | 47 639,46 |
| 2025-07-22 | 27,97 | 16 272 | 455 127,84 |
| 2025-07-21 | 27,83 | 432 | 12 022,56 |
| 2025-07-16 | 27,91 | 2 146 | 59 894,86 |
| 2025-07-14 | 27,99 | 52 912 | 1 481 006,88 |
| 2025-07-10 | 29,34 | 333 | 9 770,22 |
WPP Short rente (Daglige oppdateringer fra Fintel)
Denne delen bruker offisiell short rente levert av NYSE og gir noen merverdimetrikker som beregnes daglig. Short rente oppdateres to ganger i måneden etter en fastsatt tidsplan, men flyt kan oppdateres hyppigere (selv om det ikke endrer seg hver dag), så gir vi daglige oppdateringer av Short rente % Float for de siste femten dagene. Dager for å dekke beregnes daglig basert på de siste fem dagene med handelsvolum.
Oppdateringsfrekvens: Short rente - to ganger i måneden. Flyt - daglig (men endres sjelden) Publiseringsplan for Short rente
Disse dataene er splittjusterte.
| Markedsdato | Short rente (aksjer) |
Dager til dekning | Flyt (MM-aksjer) |
Flyt minus SI (MM aksjer) |
Short rente % Flyt |
|---|---|---|---|---|---|
| 2025-09-10 | |||||
| 2025-09-09 | |||||
| 2025-09-08 | |||||
| 2025-09-05 | |||||
| 2025-09-04 | |||||
| 2025-09-03 | |||||
| 2025-09-02 | |||||
| 2025-09-01 | |||||
| 2025-08-29 | |||||
| 2025-08-28 |
Kilde: Short rente oppgitt av NYSE- utestående aksjer og aksjeflyt oppgitt av Capital IQ.
Short rente (offisielle NYSE-data)
Denne dataen er den offisielle shortrente dataen, som levert av NYSE. Short rente er det totale antallet åpne shortposisjoner i et verdipapir. Dager til dekning er short rente dividert med gjennomsnittlig volum. Dager til dekning som er oppgitt her er den offiselle verdien levert av NYSE og kan avvike fra Dager til dekning publisert andre steder på Fintel, fordi vi bruker en kortere tilbakeblikk-analyse når vi beregner gjennomsnittlig volum.
Oppdateringsfrekvens: To ganger i måneden
Disse dataene er IKKE splittjusterte - de gjenspeiler rådataene fra børsen.
| Oppgjørs dato |
Short rente | Prosentvis endring | Dager til dekning | Flyt (MM aksjer) | Short rente % av Flyt |
Utestående aksjer (MM aksjer) |
Short rente % av SO |
|---|---|---|---|---|---|---|---|
| 2025-08-29 | 1 472 388 | 0,96 | 3,82 | ||||
| 2025-08-15 | 1 458 393 | 4,99 | 2,74 | ||||
| 2025-07-31 | 1 389 046 | 1,31 | 3,03 | ||||
| 2025-07-15 | 1 371 121 | 88,34 | 1,73 | ||||
| 2025-06-30 | 727 990 | −23,73 | 1,86 | ||||
| 2025-06-13 | 954 452 | 46,09 | 2,86 | ||||
| 2025-05-30 | 653 339 | 20,95 | 2,25 | ||||
| 2025-05-15 | 540 188 | −35,40 | 2,16 | ||||
| 2025-04-30 | 836 254 | 248,35 | 2,48 | ||||
| 2025-04-15 | 240 059 | −9,27 | 1,00 | ||||
| 2025-03-31 | 264 584 | −11,92 | 1,00 | ||||
| 2025-03-14 | 300 405 | −21,80 | 1,00 | ||||
| 2025-02-28 | 384 144 | 5,95 | 1,39 | ||||
| 2025-02-14 | 362 582 | 0,11 | 2,96 | ||||
| 2025-01-31 | 362 186 | 4,84 | 1,60 | ||||
| 2025-01-15 | 345 455 | 1,69 | 1,20 | ||||
| 2024-12-31 | 339 714 | −4,57 | 2,88 | ||||
| 2024-12-13 | 355 977 | 8,37 | 2,08 | ||||
| 2024-11-29 | 328 468 | 6,54 | 1,84 | ||||
| 2024-11-15 | 308 298 | 13,84 | 2,09 | ||||
| 2024-10-31 | 270 821 | 38,74 | 2,13 | ||||
| 2024-10-15 | 195 207 | 7,38 | 1,28 | ||||
| 2024-09-30 | 181 784 | −36,24 | 1,81 | ||||
| 2024-09-13 | 285 089 | 16,46 | 1,43 | ||||
| 2024-08-30 | 244 804 | −4,61 | 2,16 | ||||
| 2024-08-15 | 256 644 | −35,65 | 1,33 | ||||
| 2024-07-31 | 398 799 | 97,59 | 1,53 | ||||
| 2024-07-15 | 201 834 | 38,29 | 1,00 | ||||
| 2024-06-28 | 145 945 | 41,71 | 1,00 | ||||
| 2024-06-14 | 102 988 | −33,51 | 1,33 | ||||
| 2024-05-31 | 154 895 | 24,98 | 1,69 | ||||
| 2024-05-15 | 123 934 | −41,57 | 1,31 | ||||
| 2024-04-30 | 212 116 | −35,53 | 1,00 | ||||
| 2024-04-15 | 329 004 | 334,92 | 1,10 | ||||
| 2024-03-28 | 75 647 | −64,62 | 1,00 | ||||
| 2024-03-15 | 213 805 | 55,83 | 1,94 | ||||
| 2024-02-29 | 137 203 | −22,20 | 1,20 | ||||
| 2024-02-15 | 176 358 | −4,09 | 1,41 | ||||
| 2024-01-31 | 183 870 | 22,46 | 1,43 | ||||
| 2024-01-12 | 150 145 | 21,77 | 1,00 | ||||
| 2023-12-29 | 123 300 | −2,44 | 1,00 | ||||
| 2023-12-15 | 126 381 | −32,90 | 1,00 | ||||
| 2023-11-30 | 188 339 | 66,45 | 1,70 | ||||
| 2023-11-15 | 113 153 | 0,53 | 1,00 | ||||
| 2023-10-31 | 112 672 | −6,61 | 1,00 | ||||
| 2023-10-13 | 120 646 | 84,86 | 1,00 | ||||
| 2023-09-29 | 65 265 | 81,86 | 1,00 | ||||
| 2023-09-15 | 35 887 | −36,46 | 1,00 | ||||
| 2023-08-31 | 56 475 | −36,26 | 1,00 | ||||
| 2023-08-15 | 88 597 | 1,65 | 1,00 | ||||
| 2023-07-31 | 87 161 | 12,12 | 1,00 | ||||
| 2023-07-14 | 77 737 | −48,85 | 1,00 | ||||
| 2023-06-30 | 151 978 | −8,51 | 1,00 | ||||
| 2023-06-15 | 166 117 | 31,35 | 1,29 | ||||
| 2023-05-31 | 126 471 | −41,24 | 1,25 | ||||
| 2023-05-15 | 215 250 | 35,91 | 2,20 | ||||
| 2023-04-28 | 158 374 | −13,35 | 2,71 | ||||
| 2023-04-14 | 182 775 | −11,71 | 2,72 | ||||
| 2023-03-31 | 207 010 | −18,70 | 2,54 | ||||
| 2023-03-15 | 254 610 | 7,48 | 3,00 | ||||
| 2023-02-28 | 236 896 | −10,60 | 2,75 | ||||
| 2023-02-15 | 264 984 | −7,25 | 3,61 | ||||
| 2023-01-31 | 285 708 | 22,45 | 4,01 | ||||
| 2023-01-13 | 233 332 | 14,49 | 2,81 | ||||
| 2022-12-30 | 203 809 | −19,95 | 1,88 | ||||
| 2022-12-15 | 254 601 | −2,73 | 2,32 | ||||
| 2022-11-30 | 261 753 | 4,02 | 2,79 | ||||
| 2022-11-15 | 251 644 | −29,79 | 1,88 | ||||
| 2022-10-31 | 358 404 | 1,68 | 2,61 | ||||
| 2022-10-14 | 352 490 | 83,12 | 2,26 | ||||
| 2022-09-30 | 192 495 | 18,21 | 1,03 | ||||
| 2022-09-15 | 162 842 | −27,05 | 1,00 | ||||
| 2022-08-31 | 223 235 | 4,40 | 1,59 | ||||
| 2022-08-15 | 213 823 | 2,99 | 1,38 | ||||
| 2022-07-29 | 207 617 | −32,06 | 1,05 | ||||
| 2022-07-15 | 305 605 | 117,12 | 1,00 | ||||
| 2022-06-30 | 140 755 | −24,93 | 1,00 | ||||
| 2022-06-15 | 187 487 | −26,11 | 1,06 | ||||
| 2022-05-31 | 253 727 | 7,51 | 1,42 | ||||
| 2022-05-13 | 235 994 | 6,60 | 1,26 | ||||
| 2022-04-29 | 221 385 | −23,74 | 1,55 | ||||
| 2022-04-14 | 290 319 | 29,14 | 1,87 | ||||
| 2022-03-31 | 224 815 | −8,68 | 1,34 | ||||
| 2022-03-15 | 246 191 | −0,36 | 1,00 | ||||
| 2022-02-28 | 247 079 | 31,73 | 1,46 | ||||
| 2022-02-15 | 187 568 | −22,30 | 1,55 | ||||
| 2022-01-31 | 241 400 | 33,35 | 1,41 | ||||
| 2022-01-14 | 181 029 | −29,54 | 1,23 | ||||
| 2021-12-31 | 256 935 | 33,47 | 2,68 | ||||
| 2021-12-15 | 192 500 | −5,60 | 1,78 | ||||
| 2021-11-30 | 203 924 | −16,66 | 1,88 | ||||
| 2021-11-15 | 244 678 | −15,31 | 2,48 | ||||
| 2021-10-29 | 288 900 | 10,67 | 2,64 | ||||
| 2021-10-15 | 261 044 | 18,25 | 2,65 | ||||
| 2021-09-30 | 220 763 | 8,95 | 2,19 | ||||
| 2021-09-15 | 202 619 | −19,54 | 2,57 | ||||
| 2021-08-31 | 251 836 | 15,81 | 2,88 | ||||
| 2021-08-13 | 217 459 | −4,04 | 2,22 | ||||
| 2021-07-30 | 226 626 | 6,33 | 2,21 | ||||
| 2021-07-15 | 213 132 | −1,74 | 2,77 | ||||
| 2021-06-30 | 216 898 | −23,73 | 3,58 | ||||
| 2021-06-15 | 284 395 | 0,21 | 4,22 | ||||
| 2021-05-28 | 283 803 | 4,13 | 4,88 | ||||
| 2021-05-14 | 272 543 | −2,81 | 3,21 | ||||
| 2021-04-30 | 280 429 | 8,36 | 3,20 | ||||
| 2021-04-15 | 258 795 | −12,30 | 3,92 | ||||
| 2021-03-31 | 295 083 | 25,92 | 2,72 | ||||
| 2021-03-15 | 234 349 | −1,16 | 2,20 | ||||
| 2021-02-26 | 237 096 | −11,38 | 2,12 | ||||
| 2021-02-12 | 267 550 | −15,49 | 2,88 | ||||
| 2021-01-29 | 316 589 | −4,64 | 3,37 | ||||
| 2021-01-15 | 331 979 | 4,47 | 3,29 |
Kilde: Short rente oppgitt av NYSE- utestående aksjer og aksjeflyt oppgitt av Capital IQ.
Funds Disclosing Short Positions - Europe
This section shows European institutions, funds, and major shareholders that have reported short positions in the security.
Upgrade to unlock premium data.
| File Date | Owner | Issuer | ISIN | Total Capitalization Shorted (%) |
|---|---|---|---|---|
| 2025-09-08 | BlackRock Investment Management (UK) Limited | WPP PLC | JE00B8KF9B49 | 0,79 |
| 2025-09-05 | BlackRock Advisors, LLC | WPP PLC | JE00B8KF9B49 | 0,60 |
| 2025-09-03 | BlackRock Advisors, LLC | WPP PLC | JE00B8KF9B49 | 0,52 |
| 2025-08-26 | Citadel Advisors LLC | WPP PLC | JE00B8KF9B49 | 0,52 |
| 2025-08-07 | BlackRock Investment Management (UK) Limited | WPP PLC | JE00B8KF9B49 | 0,93 |
| 2025-08-06 | Citadel Advisors LLC | WPP PLC | JE00B8KF9B49 | 0,51 |
| 2025-07-28 | Marshall Wace LLP | WPP PLC | JE00B8KF9B49 | 0,49 |
| 2025-07-21 | Marshall Wace LLP | WPP PLC | JE00B8KF9B49 | 0,59 |
| 2025-07-17 | Marshall Wace LLP | WPP PLC | JE00B8KF9B49 | 0,66 |
| 2025-07-15 | Marshall Wace LLP | WPP PLC | JE00B8KF9B49 | 0,72 |
| 2025-07-14 | Citadel Advisors LLC | WPP PLC | JE00B8KF9B49 | 0,50 |
| 2025-07-11 | Marshall Wace LLP | WPP PLC | JE00B8KF9B49 | 0,88 |
| 2025-07-09 | Marshall Wace LLP | WPP PLC | JE00B8KF9B49 | 0,90 |
| 2025-07-08 | Marshall Wace LLP | WPP PLC | JE00B8KF9B49 | 0,89 |
| 2025-07-07 | Marshall Wace LLP | WPP PLC | JE00B8KF9B49 | 0,90 |
| 2025-07-02 | Marshall Wace LLP | WPP PLC | JE00B8KF9B49 | 0,89 |
| 2025-06-27 | AQR Capital Management, LLC | WPP PLC | JE00B8KF9B49 | 0,79 |
| 2025-06-26 | Walleye Capital LLC | WPP PLC | JE00B8KF9B49 | 0,45 |
| 2025-06-24 | Marshall Wace LLP | WPP PLC | JE00B8KF9B49 | 0,90 |
| 2025-06-20 | Citadel Advisors LLC | WPP PLC | JE00B8KF9B49 | 0,48 |
| 2025-06-17 | Citadel Advisors LLC | WPP PLC | JE00B8KF9B49 | 0,54 |
| 2025-06-16 | Citadel Advisors LLC | WPP PLC | JE00B8KF9B49 | 0,60 |
| 2025-06-12 | Citadel Advisors LLC | WPP PLC | JE00B8KF9B49 | 0,54 |
| 2025-06-11 | Citadel Advisors LLC | WPP PLC | JE00B8KF9B49 | 0,68 |
| 2025-06-10 | Marshall Wace LLP | WPP PLC | JE00B8KF9B49 | 0,71 |
| 2025-06-09 | BlackRock Investment Management (UK) Limited | WPP PLC | JE00B8KF9B49 | 0,80 |
| 2025-06-03 | BlackRock Investment Management (UK) Limited | WPP PLC | JE00B8KF9B49 | 0,71 |
| 2025-06-02 | Marshall Wace LLP | WPP PLC | JE00B8KF9B49 | 0,61 |
| 2025-05-15 | Marshall Wace LLP | WPP PLC | JE00B8KF9B49 | 0,51 |
| 2025-05-14 | Walleye Capital LLC | WPP PLC | JE00B8KF9B49 | 0,50 |
| 2025-04-29 | Marshall Wace LLP | WPP PLC | JE00B8KF9B49 | 0,50 |
| 2025-04-25 | AQR Capital Management, LLC | WPP PLC | JE00B8KF9B49 | 0,80 |
| 2025-04-23 | AQR Capital Management, LLC | WPP PLC | JE00B8KF9B49 | 0,79 |
| 2025-04-11 | Marshall Wace LLP | WPP PLC | JE00B8KF9B49 | 0,49 |
| 2025-03-14 | Marshall Wace LLP | WPP PLC | JE00B8KF9B49 | 0,50 |
| 2025-03-05 | BlackRock Investment Management (UK) Limited | WPP PLC | JE00B8KF9B49 | 0,64 |
| 2025-01-30 | Marshall Wace LLP | WPP PLC | JE00B8KF9B49 | 0,48 |
| 2025-01-08 | Marshall Wace LLP | WPP PLC | JE00B8KF9B49 | 0,51 |
| 2024-12-12 | AQR Capital Management, LLC | WPP PLC | JE00B8KF9B49 | 0,89 |
| 2024-12-09 | Marshall Wace LLP | WPP PLC | JE00B8KF9B49 | 0,44 |
| 2024-12-06 | AQR Capital Management, LLC | WPP PLC | JE00B8KF9B49 | 0,90 |
| 2024-12-03 | Marshall Wace LLP | WPP PLC | JE00B8KF9B49 | 0,51 |
| 2024-12-02 | Marshall Wace LLP | WPP PLC | JE00B8KF9B49 | 0,49 |
| 2024-11-25 | Marshall Wace LLP | WPP PLC | JE00B8KF9B49 | 0,56 |
| 2024-11-14 | Marshall Wace LLP | WPP PLC | JE00B8KF9B49 | 0,67 |
| 2024-11-04 | AQR Capital Management, LLC | WPP PLC | JE00B8KF9B49 | 0,80 |
| 2024-10-17 | Marshall Wace LLP | WPP PLC | JE00B8KF9B49 | 0,70 |
| 2024-10-08 | AQR Capital Management, LLC | WPP PLC | JE00B8KF9B49 | 0,70 |
| 2024-10-03 | Marshall Wace LLP | WPP PLC | JE00B8KF9B49 | 0,61 |
| 2024-09-26 | Marshall Wace LLP | WPP PLC | JE00B8KF9B49 | 0,50 |
| 2024-09-17 | AQR Capital Management, LLC | WPP PLC | JE00B8KF9B49 | 0,60 |
| 2024-08-29 | AQR Capital Management, LLC | WPP PLC | JE00B8KF9B49 | 0,50 |
| 2024-07-29 | Marshall Wace LLP | WPP PLC | JE00B8KF9B49 | 0,49 |
| 2024-07-11 | Marshall Wace LLP | WPP PLC | JE00B8KF9B49 | 0,59 |
| 2024-06-25 | Marshall Wace LLP | WPP PLC | JE00B8KF9B49 | 0,69 |
| 2024-06-06 | Marshall Wace LLP | WPP PLC | JE00B8KF9B49 | 0,79 |
| 2024-06-03 | Marshall Wace LLP | WPP PLC | JE00B8KF9B49 | 0,80 |
| 2024-05-29 | Marshall Wace LLP | WPP PLC | JE00B8KF9B49 | 0,72 |
| 2024-05-13 | Marshall Wace LLP | WPP PLC | JE00B8KF9B49 | 0,98 |
| 2024-05-02 | Marshall Wace LLP | WPP PLC | JE00B8KF9B49 | 1,00 |
| 2024-04-30 | Marshall Wace LLP | WPP PLC | JE00B8KF9B49 | 0,99 |
| 2024-04-18 | Marshall Wace LLP | WPP PLC | JE00B8KF9B49 | 1,00 |
| 2024-04-10 | Marshall Wace LLP | WPP PLC | JE00B8KF9B49 | 0,90 |
| 2024-03-21 | Marshall Wace LLP | WPP PLC | JE00B8KF9B49 | 0,80 |
| 2024-02-28 | Marshall Wace LLP | WPP PLC | JE00B8KF9B49 | 0,79 |
| 2024-02-20 | Marshall Wace LLP | WPP PLC | JE00B8KF9B49 | 0,80 |
| 2024-02-16 | Marshall Wace LLP | WPP PLC | JE00B8KF9B49 | 0,79 |
| 2024-02-15 | Marshall Wace LLP | WPP PLC | JE00B8KF9B49 | 0,80 |
| 2024-02-13 | Marshall Wace LLP | WPP PLC | JE00B8KF9B49 | 0,79 |
| 2024-02-12 | Marshall Wace LLP | WPP PLC | JE00B8KF9B49 | 0,80 |
| 2024-01-26 | Marshall Wace LLP | WPP PLC | JE00B8KF9B49 | 0,70 |
| 2024-01-16 | Marshall Wace LLP | WPP PLC | JE00B8KF9B49 | 0,61 |
| 2023-12-28 | Marshall Wace LLP | WPP PLC | JE00B8KF9B49 | 0,59 |
| 2023-11-08 | Marshall Wace LLP | WPP PLC | JE00B8KF9B49 | 0,69 |
| 2023-10-27 | Marshall Wace LLP | WPP PLC | JE00B8KF9B49 | 0,78 |
| 2023-10-26 | Marshall Wace LLP | WPP PLC | JE00B8KF9B49 | 0,80 |
| 2023-10-11 | Marshall Wace LLP | WPP PLC | JE00B8KF9B49 | 0,70 |
| 2023-09-28 | Marshall Wace LLP | WPP PLC | JE00B8KF9B49 | 0,60 |
| 2023-09-21 | Marshall Wace LLP | WPP PLC | JE00B8KF9B49 | 0,50 |
| 2023-03-09 | Marshall Wace LLP | WPP PLC | JE00B8KF9B49 | 0,48 |
| 2023-02-23 | Marshall Wace LLP | WPP PLC | JE00B8KF9B49 | 0,59 |
| 2023-02-02 | Marshall Wace LLP | WPP PLC | JE00B8KF9B49 | 0,67 |
| 2023-01-18 | Marshall Wace LLP | WPP PLC | JE00B8KF9B49 | 0,79 |
| 2023-01-10 | Marshall Wace LLP | WPP PLC | JE00B8KF9B49 | 0,80 |
| 2022-12-13 | Marshall Wace LLP | WPP PLC | JE00B8KF9B49 | 0,79 |
| 2022-10-25 | Marshall Wace LLP | WPP PLC | JE00B8KF9B49 | 0,88 |
| 2022-09-23 | Marshall Wace LLP | WPP PLC | JE00B8KF9B49 | 0,90 |
| 2022-09-12 | Marshall Wace LLP | WPP PLC | JE00B8KF9B49 | 0,89 |
| 2022-08-18 | Marshall Wace LLP | WPP PLC | JE00B8KF9B49 | 0,92 |
| 2022-08-12 | Marshall Wace LLP | WPP PLC | JE00B8KF9B49 | 0,80 |
| 2022-07-27 | Marshall Wace LLP | WPP PLC | JE00B8KF9B49 | 0,70 |
| 2022-07-22 | Marshall Wace LLP | WPP PLC | JE00B8KF9B49 | 0,69 |
| 2022-07-18 | Marshall Wace LLP | WPP PLC | JE00B8KF9B49 | 0,79 |
| 2022-07-05 | Marshall Wace LLP | WPP PLC | JE00B8KF9B49 | 0,84 |
| 2022-06-30 | Marshall Wace LLP | WPP PLC | JE00B8KF9B49 | 0,79 |
| 2022-06-17 | Marshall Wace LLP | WPP PLC | JE00B8KF9B49 | 0,89 |
| 2022-06-08 | BlackRock Investment Management (UK) Limited | WPP PLC | JE00B8KF9B49 | 0,39 |
| 2022-06-07 | BlackRock Investment Management (UK) Limited | WPP PLC | JE00B8KF9B49 | 0,50 |
| 2022-05-11 | Marshall Wace LLP | WPP PLC | JE00B8KF9B49 | 0,90 |
| 2022-03-30 | Marshall Wace LLP | WPP PLC | JE00B8KF9B49 | 0,82 |
| 2022-03-29 | Marshall Wace LLP | WPP PLC | JE00B8KF9B49 | 0,79 |
| 2022-03-28 | Marshall Wace LLP | WPP PLC | JE00B8KF9B49 | 0,80 |
| 2022-03-18 | Marshall Wace LLP | WPP PLC | JE00B8KF9B49 | 0,78 |
| 2022-03-09 | Marshall Wace LLP | WPP PLC | JE00B8KF9B49 | 0,80 |
| 2022-01-28 | Marshall Wace LLP | WPP PLC | JE00B8KF9B49 | 0,70 |
| 2021-11-26 | Marshall Wace LLP | WPP PLC | JE00B8KF9B49 | 0,60 |
| 2021-11-09 | Marshall Wace LLP | WPP PLC | JE00B8KF9B49 | 0,50 |
| 2021-10-28 | Marshall Wace LLP | WPP PLC | JE00B8KF9B49 | 0,48 |
| 2021-09-24 | Marshall Wace LLP | WPP PLC | JE00B8KF9B49 | 0,50 |
| 2018-11-13 | Marshall Wace LLP | WPP PLC | JE00B8KF9B49 | 0,46 |
| 2018-11-07 | Marshall Wace LLP | WPP PLC | JE00B8KF9B49 | 0,57 |
| 2018-11-05 | Marshall Wace LLP | WPP PLC | JE00B8KF9B49 | 0,66 |
| 2018-10-31 | Jupiter Investment Management Limited | WPP PLC | JE00B8KF9B49 | 0,38 |
| 2018-10-29 | Marshall Wace LLP | WPP PLC | JE00B8KF9B49 | 0,80 |
| 2018-10-25 | Marshall Wace LLP | WPP PLC | JE00B8KF9B49 | 0,77 |
| 2018-10-23 | Jupiter Investment Management Limited | WPP PLC | JE00B8KF9B49 | 0,57 |
| 2018-10-19 | Lone Pine Capital LLC | WPP PLC | JE00B8KF9B49 | 0,00 |
| 2018-10-18 | Jupiter Investment Management Limited | WPP PLC | JE00B8KF9B49 | 0,68 |
| 2018-10-12 | Marshall Wace LLP | WPP PLC | JE00B8KF9B49 | 0,70 |
| 2018-10-10 | Marshall Wace LLP | WPP PLC | JE00B8KF9B49 | 0,61 |
| 2018-10-05 | Jupiter Investment Management Limited | WPP PLC | JE00B8KF9B49 | 0,78 |
| 2018-09-17 | Marshall Wace LLP | WPP PLC | JE00B8KF9B49 | 0,50 |
| 2018-09-04 | Lone Pine Capital LLC | WPP PLC | JE00B8KF9B49 | 0,51 |
| 2018-08-31 | Lone Pine Capital LLC | WPP PLC | JE00B8KF9B49 | 0,49 |
| 2018-08-16 | Marshall Wace LLP | WPP PLC | JE00B8KF9B49 | 0,49 |
| 2018-08-07 | Marshall Wace LLP | WPP PLC | JE00B8KF9B49 | 0,58 |
| 2018-07-31 | Marshall Wace LLP | WPP PLC | JE00B8KF9B49 | 0,60 |
| 2018-07-24 | Jupiter Investment Management Limited | WPP PLC | JE00B8KF9B49 | 0,88 |
| 2018-07-23 | Jupiter Investment Management Limited | WPP PLC | JE00B8KF9B49 | 0,90 |
| 2018-07-18 | Lone Pine Capital LLC | WPP PLC | JE00B8KF9B49 | 0,54 |
| 2018-07-13 | Marshall Wace LLP | WPP PLC | JE00B8KF9B49 | 0,58 |
| 2018-07-03 | Marshall Wace LLP | WPP PLC | JE00B8KF9B49 | 0,67 |
| 2018-06-12 | Marshall Wace LLP | WPP PLC | JE00B8KF9B49 | 0,78 |
| 2018-06-08 | Marshall Wace LLP | WPP PLC | JE00B8KF9B49 | 0,80 |
| 2018-05-30 | Jupiter Investment Management Limited | WPP PLC | JE00B8KF9B49 | 0,80 |
| 2018-05-24 | Marshall Wace LLP | WPP PLC | JE00B8KF9B49 | 0,71 |
| 2018-05-23 | Marshall Wace LLP | WPP PLC | JE00B8KF9B49 | 0,66 |
| 2018-05-08 | Jupiter Investment Management Limited | WPP PLC | JE00B8KF9B49 | 0,70 |
| 2018-05-01 | Jupiter Investment Management Limited | WPP PLC | JE00B8KF9B49 | 0,61 |
| 2018-04-30 | Marshall Wace LLP | WPP PLC | JE00B8KF9B49 | 0,57 |
| 2018-04-27 | Marshall Wace LLP | WPP PLC | JE00B8KF9B49 | 0,67 |
| 2018-04-16 | Marshall Wace LLP | WPP PLC | JE00B8KF9B49 | 0,75 |
| 2018-04-11 | Jupiter Investment Management Limited | WPP PLC | JE00B8KF9B49 | 0,51 |
| 2018-04-09 | Marshall Wace LLP | WPP PLC | JE00B8KF9B49 | 0,63 |
| 2018-03-23 | Marshall Wace LLP | WPP PLC | JE00B8KF9B49 | 0,58 |
| 2018-03-19 | Marshall Wace LLP | WPP PLC | JE00B8KF9B49 | 0,67 |
| 2018-03-15 | Marshall Wace LLP | WPP PLC | JE00B8KF9B49 | 0,77 |
| 2018-03-08 | Marshall Wace LLP | WPP PLC | JE00B8KF9B49 | 0,88 |
| 2018-03-01 | Marshall Wace LLP | WPP PLC | JE00B8KF9B49 | 0,99 |
| 2018-02-15 | Marshall Wace LLP | WPP PLC | JE00B8KF9B49 | 1,06 |
| 2018-02-12 | Marshall Wace LLP | WPP PLC | JE00B8KF9B49 | 1,19 |
| 2018-02-01 | Marshall Wace LLP | WPP PLC | JE00B8KF9B49 | 1,21 |
| 2018-01-26 | Marshall Wace LLP | WPP PLC | JE00B8KF9B49 | 1,13 |
| 2018-01-17 | Marshall Wace LLP | WPP PLC | JE00B8KF9B49 | 1,00 |
| 2017-12-29 | Marshall Wace LLP | WPP PLC | JE00B8KF9B49 | 0,90 |
| 2017-12-18 | Marshall Wace LLP | WPP PLC | JE00B8KF9B49 | 0,82 |
| 2017-12-13 | Marshall Wace LLP | WPP PLC | JE00B8KF9B49 | 0,70 |
| 2017-12-01 | Marshall Wace LLP | WPP PLC | JE00B8KF9B49 | 0,61 |
| 2017-11-22 | Lone Pine Capital LLC | WPP PLC | JE00B8KF9B49 | 0,44 |
| 2017-11-13 | Marshall Wace LLP | WPP PLC | JE00B8KF9B49 | 0,51 |
| 2017-10-30 | Marshall Wace LLP | WPP PLC | JE00B8KF9B49 | 0,48 |
| 2017-10-27 | Marshall Wace LLP | WPP PLC | JE00B8KF9B49 | 0,50 |
| 2017-09-19 | Lone Pine Capital LLC | WPP PLC | JE00B8KF9B49 | 0,51 |
| 2015-02-19 | Carmignac Gestion | WPP PLC | JE00B8KF9B49 | 0,48 |
| 2015-02-18 | Carmignac Gestion | WPP PLC | JE00B8KF9B49 | 0,55 |
| 2015-01-14 | Carmignac Gestion | WPP PLC | JE00B8KF9B49 | 0,72 |
| 2015-01-08 | Carmignac Gestion | WPP PLC | JE00B8KF9B49 | 0,69 |
| 2014-12-31 | Carmignac Gestion | WPP PLC | JE00B8KF9B49 | 0,70 |
| 2014-12-26 | Carmignac Gestion | WPP PLC | JE00B8KF9B49 | 0,60 |
| 2014-12-24 | Carmignac Gestion | WPP PLC | JE00B8KF9B49 | 0,70 |
| 2014-12-22 | Carmignac Gestion | WPP PLC | JE00B8KF9B49 | 0,63 |
| 2013-05-29 | Susquehanna International Holdings LLC | WPP PLC | JE00B8KF9B49 | 0,00 |
| 2013-05-24 | D. E. Shaw & Co. (London), LLP | WPP PLC | JE00B8KF9B49 | 0,14 |
| 2013-04-08 | D. E. Shaw & Co. (London), LLP | WPP PLC | JE00B8KF9B49 | 1,23 |
| 2013-02-14 | Susquehanna International Holdings LLC | WPP PLC | JE00B8KF9B49 | 0,62 |
| 2013-02-13 | D. E. Shaw & Co. (U.K.), Ltd. | WPP PLC | JE00B8KF9B49 | 1,23 |
| 2013-01-30 | D. E. Shaw & Co. (U.K.), Ltd. | WPP PLC | JE00B8KF9B49 | 1,14 |
| 2013-01-17 | D. E. Shaw & Co. (U.K.), Ltd. | WPP PLC | JE00B8KF9B49 | 0,91 |
| 2013-01-16 | D. E. Shaw & Co. (U.K.), Ltd. | WPP PLC | JE00B8KF9B49 | 0,80 |
| 2013-01-11 | D. E. Shaw & Co. (U.K.), Ltd. | WPP PLC | JE00B8KF9B49 | 0,72 |
| 2012-12-12 | Susquehanna International Holdings LLC | WPP PLC | JE00B8KF9B49 | 0,50 |
| 2012-11-30 | Susquehanna International Holdings LLC | WPP PLC | JE00B8KF9B49 | 0,48 |
| 2012-11-28 | Susquehanna International Holdings LLC | WPP PLC | JE00B8KF9B49 | 0,50 |
| 2012-11-01 | D. E. Shaw & Co. (U.K.), Ltd. | WPP PLC | JE00B8KF9B49 | 0,64 |