Grunnleggende statistikk
| Institusjonelle eiere | 148 total, 148 long only, 0 short only, 0 long/short - change of 12,88% MRQ |
| Gjennomsnittlig porteføljeallokering | 0.1798 % - change of −5,12% MRQ |
| Institusjonelle aksjer (Long) | 6 065 021 (ex 13D/G) - change of 1,45MM shares 31,54% MRQ |
| Institusjonell verdi (Long) | $ 364 095 USD ($1000) |
Institusjonelt eierskap og aksjonærer
The RBB Fund, Inc. - Motley Fool 100 Index ETF (US:TMFC) har 148 institusjonelle eiere og aksjonærer som har sendt inn 13D/G- eller 13F-skjemaer til Securities Exchange Commission (SEC). Disse institusjonene eier til sammen 6,065,021 aksjer. De største aksjonærene inkluderer Amplius Wealth Advisors, LLC, LPL Financial LLC, Raymond James Financial Inc, Portfolio Strategies, Inc., Private Advisor Group, LLC, Royal Bank Of Canada, Cambridge Investment Research Advisors, Inc., Wells Fargo & Company/mn, Advisor Group Holdings, Inc., and Two Sigma Investments, Lp .
The RBB Fund, Inc. - Motley Fool 100 Index ETF (BATS:TMFC) institusjonell eierstruktur viser nåværende posisjoner i selskapet fordelt på institusjoner og fond, samt de siste endringene i posisjonsstørrelse. De største aksjonærene kan være individuelle investorer, verdipapirfond, hedgefond eller institusjoner. Schedule 13D indikerer at investoren eier (eller har eid) mer enn 5 % av selskapet og har til hensikt (eller hadde til hensikt) å aktivt forfølge en endring i forretningsstrategien. Schedule 13G indikerer en passiv investering på over 5 %.
The share price as of September 9, 2025 is 68,52 / share. Previously, on September 10, 2024, the share price was 53,39 / share. This represents an increase of 28,34% over that period.

Fondssentiment-score
Fondssentiment Score (også kjent som akkumulering av eierskap poengsum) viser hvilke aksjer som er mest kjøpt av fond. Den er resultatet av en sofistikert, kvantitativ flerfaktormodell som identifiserer selskaper med de høyeste nivåene av institusjonell akkumulering. Beregningsmodellen for poeng bruker en kombinasjon av den totale økningen i antall offentliggjorte eiere, endringer i porteføljeallokeringen til disse eierne og andre beregninger. Tallet går fra 0 til 100, der høyere tall indikerer en høyere grad av akkumulering i forhold til sammenlignbare selskaper, der 50 er gjennomsnittet.
Oppdateringsfrekvens: Daglig
Sjekk ut Ownership Explorer, som inneholder en liste over de høyest rangerte selskapene.
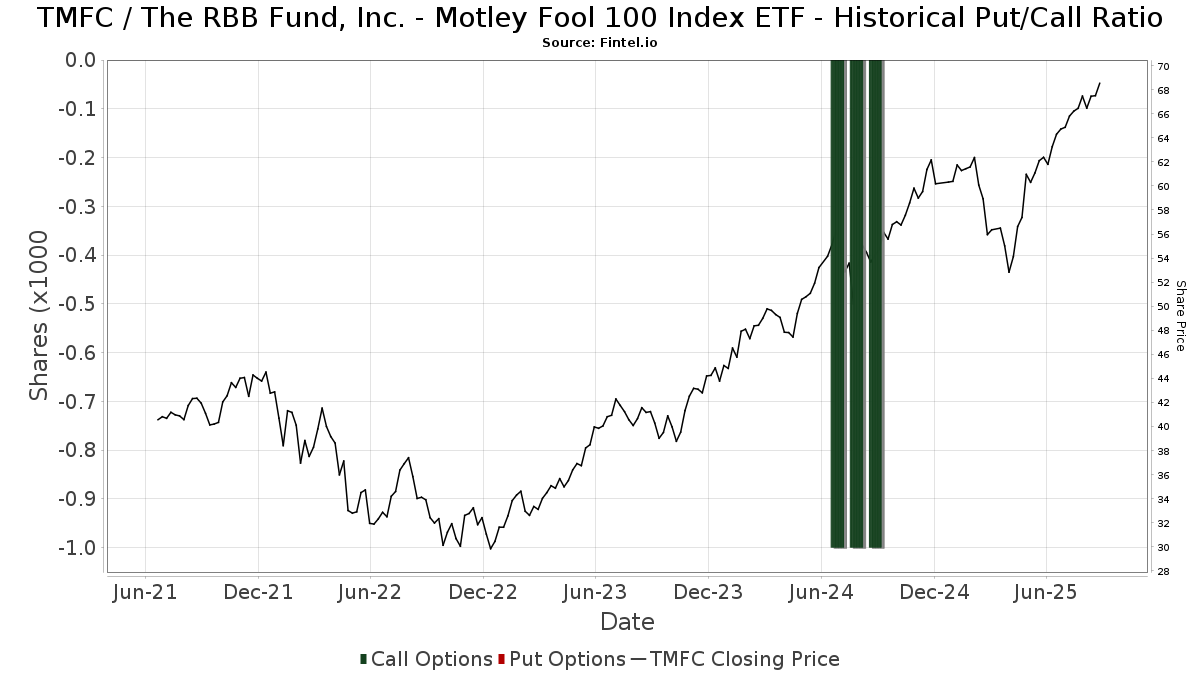
Institusjonell Put/Call-forhold
I tillegg til å rapportere standard aksje- og gjeldsemisjoner må institusjoner med mer enn 100 millioner kroner i forvaltningskapital også oppgi beholdningen av put- og callopsjoner. Siden put-opsjoner generelt indikerer et negativt sentiment, og call-opsjoner indikerer et positivt sentiment, kan vi få et inntrykk av det generelle institusjonelle sentimentet ved å plotte forholdet mellom put- og call-opsjoner. Diagrammet til høyre viser det historiske forholdet mellom put- og call-opsjoner for dette instrumentet.
Ved å bruke Put/Call-forholdet som en indikator på investorsentimentet kan man overvinne en av de viktigste svakhetene ved å bruke totalt institusjonelt eierskap, nemlig at en betydelig andel av forvaltningskapitalen investeres passivt for å følge indekser. Passivt forvaltede fond kjøper vanligvis ikke opsjoner, slik at indikatoren for put/call-forhold i større grad gjenspeiler stemningen i aktivt forvaltede fond.
13F- og NPORT-arkiveringer
Detaljer om 13F-arkiveringer er gratis. Detaljer om NP-arkiveringer krever et premium-medlemskap. Grønne rader indikerer nye posisjoner. Røde rader indikerer lukkede posisjoner. Klikk på lenke ikonet for å se hele transaksjonshistorikken.
Oppgrader
for å låse opp premiedata og eksportere til Excel. ![]() .
.
| Fildato | Kilde | Investor | Type | Gjennomsnittlig pris (estimert) |
Aksjer | Δ Aksjer (%) |
Rapportert verdi ($1000) | Verdi (%) | Portallokering (%) | |
|---|---|---|---|---|---|---|---|---|---|---|
| 2025-08-14 | 13F | Atomi Financial Group, Inc. | 14 461 | 12,21 | 933 | 30,17 | ||||
| 2025-08-14 | 13F | Wells Fargo & Company/mn | 286 630 | 1,42 | 18 491 | 17,63 | ||||
| 2025-07-18 | 13F | Bartlett & Co. Wealth Management Llc | 400 | 0,00 | 26 | 13,64 | ||||
| 2025-08-05 | 13F | Corps Capital Advisors, LLC | 6 698 | 6,61 | 432 | 23,78 | ||||
| 2025-08-12 | 13F | J.w. Cole Advisors, Inc. | 5 041 | 9,90 | 325 | 27,45 | ||||
| 2025-08-11 | 13F | Advisor Resource Council | 0 | −100,00 | 0 | |||||
| 2025-07-30 | 13F | Whittier Trust Co | 15 | 0,00 | 1 | |||||
| 2025-08-12 | 13F | CIBC Private Wealth Group, LLC | 1 000 | 0,00 | 65 | 30,61 | ||||
| 2025-08-14 | 13F | Federation des caisses Desjardins du Quebec | 1 390 | 0,00 | 90 | 15,58 | ||||
| 2025-08-18 | 13F | Tyler-Stone Wealth Management | 3 176 | 205 | ||||||
| 2025-07-23 | 13F | Nbt Bank N A /ny | 500 | 0,00 | 32 | 18,52 | ||||
| 2025-07-16 | 13F | Perigon Wealth Management, LLC | 12 663 | 2,01 | 817 | 18,26 | ||||
| 2025-08-12 | 13F | LPL Financial LLC | 790 191 | 18,88 | 50 975 | 37,89 | ||||
| 2025-08-14 | 13F | Bank Of America Corp /de/ | 50 | 0,00 | 3 | 50,00 | ||||
| 2025-08-13 | 13F | Northwestern Mutual Wealth Management Co | 27 670 | 278,52 | 1 785 | 339,41 | ||||
| 2025-08-18 | 13F | Geneos Wealth Management Inc. | 100 | 0,00 | 6 | 20,00 | ||||
| 2025-08-11 | 13F | Aptus Capital Advisors, LLC | 297 | 0,00 | 19 | 18,75 | ||||
| 2025-08-11 | 13F | Mill Creek Capital Advisors, LLC | 3 653 | 0,00 | 236 | 15,76 | ||||
| 2025-07-29 | 13F | Elevation Capital Advisory, LLC | 47 765 | 9,83 | 3 081 | 27,42 | ||||
| 2025-04-23 | 13F | B.O.S.S. Retirement Advisors, LLC | 0 | −100,00 | 0 | |||||
| 2025-07-30 | 13F | Bogart Wealth, LLC | 8 | 0,00 | 1 | |||||
| 2025-07-30 | 13F | Pittenger & Anderson Inc | 150 | 0,00 | 10 | 12,50 | ||||
| 2025-08-27 | 13F/A | Brinker Capital Investments, LLC | 4 035 | −19,41 | 260 | −6,47 | ||||
| 2025-08-14 | 13F | Two Sigma Investments, Lp | 108 400 | 6 993 | ||||||
| 2025-07-11 | 13F | Farther Finance Advisors, LLC | 403 | 71,49 | 26 | 100,00 | ||||
| 2025-07-25 | 13F | Concurrent Investment Advisors, LLC | 7 700 | 5,18 | 497 | 21,87 | ||||
| 2025-07-16 | 13F | Signaturefd, Llc | 17 | 1 | ||||||
| 2025-08-13 | 13F | RIA Advisory Group LLC | 12 756 | 823 | ||||||
| 2025-08-14 | 13F | Old Mission Capital Llc | 0 | −100,00 | 0 | |||||
| 2025-05-09 | 13F | GeoWealth Management, LLC | 0 | −100,00 | 0 | −100,00 | ||||
| 2025-05-15 | 13F/A | Orion Portfolio Solutions, LLC | 5 007 | 278 | ||||||
| 2025-08-11 | 13F | Private Advisor Group, LLC | 381 122 | 1 219,49 | 24 586 | 1 430,88 | ||||
| 2025-07-22 | 13F | DAVENPORT & Co LLC | 15 875 | 1,28 | 1 024 | 17,57 | ||||
| 2025-08-12 | 13F | Proequities, Inc. | 0 | 0 | ||||||
| 2025-08-12 | 13F | Global Retirement Partners, LLC | 1 350 | 0,00 | 87 | 7,41 | ||||
| 2025-07-10 | 13F | Wealth Enhancement Advisory Services, Llc | 8 641 | 26,18 | 561 | 47,37 | ||||
| 2025-07-31 | 13F | Cambridge Investment Research Advisors, Inc. | 299 710 | 7,70 | 19 | 26,67 | ||||
| 2025-08-13 | 13F | Keystone Financial Group | 10 713 | −2,43 | 691 | 13,28 | ||||
| 2025-08-14 | 13F | Royal Bank Of Canada | 316 323 | 98,69 | 20 406 | 130,42 | ||||
| 2025-07-09 | 13F | Lbmc Investment Advisors, Llc | 3 364 | 217 | ||||||
| 2025-08-12 | 13F | Integrated Advisors Network LLC | 3 842 | 248 | ||||||
| 2025-07-31 | 13F | Wealthfront Advisers Llc | 60 436 | 2,10 | 3 899 | 18,41 | ||||
| 2025-04-21 | 13F | Nelson, Van Denburg & Campbell Wealth Management Group, LLC | 0 | −100,00 | 0 | |||||
| 2025-08-08 | 13F | Gts Securities Llc | 38 952 | 2 513 | ||||||
| 2025-05-28 | NP | TFAFX - Tactical Growth Allocation Fund Class I | 0 | −100,00 | 0 | −100,00 | ||||
| 2025-07-30 | 13F | Cullen/frost Bankers, Inc. | 181 | 0,00 | 12 | 10,00 | ||||
| 2025-07-30 | 13F | D.a. Davidson & Co. | 3 550 | 229 | ||||||
| 2025-08-14 | 13F | IHT Wealth Management, LLC | 86 500 | 1,23 | 5 580 | 17,42 | ||||
| 2025-07-02 | 13F | Howard Financial Services, Ltd. | 4 969 | 0,00 | 321 | 15,94 | ||||
| 2025-08-19 | 13F | Newbridge Financial Services Group, Inc. | 14 633 | 2 826,60 | 944 | 3 392,59 | ||||
| 2025-04-14 | 13F | Lloyd Advisory Services, LLC. | 0 | −100,00 | 0 | |||||
| 2025-07-07 | 13F | Bangor Savings Bank | 127 | 8 | ||||||
| 2025-08-12 | 13F | Archer Investment Corp | 100 | 6 | ||||||
| 2025-08-18 | 13F | N.E.W. Advisory Services LLC | 26 | 0,00 | 2 | 0,00 | ||||
| 2025-08-12 | 13F | Calton & Associates, Inc. | 24 818 | −3,48 | 1 601 | 11,96 | ||||
| 2025-07-07 | 13F | TruWealth Advisors, LLC | 3 302 | 213 | ||||||
| 2025-08-12 | 13F | MAI Capital Management | 265 | 32,50 | 17 | 54,55 | ||||
| 2025-05-01 | 13F | Quest 10 Wealth Builders, Inc. | 0 | −100,00 | 0 | |||||
| 2025-08-13 | 13F | Marshall Wace, Llp | 8 664 | 559 | ||||||
| 2025-08-14 | 13F | Jane Street Group, Llc | 0 | −100,00 | 0 | |||||
| 2025-07-30 | 13F | Avidian Wealth Solutions, LLC | 28 349 | 0,60 | 1 829 | 16,66 | ||||
| 2025-08-05 | 13F | Key FInancial Inc | 15 | 0,00 | 1 | |||||
| 2025-05-05 | 13F | Transce3nd, LLC | 0 | −100,00 | 0 | |||||
| 2025-07-21 | 13F | Ameritas Advisory Services, LLC | 424 | 27 | ||||||
| 2025-08-12 | 13F | Jpmorgan Chase & Co | 250 | 150,00 | 16 | 220,00 | ||||
| 2025-08-07 | 13F | Sound View Wealth Advisors Group, LLC | 17 388 | 8,44 | 1 122 | 25,81 | ||||
| 2025-08-11 | 13F | Pineridge Advisors LLC | 0 | −100,00 | 0 | |||||
| 2025-08-11 | 13F | HighTower Advisors, LLC | 14 021 | 0,16 | 905 | 16,20 | ||||
| 2025-08-08 | 13F | Creative Planning | 20 785 | −0,65 | 1 341 | 15,22 | ||||
| 2025-08-14 | 13F | Planwiser Financial, Llc | 21 918 | −1,92 | 1 457 | 13,57 | ||||
| 2025-07-24 | 13F | Us Bancorp \de\ | 738 | 0,00 | 48 | 14,63 | ||||
| 2025-05-05 | 13F | Lindbrook Capital, Llc | 1 389 | 55,54 | 77 | 45,28 | ||||
| 2025-07-25 | 13F | Almanack Investment Partners, LLC. | 5 665 | 33,20 | 365 | 54,66 | ||||
| 2025-07-11 | 13F | SILVER OAK SECURITIES, Inc | 0 | −100,00 | 0 | |||||
| 2025-08-08 | 13F | Glassman Wealth Services | 5 990 | 0,00 | 386 | 15,92 | ||||
| 2025-06-10 | 13F | Birchbrook, Inc. | 0 | −100,00 | 0 | −100,00 | ||||
| 2025-07-29 | 13F | Koshinski Asset Management, Inc. | 2 366 | 4,28 | 1 365 | 6,31 | ||||
| 2025-08-11 | 13F | TRUE Private Wealth Advisors | 6 561 | 423 | ||||||
| 2025-08-14 | 13F | Stifel Financial Corp | 46 548 | 83,57 | 3 003 | 112,91 | ||||
| 2025-04-22 | 13F | Synergy Financial Management, LLC | 0 | −100,00 | 0 | |||||
| 2025-08-08 | 13F | Wiser Advisor Group LLC | 0 | −100,00 | 0 | |||||
| 2025-04-23 | 13F | Mascagni Wealth Management, Inc. | 0 | −100,00 | 0 | −100,00 | ||||
| 2025-05-16 | 13F/A | Goldman Sachs Group Inc | 0 | −100,00 | 0 | −100,00 | ||||
| 2025-08-06 | 13F | Aspect Partners, LLC | 8 | −27,27 | 1 | |||||
| 2025-07-31 | 13F | Carrera Capital Advisors | 5 592 | 0,00 | 361 | 15,76 | ||||
| 2025-08-12 | 13F | AlphaCore Capital LLC | 4 890 | 315 | ||||||
| 2025-05-02 | 13F | Cable Hill Partners, LLC | 5 825 | −29,82 | 330 | −33,94 | ||||
| 2025-08-11 | 13F | Strategic Wealth Partners, Ltd. | 235 | 15 | ||||||
| 2025-08-14 | 13F | Mml Investors Services, Llc | 16 336 | 4,60 | 1 | |||||
| 2025-08-12 | 13F | Richmond Investment Services, LLC | 24 200 | 6,76 | 1 561 | 23,89 | ||||
| 2025-08-01 | 13F | Envestnet Asset Management Inc | 39 276 | 73,35 | 2 534 | 101,03 | ||||
| 2025-08-13 | 13F | Lido Advisors, LLC | 3 201 | −46,18 | 207 | −37,58 | ||||
| 2025-08-14 | 13F | GWM Advisors LLC | 604 | 179,63 | 39 | 216,67 | ||||
| 2025-07-29 | 13F | Dale Q Rice Investment Management Ltd | 24 690 | −48,77 | 1 602 | −40,26 | ||||
| 2025-08-06 | 13F | AE Wealth Management LLC | 16 030 | 201,26 | 1 034 | 250,51 | ||||
| 2025-07-10 | 13F | Capital Advisory Group Advisory Services, LLC | 61 012 | 17,42 | 3 936 | 36,16 | ||||
| 2025-07-14 | 13F | Signature Securities Group Corporation | 0 | −100,00 | 0 | |||||
| 2025-08-08 | 13F | Avantax Advisory Services, Inc. | 3 702 | −7,50 | 239 | 7,21 | ||||
| 2025-08-05 | 13F | Huntington National Bank | 6 | 0,00 | ||||||
| 2025-08-08 | 13F | Cetera Investment Advisers | 64 953 | 30,25 | 4 190 | 51,10 | ||||
| 2025-07-24 | 13F | IFP Advisors, Inc | 4 254 | 261,73 | 274 | 321,54 | ||||
| 2025-08-12 | 13F | SRS Capital Advisors, Inc. | 6 888 | 0,00 | 444 | 15,93 | ||||
| 2025-08-15 | 13F | Equitable Holdings, Inc. | 15 187 | −3,33 | 980 | 12,14 | ||||
| 2025-07-25 | 13F | Envestnet Portfolio Solutions, Inc. | 14 419 | 91,03 | 930 | 121,96 | ||||
| 2025-08-19 | 13F | Asset Dedication, LLC | 318 | 0,00 | 21 | 17,65 | ||||
| 2025-08-12 | 13F | Steward Partners Investment Advisory, Llc | 578 | 0,00 | 37 | 15,63 | ||||
| 2025-07-15 | 13F | Armis Advisers, LLC | 5 996 | −0,08 | 386 | 13,86 | ||||
| 2025-08-04 | 13F | Amplius Wealth Advisors, LLC | 873 033 | −3,16 | 56 315 | 12,30 | ||||
| 2025-07-25 | 13F | Cwm, Llc | 200 | −44,29 | 0 | |||||
| 2025-08-04 | 13F | Assetmark, Inc | 3 | 0,00 | 0 | |||||
| 2025-08-14 | 13F | Fmr Llc | 18 827 | 2,44 | 1 215 | 18,79 | ||||
| 2025-08-08 | 13F | Flaharty Asset Management, LLC | 0 | −100,00 | 0 | |||||
| 2025-08-14 | 13F | Susquehanna International Group, Llp | 0 | −100,00 | 0 | |||||
| 2025-08-04 | 13F | Spire Wealth Management | 9 511 | 1 429,10 | 614 | 1 702,94 | ||||
| 2025-08-14 | 13F | LaSalle St. Investment Advisors, LLC | 11 671 | 1 | ||||||
| 2025-08-07 | 13F | Parkside Financial Bank & Trust | 1 123 | 72 | ||||||
| 2025-08-11 | 13F | Brown Brothers Harriman & Co | 2 950 | 18,00 | 190 | 36,69 | ||||
| 2025-07-17 | 13F | Sound Income Strategies, LLC | 879 | 57 | ||||||
| 2025-08-08 | 13F | Larson Financial Group LLC | 44 798 | 25,78 | 2 890 | 45,91 | ||||
| 2025-08-12 | 13F | Coldstream Capital Management Inc | 5 825 | 14 462,50 | 376 | 18 650,00 | ||||
| 2025-07-28 | 13F | Frazier Financial Advisors, LLC | 267 | 17 | ||||||
| 2025-08-14 | 13F | Visionary Wealth Advisors | 56 314 | 17,91 | 3 633 | 36,75 | ||||
| 2025-07-22 | 13F | Berger Financial Group, Inc | 4 440 | −14,60 | 286 | −1,04 | ||||
| 2025-07-30 | 13F | Green Square Capital Advisors Llc | 19 080 | 1 231 | ||||||
| 2025-08-13 | 13F | Cerity Partners LLC | 11 345 | −0,02 | 732 | 15,85 | ||||
| 2025-05-15 | 13F | Concorde Asset Management, LLC | 3 761 | 5,59 | 207 | −3,74 | ||||
| 2025-08-15 | 13F | Synergy Financial Group, LTD | 44 107 | 6,21 | 2 845 | 23,21 | ||||
| 2025-08-05 | 13F | American Capital Advisory, LLC | 132 | 0,00 | 8 | 14,29 | ||||
| 2025-08-08 | 13F | Thoroughbred Financial Services, Llc | 13 742 | 1 | ||||||
| 2025-08-08 | 13F | Foundations Investment Advisors, LLC | 3 453 | 223 | ||||||
| 2025-08-06 | 13F | Rps Advisory Solutions Llc | 0 | −100,00 | 0 | |||||
| 2025-08-05 | 13F | GPS Wealth Strategies Group, LLC | 42 | 0,00 | 3 | 0,00 | ||||
| 2025-05-15 | 13F | Warren Averett Asset Management, LLC | 0 | −100,00 | 0 | |||||
| 2025-08-14 | 13F/A | Barclays Plc | 3 387 | 0,00 | 0 | |||||
| 2025-08-06 | 13F | Commonwealth Equity Services, Llc | 80 165 | 17,99 | 5 | 66,67 | ||||
| 2025-08-14 | 13F | Raymond James Financial Inc | 693 971 | 82,83 | 44 768 | 112,06 | ||||
| 2025-07-08 | 13F | Parallel Advisors, LLC | 268 | 0,00 | 17 | 21,43 | ||||
| 2025-08-11 | 13F | Intrepid Financial Planning Group LLC | 14 727 | 2,36 | 950 | 18,75 | ||||
| 2025-07-08 | 13F | Strategic Advocates LLC | 7 139 | 19,24 | 461 | 38,14 | ||||
| 2025-07-15 | 13F | FLP Wealth Management, LLC | 0 | −100,00 | 0 | |||||
| 2025-08-14 | 13F | Mariner, LLC | 4 716 | 17,52 | 304 | 36,32 | ||||
| 2025-08-14 | 13F | Great Valley Advisor Group, Inc. | 10 262 | 662 | ||||||
| 2025-08-07 | 13F | Allworth Financial LP | 500 | 0,00 | 32 | 18,52 | ||||
| 2025-09-04 | 13F/A | Advisor Group Holdings, Inc. | 119 000 | 107,24 | 7 677 | 140,36 | ||||
| 2025-07-10 | 13F | Wedmont Private Capital | 3 114 | 202 | ||||||
| 2025-07-25 | 13F | Atria Wealth Solutions, Inc. | 89 291 | 40,36 | 5 760 | 62,80 | ||||
| 2025-08-04 | 13F | Creative Financial Designs Inc /adv | 599 | 0,00 | 39 | 15,15 | ||||
| 2025-07-24 | 13F | JNBA Financial Advisors | 125 | 8 | ||||||
| 2025-08-14 | 13F | Marathon Capital Management | 4 126 | 1,23 | 266 | 17,70 | ||||
| 2025-08-15 | 13F | First Heartland Consultants, Inc. | 10 571 | 17,07 | 682 | 35,66 | ||||
| 2025-08-11 | 13F | Principal Securities, Inc. | 670 | 109,38 | 43 | 126,32 | ||||
| 2025-07-17 | 13F | Janney Montgomery Scott LLC | 13 371 | 32,82 | 1 | |||||
| 2025-08-14 | 13F | Wiley Bros.-aintree Capital, Llc | 47 281 | 7,43 | 3 050 | 25,05 | ||||
| 2025-08-14 | 13F | UBS Group AG | 0 | −100,00 | 0 | |||||
| 2025-07-16 | 13F | Strategic Investment Solutions, Inc. /IL | 50 | 3 | ||||||
| 2025-07-28 | 13F | Mutual Advisors, LLC | 33 436 | 45,05 | 2 215 | 70,91 | ||||
| 2025-08-06 | 13F | Prospera Financial Services Inc | 10 874 | 1,29 | 701 | 17,42 | ||||
| 2025-08-18 | 13F | Hollencrest Capital Management | 1 500 | 0,00 | 97 | 15,66 | ||||
| 2025-07-28 | 13F | RFG Advisory, LLC | 7 980 | −15,82 | 515 | −2,47 | ||||
| 2025-08-14 | 13F | CoreCap Advisors, LLC | 9 071 | −1,90 | 585 | 13,81 | ||||
| 2025-07-08 | 13F | Goldstone Financial Group, LLC | 3 569 | −2,59 | 232 | 13,79 | ||||
| 2025-07-28 | 13F | Harbour Investments, Inc. | 5 415 | 10,20 | 349 | 27,84 | ||||
| 2025-08-11 | 13F | Lowe Brockenbrough & Co Inc | 5 900 | 0,00 | 381 | 15,85 | ||||
| 2025-08-12 | 13F | Titleist Asset Management, Llc | 17 212 | 0,40 | 1 110 | 16,47 | ||||
| 2025-08-15 | 13F | Captrust Financial Advisors | 5 623 | 0,00 | 363 | 16,03 | ||||
| 2025-08-11 | 13F | Western Wealth Management, LLC | 18 639 | 1 202 | ||||||
| 2025-08-05 | 13F | Bank Of Montreal /can/ | 1 100 | 0,00 | 71 | 14,75 | ||||
| 2025-07-17 | 13F | Walker Asset Management, LLC | 71 432 | 9,52 | 4 608 | 27,05 | ||||
| 2025-07-21 | 13F | Portfolio Strategies, Inc. | 439 867 | 9,50 | 28 368 | 26,97 | ||||
| 2025-08-15 | 13F | Morgan Stanley | 16 347 | 25,28 | 1 055 | 45,38 | ||||
| 2025-07-21 | 13F | Cornell Pochily Investment Advisors, Inc. | 3 887 | 5,88 | 251 | 22,55 | ||||
| 2025-08-14 | 13F | Headinvest, Llc | 5 783 | 0,00 | 373 | 16,20 | ||||
| 2025-08-14 | 13F | Comerica Bank | 90 | 0,00 | 6 | 0,00 | ||||
| 2025-08-14 | 13F | Redwood Financial Network Corp | 60 220 | 0,51 | 3 885 | 16,57 |