Grunnleggende statistikk
| Institusjonelle eiere | 78 total, 78 long only, 0 short only, 0 long/short - change of −5,95% MRQ |
| Gjennomsnittlig porteføljeallokering | 0.1693 % - change of −1,87% MRQ |
| Institusjonelle aksjer (Long) | 4 027 517 (ex 13D/G) - change of −0,33MM shares −7,47% MRQ |
| Institusjonell verdi (Long) | $ 91 582 USD ($1000) |
Institusjonelt eierskap og aksjonærer
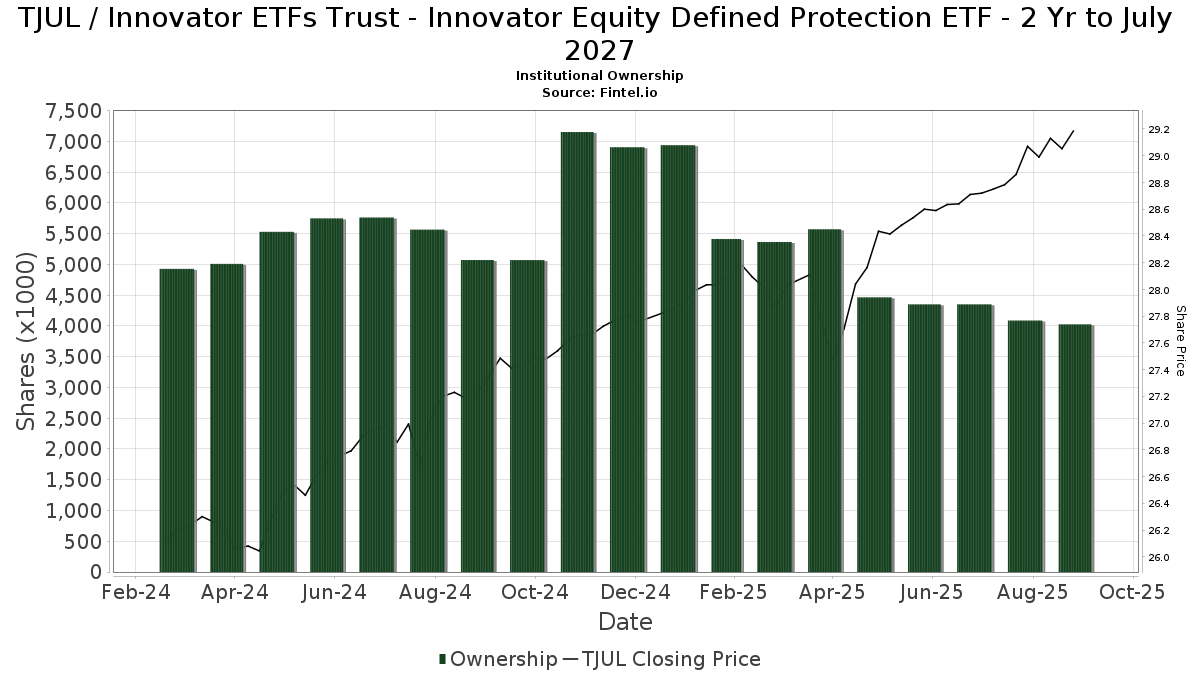
Innovator ETFs Trust - Innovator Equity Defined Protection ETF - 2 Yr to July 2027 (US:TJUL) har 78 institusjonelle eiere og aksjonærer som har sendt inn 13D/G- eller 13F-skjemaer til Securities Exchange Commission (SEC). Disse institusjonene eier til sammen 4,027,517 aksjer. De største aksjonærene inkluderer Gradient Investments LLC, Commonwealth Equity Services, Llc, Vishria Bird Financial Group, LLC, Bullseye Investment Management, LLC, Mattson Financial Services, LLC, Brown Financial Advisors, Kfg Wealth Management, Llc, Advisor Group Holdings, Inc., Cambridge Investment Research Advisors, Inc., and Kestra Advisory Services, LLC .
Innovator ETFs Trust - Innovator Equity Defined Protection ETF - 2 Yr to July 2027 (BATS:TJUL) institusjonell eierstruktur viser nåværende posisjoner i selskapet fordelt på institusjoner og fond, samt de siste endringene i posisjonsstørrelse. De største aksjonærene kan være individuelle investorer, verdipapirfond, hedgefond eller institusjoner. Schedule 13D indikerer at investoren eier (eller har eid) mer enn 5 % av selskapet og har til hensikt (eller hadde til hensikt) å aktivt forfølge en endring i forretningsstrategien. Schedule 13G indikerer en passiv investering på over 5 %.
The share price as of September 12, 2025 is 29,29 / share. Previously, on September 16, 2024, the share price was 27,34 / share. This represents an increase of 7,13% over that period.
Fondssentiment-score
Fondssentiment Score (også kjent som akkumulering av eierskap poengsum) viser hvilke aksjer som er mest kjøpt av fond. Den er resultatet av en sofistikert, kvantitativ flerfaktormodell som identifiserer selskaper med de høyeste nivåene av institusjonell akkumulering. Beregningsmodellen for poeng bruker en kombinasjon av den totale økningen i antall offentliggjorte eiere, endringer i porteføljeallokeringen til disse eierne og andre beregninger. Tallet går fra 0 til 100, der høyere tall indikerer en høyere grad av akkumulering i forhold til sammenlignbare selskaper, der 50 er gjennomsnittet.
Oppdateringsfrekvens: Daglig
Sjekk ut Ownership Explorer, som inneholder en liste over de høyest rangerte selskapene.
Institusjonell Put/Call-forhold
I tillegg til å rapportere standard aksje- og gjeldsemisjoner må institusjoner med mer enn 100 millioner kroner i forvaltningskapital også oppgi beholdningen av put- og callopsjoner. Siden put-opsjoner generelt indikerer et negativt sentiment, og call-opsjoner indikerer et positivt sentiment, kan vi få et inntrykk av det generelle institusjonelle sentimentet ved å plotte forholdet mellom put- og call-opsjoner. Diagrammet til høyre viser det historiske forholdet mellom put- og call-opsjoner for dette instrumentet.
Ved å bruke Put/Call-forholdet som en indikator på investorsentimentet kan man overvinne en av de viktigste svakhetene ved å bruke totalt institusjonelt eierskap, nemlig at en betydelig andel av forvaltningskapitalen investeres passivt for å følge indekser. Passivt forvaltede fond kjøper vanligvis ikke opsjoner, slik at indikatoren for put/call-forhold i større grad gjenspeiler stemningen i aktivt forvaltede fond.
13F- og NPORT-arkiveringer
Detaljer om 13F-arkiveringer er gratis. Detaljer om NP-arkiveringer krever et premium-medlemskap. Grønne rader indikerer nye posisjoner. Røde rader indikerer lukkede posisjoner. Klikk på lenke ikonet for å se hele transaksjonshistorikken.
Oppgrader
for å låse opp premiedata og eksportere til Excel. ![]() .
.
| Fildato | Kilde | Investor | Type | Gjennomsnittlig pris (estimert) |
Aksjer | Δ Aksjer (%) |
Rapportert verdi ($1000) | Verdi (%) | Portallokering (%) | |
|---|---|---|---|---|---|---|---|---|---|---|
| 2025-08-08 | 13F | Cetera Investment Advisers | 44 128 | −5,80 | 1 266 | −3,65 | ||||
| 2025-08-06 | 13F | AE Wealth Management LLC | 15 560 | 3,33 | 446 | 5,69 | ||||
| 2025-05-15 | 13F | Captrust Financial Advisors | 0 | −100,00 | 0 | |||||
| 2025-08-01 | 13F | Envestnet Asset Management Inc | 34 617 | 1,01 | 993 | 3,33 | ||||
| 2025-05-09 | 13F | Atria Wealth Solutions, Inc. | 0 | −100,00 | 0 | |||||
| 2025-08-08 | 13F | Foundations Investment Advisors, LLC | 0 | −100,00 | 0 | |||||
| 2025-07-08 | 13F | Gradient Investments LLC | 933 296 | −1,10 | 26 776 | 1,12 | ||||
| 2025-08-11 | 13F | Plotkin Financial Advisors, LLC | 10 987 | −22,39 | 315 | −20,65 | ||||
| 2025-07-21 | 13F | Patriot Financial Group Insurance Agency, LLC | 7 300 | 0,00 | 209 | 2,45 | ||||
| 2025-08-11 | 13F | Atlantic Private Wealth, LLC | 0 | −100,00 | 0 | |||||
| 2025-08-14 | 13F | Citadel Advisors Llc | 0 | −100,00 | 0 | |||||
| 2025-08-14 | 13F | Colony Group, LLC | 16 866 | 0,00 | 484 | 2,11 | ||||
| 2025-08-13 | 13F | Maia Wealth LLC | 13 763 | −0,95 | 395 | 2,60 | ||||
| 2025-08-13 | 13F | BCJ Capital Management, LLC | 28 469 | −1,31 | 817 | 0,87 | ||||
| 2025-07-31 | 13F | Cambridge Investment Research Advisors, Inc. | 95 760 | 0,75 | 3 | 0,00 | ||||
| 2025-08-14 | 13F | Raymond James Financial Inc | 5 488 | 157 | ||||||
| 2025-07-15 | 13F | Armis Advisers, LLC | 32 783 | 1,99 | 941 | 4,33 | ||||
| 2025-08-11 | 13F | Principal Securities, Inc. | 445 | −21,52 | 13 | −20,00 | ||||
| 2025-07-25 | 13F | We Are One Seven, LLC | 64 263 | −3,02 | 1 844 | −0,86 | ||||
| 2025-07-29 | 13F | Mattson Financial Services, LLC | 107 093 | −0,36 | 3 072 | 1,89 | ||||
| 2025-08-04 | 13F | Spire Wealth Management | 24 283 | −7,08 | 697 | −5,05 | ||||
| 2025-08-14 | 13F | CoreCap Advisors, LLC | 3 340 | 0,00 | 96 | 2,15 | ||||
| 2025-07-09 | 13F | Triumph Capital Management | 10 214 | 9,97 | 293 | 12,69 | ||||
| 2025-07-15 | 13F | Financial Management Professionals, Inc. | 17 | 0 | ||||||
| 2025-08-05 | 13F | Sigma Planning Corp | 8 337 | 0,00 | 239 | 2,58 | ||||
| 2025-05-12 | 13F | C2P Capital Advisory Group, LLC d.b.a. Prosperity Capital Advisors | 0 | −100,00 | 0 | |||||
| 2025-08-12 | 13F | Wood Tarver Financial Group, LLC | 4 988 | 0,00 | 0 | −100,00 | ||||
| 2025-07-08 | 13F | Parallel Advisors, LLC | 500 | 0,00 | 14 | 0,00 | ||||
| 2025-08-14 | 13F | Main Street Financial Solutions, LLC | 27 508 | 0,00 | 789 | 2,33 | ||||
| 2025-08-14 | 13F | Mml Investors Services, Llc | 24 490 | −15,99 | 1 | |||||
| 2025-08-12 | 13F | MAI Capital Management | 203 | 0,00 | 6 | 0,00 | ||||
| 2025-08-14 | 13F | Susquehanna International Group, Llp | 18 101 | −76,08 | 519 | −75,55 | ||||
| 2025-04-10 | 13F | Garrett Investment Advisors LLC | 0 | −100,00 | 0 | |||||
| 2025-07-23 | 13F | Kingswood Wealth Advisors, Llc | 35 548 | −1,26 | 1 020 | 0,89 | ||||
| 2025-08-08 | 13F/A | Sterling Capital Management LLC | 123 | 0,00 | 4 | 0,00 | ||||
| 2025-08-14 | 13F | Old Mission Capital Llc | 59 697 | 1 713 | ||||||
| 2025-08-06 | 13F | Vantage Financial Partners, LLC | 20 638 | 0,00 | 592 | 2,25 | ||||
| 2025-08-07 | 13F | Investment Management Corp /va/ /adv | 2 317 | 0,00 | 66 | 1,54 | ||||
| 2025-08-05 | 13F | Bank Of Montreal /can/ | 1 500 | 43 | ||||||
| 2025-08-06 | 13F | Commonwealth Equity Services, Llc | 683 501 | −1,46 | 20 | 0,00 | ||||
| 2025-08-11 | 13F | HighTower Advisors, LLC | 35 672 | −0,65 | 1 023 | 1,59 | ||||
| 2025-07-23 | 13F | Castle Rock Wealth Management, LLC | 10 625 | 0,00 | 306 | 2,35 | ||||
| 2025-08-04 | 13F | Amplius Wealth Advisors, LLC | 8 432 | 0,00 | 242 | 2,12 | ||||
| 2025-08-14 | 13F | Sunbelt Securities, Inc. | 14 490 | 1,15 | 402 | 0,25 | ||||
| 2025-04-11 | 13F | Pinnacle Wealth Management Group, Inc. | 0 | −100,00 | 0 | |||||
| 2025-08-14 | 13F | Jane Street Group, Llc | 23 117 | 663 | ||||||
| 2025-05-13 | 13F | Heck Capital Advisors, LLC | 0 | −100,00 | 0 | −100,00 | ||||
| 2025-08-08 | 13F | Kingsview Wealth Management, LLC | 11 089 | 0,00 | 318 | 2,25 | ||||
| 2025-05-14 | 13F | Change Path, LLC | 0 | −100,00 | 0 | |||||
| 2025-07-10 | 13F | Three Seasons Wealth, LLC | 10 452 | 0,00 | 300 | 2,05 | ||||
| 2025-07-07 | 13F | Vishria Bird Financial Group, LLC | 382 436 | −1,90 | 10 972 | 0,31 | ||||
| 2025-07-30 | 13F | Syntegra Private Wealth Group, LLC | 61 311 | 0,00 | 1 759 | 2,27 | ||||
| 2025-08-01 | 13F | FSA Advisors, Inc. | 0 | −100,00 | 0 | |||||
| 2025-08-11 | 13F | Lake Street Financial Llc | 32 515 | −10,44 | 933 | −8,45 | ||||
| 2025-08-29 | 13F | Centaurus Financial, Inc. | 3 900 | −91,00 | 0 | −100,00 | ||||
| 2025-07-09 | 13F | Fermata Advisors, LLC | 0 | −100,00 | 0 | |||||
| 2025-07-14 | 13F | AdvisorNet Financial, Inc | 4 020 | 0,00 | 115 | 2,68 | ||||
| 2025-05-14 | 13F | Huntington National Bank | 33 | 0,00 | ||||||
| 2025-08-15 | 13F | Brown Financial Advisors | 100 743 | −3,09 | 2 890 | −0,89 | ||||
| 2025-07-11 | 13F | Farther Finance Advisors, LLC | 29 370 | −0,01 | 843 | 2,43 | ||||
| 2025-07-25 | 13F | Prostatis Group LLC | 0 | −100,00 | 0 | |||||
| 2025-07-28 | 13F | Harbour Investments, Inc. | 13 850 | −43,35 | 397 | −42,13 | ||||
| 2025-07-29 | 13F | Stratos Wealth Advisors, LLC | 0 | −100,00 | 0 | |||||
| 2025-08-12 | 13F | Steward Partners Investment Advisory, Llc | 0 | −100,00 | 0 | |||||
| 2025-08-14 | 13F | Pine Harbor Wealth Management, LLC | 0 | −100,00 | 0 | |||||
| 2025-08-12 | 13F | Proequities, Inc. | 0 | 0 | ||||||
| 2025-08-13 | 13F | Capital Analysts, Inc. | 523 | 0,00 | 0 | |||||
| 2025-07-17 | 13F | Janney Montgomery Scott LLC | 9 794 | 0,00 | 0 | |||||
| 2025-07-14 | 13F | Kfg Wealth Management, Llc | 98 007 | −5,45 | 2 812 | −3,34 | ||||
| 2025-08-11 | 13F | Brass Tax Wealth Management, Inc | 32 900 | −0,06 | 944 | 2,17 | ||||
| 2025-08-04 | 13F | IFG Advisory, LLC | 10 160 | 291 | ||||||
| 2025-07-22 | 13F | Diligent Investors, LLC | 57 415 | 0,00 | 1 647 | 2,23 | ||||
| 2025-07-25 | 13F | Lion Street Advisors, LLC | 13 435 | 0,00 | 385 | 2,39 | ||||
| 2025-07-08 | 13F | Paladin Wealth, LLC | 19 100 | −2,43 | 548 | −0,36 | ||||
| 2025-08-12 | 13F | LPL Financial LLC | 59 119 | 13,57 | 1 696 | 16,16 | ||||
| 2025-04-15 | 13F | Noble Wealth Management PBC | 15 892 | −2,78 | 446 | −1,77 | ||||
| 2025-07-29 | 13F | AssuredPartners Investment Advisors, LLC | 0 | −100,00 | 0 | |||||
| 2025-07-30 | 13F | Strategic Blueprint, LLC | 11 350 | −93,27 | 326 | −93,14 | ||||
| 2025-07-24 | 13F | IFP Advisors, Inc | 4 645 | −17,05 | 133 | −15,29 | ||||
| 2025-08-12 | 13F | Global Retirement Partners, LLC | 100 | 0,00 | 3 | 0,00 | ||||
| 2025-09-04 | 13F/A | Advisor Group Holdings, Inc. | 96 123 | −5,94 | 2 758 | −3,84 | ||||
| 2025-07-10 | 13F | Wealth Enhancement Advisory Services, Llc | 24 400 | 0,00 | 701 | 2,34 | ||||
| 2025-07-30 | 13F | Brookstone Capital Management | 89 526 | −0,36 | 2 569 | 1,86 | ||||
| 2025-08-14 | 13F | UBS Group AG | 30 392 | 54,34 | 872 | 57,79 | ||||
| 2025-05-15 | 13F | SRS Capital Advisors, Inc. | 0 | −100,00 | 0 | |||||
| 2025-08-07 | 13F | Allworth Financial LP | 450 | 13 | ||||||
| 2025-08-04 | 13F | Assetmark, Inc | 38 | 0,00 | 1 | 0,00 | ||||
| 2025-08-08 | 13F | Capital Investment Advisory Services, LLC | 4 000 | 0,00 | 115 | 1,79 | ||||
| 2025-08-12 | 13F | Jpmorgan Chase & Co | 9 391 | −6,22 | 269 | −3,93 | ||||
| 2025-08-14 | 13F | Financial Network Wealth Advisors LLC | 1 331 | −6,99 | 38 | −5,00 | ||||
| 2025-08-14 | 13F | GWM Advisors LLC | 17 753 | −9,23 | 509 | −7,12 | ||||
| 2025-08-01 | 13F | Gwn Securities Inc. | 14 435 | −0,02 | 414 | 2,22 | ||||
| 2025-07-09 | 13F | Central Valley Advisors, Llc | 21 658 | 0,00 | 621 | 2,31 | ||||
| 2025-08-13 | 13F | Cerity Partners LLC | 0 | −100,00 | 0 | |||||
| 2025-08-06 | 13F | Bullseye Investment Management, LLC | 196 880 | 0,00 | 5 524 | 0,00 | ||||
| 2025-08-15 | 13F | Morgan Stanley | 1 548 | 0,00 | 44 | 2,33 | ||||
| 2025-08-15 | 13F | Kestra Advisory Services, LLC | 90 177 | 20,74 | 2 587 | 23,48 | ||||
| 2025-07-22 | 13F | Beacon Financial Advisory LLC | 11 930 | 0,00 | 342 | 2,40 | ||||
| 2025-07-15 | 13F | Accurate Wealth Management, LLC | 0 | −100,00 | 0 | |||||
| 2025-04-22 | 13F | Bright Futures Wealth Management, LLC. | 0 | −100,00 | 0 | |||||
| 2025-08-14 | 13F/A | Barclays Plc | 6 900 | −3,67 | 0 |