Grunnleggende statistikk
| Institusjonelle eiere | 101 total, 101 long only, 0 short only, 0 long/short - change of 8,60% MRQ |
| Gjennomsnittlig porteføljeallokering | 1.0283 % - change of 5,69% MRQ |
| Institusjonelle aksjer (Long) | 53 095 812 (ex 13D/G) - change of 23,93MM shares 82,03% MRQ |
| Institusjonell verdi (Long) | $ 2 925 306 USD ($1000) |
Institusjonelt eierskap og aksjonærer
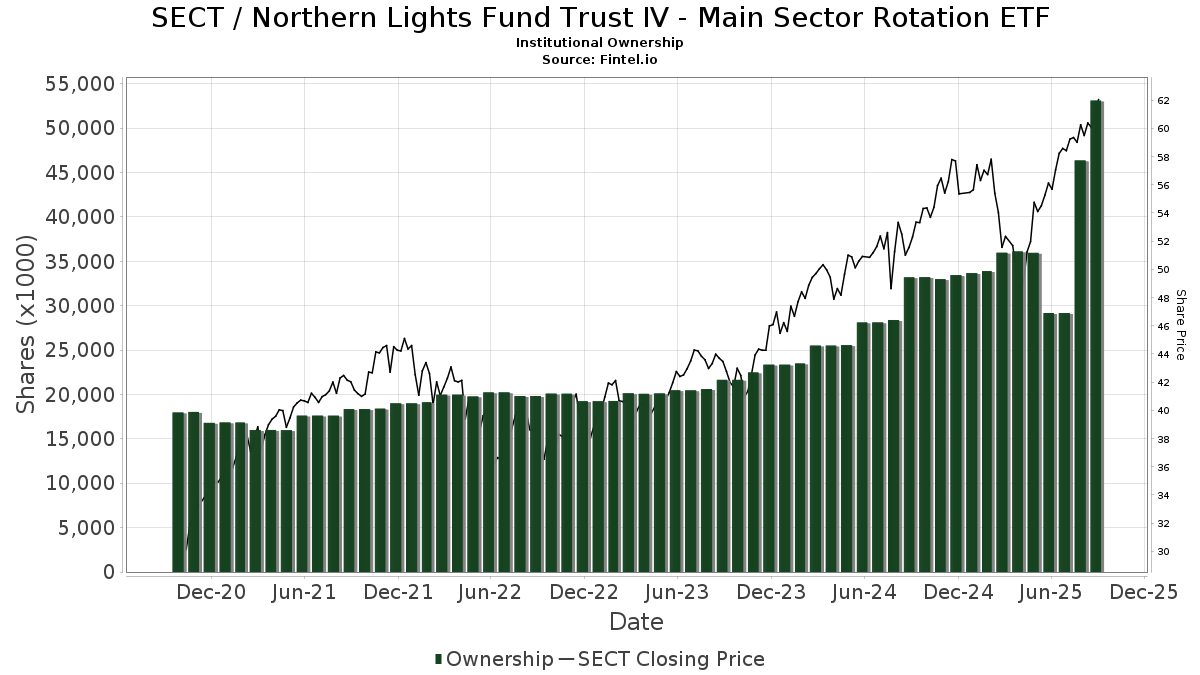
Northern Lights Fund Trust IV - Main Sector Rotation ETF (US:SECT) har 101 institusjonelle eiere og aksjonærer som har sendt inn 13D/G- eller 13F-skjemaer til Securities Exchange Commission (SEC). Disse institusjonene eier til sammen 53,095,812 aksjer. De største aksjonærene inkluderer Orion Portfolio Solutions, LLC, Brinker Capital Investments, LLC, Advisor Group Holdings, Inc., LPL Financial LLC, Envestnet Asset Management Inc, Potomac Fund Management Inc /adv, Integrated Wealth Concepts LLC, Change Path, LLC, GeoWealth Management, LLC, and Madrona Financial Services, LLC .
Northern Lights Fund Trust IV - Main Sector Rotation ETF (BATS:SECT) institusjonell eierstruktur viser nåværende posisjoner i selskapet fordelt på institusjoner og fond, samt de siste endringene i posisjonsstørrelse. De største aksjonærene kan være individuelle investorer, verdipapirfond, hedgefond eller institusjoner. Schedule 13D indikerer at investoren eier (eller har eid) mer enn 5 % av selskapet og har til hensikt (eller hadde til hensikt) å aktivt forfølge en endring i forretningsstrategien. Schedule 13G indikerer en passiv investering på over 5 %.
The share price as of September 12, 2025 is 61,75 / share. Previously, on September 13, 2024, the share price was 52,47 / share. This represents an increase of 17,69% over that period.
Fondssentiment-score
Fondssentiment Score (også kjent som akkumulering av eierskap poengsum) viser hvilke aksjer som er mest kjøpt av fond. Den er resultatet av en sofistikert, kvantitativ flerfaktormodell som identifiserer selskaper med de høyeste nivåene av institusjonell akkumulering. Beregningsmodellen for poeng bruker en kombinasjon av den totale økningen i antall offentliggjorte eiere, endringer i porteføljeallokeringen til disse eierne og andre beregninger. Tallet går fra 0 til 100, der høyere tall indikerer en høyere grad av akkumulering i forhold til sammenlignbare selskaper, der 50 er gjennomsnittet.
Oppdateringsfrekvens: Daglig
Sjekk ut Ownership Explorer, som inneholder en liste over de høyest rangerte selskapene.
Institusjonell Put/Call-forhold
I tillegg til å rapportere standard aksje- og gjeldsemisjoner må institusjoner med mer enn 100 millioner kroner i forvaltningskapital også oppgi beholdningen av put- og callopsjoner. Siden put-opsjoner generelt indikerer et negativt sentiment, og call-opsjoner indikerer et positivt sentiment, kan vi få et inntrykk av det generelle institusjonelle sentimentet ved å plotte forholdet mellom put- og call-opsjoner. Diagrammet til høyre viser det historiske forholdet mellom put- og call-opsjoner for dette instrumentet.
Ved å bruke Put/Call-forholdet som en indikator på investorsentimentet kan man overvinne en av de viktigste svakhetene ved å bruke totalt institusjonelt eierskap, nemlig at en betydelig andel av forvaltningskapitalen investeres passivt for å følge indekser. Passivt forvaltede fond kjøper vanligvis ikke opsjoner, slik at indikatoren for put/call-forhold i større grad gjenspeiler stemningen i aktivt forvaltede fond.
13F- og NPORT-arkiveringer
Detaljer om 13F-arkiveringer er gratis. Detaljer om NP-arkiveringer krever et premium-medlemskap. Grønne rader indikerer nye posisjoner. Røde rader indikerer lukkede posisjoner. Klikk på lenke ikonet for å se hele transaksjonshistorikken.
Oppgrader
for å låse opp premiedata og eksportere til Excel. ![]() .
.
| Fildato | Kilde | Investor | Type | Gjennomsnittlig pris (estimert) |
Aksjer | Δ Aksjer (%) |
Rapportert verdi ($1000) | Verdi (%) | Portallokering (%) | |
|---|---|---|---|---|---|---|---|---|---|---|
| 2025-08-12 | 13F | Coldstream Capital Management Inc | 3 840 | 44,47 | 223 | 64,44 | ||||
| 2025-08-13 | 13F | Copley Financial Group, Inc. | 301 629 | −12,14 | 17 516 | −0,08 | ||||
| 2025-08-07 | 13F | Encompass More Asset Management | 223 230 | −5,42 | 12 963 | 7,56 | ||||
| 2025-07-21 | 13F | Triad Wealth Partners, LLC | 26 460 | 1 537 | ||||||
| 2025-08-18 | 13F | Geneos Wealth Management Inc. | 88 809 | 60,37 | 5 157 | 82,42 | ||||
| 2025-07-25 | 13F | Cwm, Llc | 102 998 | −3,29 | 6 | 0,00 | ||||
| 2025-08-20 | 13F/A | Coppell Advisory Solutions LLC | 10 523 | 607 | ||||||
| 2025-08-11 | 13F | Private Advisor Group, LLC | 11 472 | 21,01 | 666 | 37,60 | ||||
| 2025-08-14 | 13F | Aqr Capital Management Llc | 5 844 | 339 | ||||||
| 2025-08-12 | 13F | Global Retirement Partners, LLC | 980 | 5,15 | 57 | 9,80 | ||||
| 2025-07-28 | 13F | WealthPLAN Partners, LLC | 320 140 | 2,27 | 18 591 | 16,31 | ||||
| 2025-08-14 | 13F | Integrated Wealth Concepts LLC | 655 583 | −29,44 | 38 070 | −19,75 | ||||
| 2025-08-01 | 13F | Envestnet Asset Management Inc | 1 094 863 | 16,90 | 63 579 | 32,94 | ||||
| 2025-05-28 | 13F | GK Wealth Management LLC | 0 | −100,00 | 0 | |||||
| 2025-08-13 | 13F | Gibbs Wealth Management | 28 471 | 1 653 | ||||||
| 2025-07-15 | 13F | World Equity Group, Inc. | 38 325 | −11,48 | 2 226 | 0,68 | ||||
| 2025-08-08 | 13F | Cetera Investment Advisers | 157 823 | 21,00 | 9 165 | 37,60 | ||||
| 2025-04-14 | 13F | Toth Financial Advisory Corp | 0 | −100,00 | 0 | |||||
| 2025-08-01 | 13F | Brookwood Investment Group LLC | 10 103 | −2,67 | 587 | 10,78 | ||||
| 2025-07-09 | 13F | Fiduciary Alliance LLC | 36 519 | −28,62 | 2 121 | −18,84 | ||||
| 2025-07-31 | 13F | Cambridge Investment Research Advisors, Inc. | 64 475 | −5,33 | 4 | 0,00 | ||||
| 2025-07-25 | 13F | Envestnet Portfolio Solutions, Inc. | 192 624 | −60,73 | 11 186 | −55,34 | ||||
| 2025-08-12 | 13F | Change Path, LLC | 569 987 | 1,77 | 33 099 | 15,75 | ||||
| 2025-07-18 | 13F | PFG Investments, LLC | 13 462 | 0,00 | 782 | 13,68 | ||||
| 2025-08-12 | 13F | LPL Financial LLC | 2 958 356 | 50,16 | 171 792 | 70,77 | ||||
| 2025-08-12 | 13F | CIBC Private Wealth Group, LLC | 10 427 | −2,84 | 605 | 24,74 | ||||
| 2025-08-14 | 13F | Wells Fargo & Company/mn | 7 835 | −5,77 | 455 | 7,08 | ||||
| 2025-08-11 | 13F | Synergy Investment Management, LLC | 44 138 | 1,23 | 2 563 | 6,97 | ||||
| 2025-08-15 | 13F/A | Florida Financial Advisors, Llc | 31 227 | −14,09 | 1 813 | −2,26 | ||||
| 2025-08-07 | 13F | Allworth Financial LP | 8 092 | 0,00 | 470 | 15,23 | ||||
| 2025-08-07 | 13F | Meeder Advisory Services, Inc. | 6 920 | −25,97 | 402 | −15,93 | ||||
| 2025-05-15 | 13F | Creative Planning | 0 | −100,00 | 0 | |||||
| 2025-04-23 | 13F | Crewe Advisors LLC | 0 | −100,00 | 0 | |||||
| 2025-07-23 | 13F | Defined Financial Planning LLC | 116 273 | 7,55 | 6 773 | 22,35 | ||||
| 2025-08-13 | 13F | Townsquare Capital Llc | 4 125 | −99,13 | 240 | −99,01 | ||||
| 2025-07-28 | 13F | Mutual Advisors, LLC | 230 000 | 0,89 | 13 664 | 18,13 | ||||
| 2025-07-29 | 13F | Koshinski Asset Management, Inc. | 20 094 | 19,72 | 1 167 | 36,21 | ||||
| 2025-08-12 | 13F | Main Management LLC | 387 494 | −0,83 | 23 | 15,79 | ||||
| 2025-07-10 | 13F | Signal Advisors Wealth, LLC | 3 877 | 225 | ||||||
| 2025-07-10 | 13F | Sovran Advisors, LLC | 6 139 | −6,66 | 357 | 13,33 | ||||
| 2025-07-16 | 13F | Independent Wealth Network Inc. | 20 313 | −2,12 | 1 180 | 11,33 | ||||
| 2025-08-18 | 13F | Tactive Advisors, LLC | 48 566 | 2 820 | ||||||
| 2025-07-07 | 13F | Discipline Wealth Solutions, LLC | 32 845 | −1,95 | 1 907 | 11,52 | ||||
| 2025-08-04 | 13F | Buck Wealth Strategies, LLC | 5 437 | 316 | ||||||
| 2025-07-09 | 13F | VisionPoint Advisory Group, LLC | 20 809 | 65,97 | 1 208 | 88,75 | ||||
| 2025-08-06 | 13F | Commonwealth Equity Services, Llc | 25 852 | −16,35 | 2 | 0,00 | ||||
| 2025-08-19 | 13F | Advisory Services Network, LLC | 10 924 | −4,50 | 643 | 9,93 | ||||
| 2025-04-23 | 13F | Mascagni Wealth Management, Inc. | 0 | −100,00 | 0 | −100,00 | ||||
| 2025-08-19 | 13F | Anchor Investment Management, LLC | 4 257 | 0,00 | 247 | 13,82 | ||||
| 2025-03-18 | 13F/A | Bank Of America Corp /de/ | 0 | −100,00 | 0 | |||||
| 2025-05-15 | 13F | GWM Advisors LLC | 0 | −100,00 | 0 | −100,00 | ||||
| 2025-08-07 | 13F | Nwam Llc | 0 | −100,00 | 0 | |||||
| 2025-08-04 | 13F | Barnes Dennig Private Wealth Management LLC | 4 041 | 0,00 | 235 | 13,59 | ||||
| 2025-08-12 | 13F | Nemes Rush Group LLC | 2 633 | 0,00 | 153 | 13,43 | ||||
| 2025-08-14 | 13F | Royal Bank Of Canada | 985 | 0,00 | 57 | 14,00 | ||||
| 2025-08-14 | 13F | Citadel Advisors Llc | 31 964 | 299,05 | 1 856 | 354,90 | ||||
| 2025-08-12 | 13F | Steward Partners Investment Advisory, Llc | 2 827 | 0,00 | 164 | 13,89 | ||||
| 2025-08-13 | 13F | Cerity Partners LLC | 3 949 | 0,00 | 229 | 13,93 | ||||
| 2025-08-01 | 13F | Gwn Securities Inc. | 82 106 | 16,23 | 4 770 | 27,65 | ||||
| 2025-08-15 | 13F | Morgan Stanley | 1 802 | 24,10 | 105 | 40,54 | ||||
| 2025-08-14 | 13F | Potomac Fund Management Inc /adv | 804 635 | 6,70 | 46 999 | 33,06 | ||||
| 2025-05-14 | 13F | Atomi Financial Group, Inc. | 0 | −100,00 | 0 | |||||
| 2025-07-15 | 13F | Armis Advisers, LLC | 10 658 | 621 | ||||||
| 2025-08-13 | 13F | EverSource Wealth Advisors, LLC | 3 202 | −0,34 | 186 | 12,80 | ||||
| 2025-08-14 | 13F | Diversify Advisory Services, LLC | 6 456 | 0,59 | 387 | 17,68 | ||||
| 2025-08-06 | 13F | Ethos Financial Group, LLC | 6 016 | 0,00 | 349 | 5,76 | ||||
| 2025-08-08 | 13F | Foundations Investment Advisors, LLC | 10 961 | −20,16 | 637 | −9,27 | ||||
| 2025-08-11 | 13F | Aptus Capital Advisors, LLC | 3 301 | −28,46 | 192 | −18,72 | ||||
| 2025-08-14 | 13F | Susquehanna International Group, Llp | 4 263 | −62,21 | 248 | −57,04 | ||||
| 2025-07-28 | 13F | Lunt Capital Management, Inc. | 41 995 | 0,68 | 2 439 | 14,51 | ||||
| 2025-08-12 | 13F | J.w. Cole Advisors, Inc. | 8 596 | 499 | ||||||
| 2025-07-18 | 13F | Cooper Financial Group | 0 | −100,00 | 0 | |||||
| 2025-08-12 | 13F | Bravias Capital Group, LLC | 28 731 | −12,04 | 1 668 | 0,06 | ||||
| 2025-07-18 | 13F | Madrona Financial Services, LLC | 425 082 | 1,48 | 24 684 | 15,41 | ||||
| 2025-07-31 | 13F | Richards, Merrill & Peterson, Inc. | 0 | −100,00 | 0 | |||||
| 2025-07-28 | 13F | Harbour Investments, Inc. | 4 855 | 0,00 | 282 | 13,77 | ||||
| 2025-08-04 | 13F | Spire Wealth Management | 127 851 | −34,56 | 7 190 | −27,93 | ||||
| 2025-08-14 | 13F | Jane Street Group, Llc | 4 467 | −62,74 | 259 | −57,68 | ||||
| 2025-08-12 | 13F | TCP Asset Management, LLC | 12 266 | 0,00 | 712 | 13,74 | ||||
| 2025-08-14 | 13F | Raymond James Financial Inc | 517 | 30 | ||||||
| 2025-04-22 | 13F | FSC Wealth Advisors, LLC | 0 | −100,00 | 0 | |||||
| 2025-08-12 | 13F | Jpmorgan Chase & Co | 181 | −52,12 | 11 | −47,37 | ||||
| 2025-05-15 | 13F/A | Orion Portfolio Solutions, LLC | 17 670 190 | −1,36 | 902 240 | −8,36 | ||||
| 2025-08-12 | 13F | Proequities, Inc. | 0 | 0 | ||||||
| 2025-07-30 | 13F | Advantage Trust Co | 39 586 | 2,38 | 2 299 | 16,41 | ||||
| 2025-08-11 | 13F | Brass Tax Wealth Management, Inc | 42 406 | 9,42 | 2 463 | 24,47 | ||||
| 2025-07-28 | 13F | RFG Advisory, LLC | 10 435 | −5,56 | 606 | 7,27 | ||||
| 2025-08-05 | 13F | Westside Investment Management, Inc. | 834 | 0,00 | 48 | 14,29 | ||||
| 2025-08-04 | 13F | Assetmark, Inc | 1 707 | −14,78 | 99 | −2,94 | ||||
| 2025-07-16 | 13F | Perigon Wealth Management, LLC | 4 218 | 245 | ||||||
| 2025-08-05 | 13F | Sigma Planning Corp | 111 266 | −0,32 | 6 461 | 13,37 | ||||
| 2025-08-15 | 13F | Kestra Advisory Services, LLC | 14 365 | 7,17 | 834 | 21,93 | ||||
| 2025-07-28 | 13F | Rosenberg Matthew Hamilton | 1 379 | −0,65 | 80 | 14,29 | ||||
| 2025-07-30 | 13F | Eqis Capital Management, Inc. | 48 478 | 3,47 | 2 815 | 17,68 | ||||
| 2025-08-14 | 13F | Old Mission Capital Llc | 17 575 | 97,74 | 1 021 | 125,17 | ||||
| 2025-08-04 | 13F | Arkadios Wealth Advisors | 3 777 | 219 | ||||||
| 2025-07-25 | 13F | Atria Wealth Solutions, Inc. | 108 779 | −75,66 | 6 326 | −72,28 | ||||
| 2025-07-11 | 13F | Farther Finance Advisors, LLC | 8 461 | −3,07 | 491 | 10,09 | ||||
| 2025-07-22 | 13F | Simplicity Wealth,LLC | 7 598 | 0,00 | 441 | 13,95 | ||||
| 2025-08-13 | 13F | Continuum Advisory, LLC | 0 | −100,00 | 0 | |||||
| 2025-08-13 | 13F | GeoWealth Management, LLC | 512 662 | 27,87 | 29 770 | 45,43 | ||||
| 2025-07-02 | 13F | McAlister, Sweet & Associates, Inc. | 0 | −100,00 | 0 | |||||
| 2025-08-12 | 13F | CFC Planning Co LLC | 39 489 | −1,85 | 2 293 | 11,64 | ||||
| 2025-08-13 | 13F | Natixis Advisors, L.p. | 13 380 | −5,15 | 1 | |||||
| 2025-08-06 | 13F | AE Wealth Management LLC | 5 552 | −17,26 | 322 | −5,85 | ||||
| 2025-08-13 | 13F | Echo45 Advisors LLC | 69 990 | −0,37 | 4 064 | 13,30 | ||||
| 2025-08-12 | 13F | Financial Advocates Investment Management | 8 557 | −13,83 | 497 | −2,17 | ||||
| 2025-07-16 | 13F | Signaturefd, Llc | 8 511 | 494 | ||||||
| 2025-08-14 | 13F | Tripletail Wealth Management, LLC | 18 510 | 1 098 | ||||||
| 2025-08-13 | 13F | Northwestern Mutual Wealth Management Co | 0 | −100,00 | 0 | |||||
| 2025-09-04 | 13F/A | Advisor Group Holdings, Inc. | 6 666 366 | 3 879,94 | 387 116 | 4 426,61 | ||||
| 2025-08-04 | 13F | Integrity Alliance, Llc. | 184 016 | −36,13 | 10 686 | −27,36 | ||||
| 2025-08-08 | 13F | Avantax Advisory Services, Inc. | 155 435 | 5,72 | 9 026 | 20,23 | ||||
| 2025-08-27 | 13F/A | Brinker Capital Investments, LLC | 17 533 925 | −0,77 | 1 018 195 | 12,85 | ||||
| 2025-07-14 | 13F | Painted Porch Advisors LLC | 0 | −100,00 | 0 | −100,00 | ||||
| 2025-08-04 | 13F | Atria Investments Llc | 165 743 | −0,23 | 9 625 | 13,46 | ||||
| 2025-07-24 | 13F | IFP Advisors, Inc | 991 | −69,45 | 58 | −65,45 | ||||
| 2025-07-11 | 13F | SILVER OAK SECURITIES, Inc | 25 131 | 14,92 | 1 459 | 30,85 |