Grunnleggende statistikk
| Institusjonelle eiere | 210 total, 210 long only, 0 short only, 0 long/short - change of 0,48% MRQ |
| Gjennomsnittlig porteføljeallokering | 0.2352 % - change of −3,63% MRQ |
| Institusjonelle aksjer (Long) | 19 117 201 (ex 13D/G) - change of 1,20MM shares 6,68% MRQ |
| Institusjonell verdi (Long) | $ 602 667 USD ($1000) |
Institusjonelt eierskap og aksjonærer
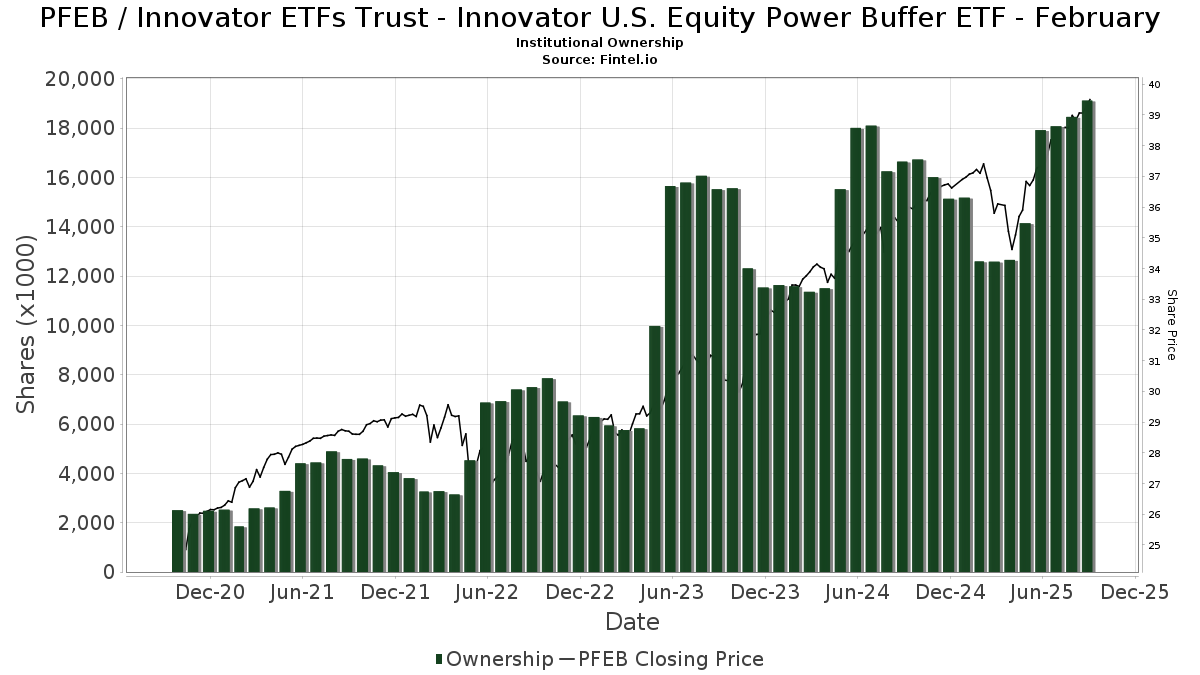
Innovator ETFs Trust - Innovator U.S. Equity Power Buffer ETF - February (US:PFEB) har 210 institusjonelle eiere og aksjonærer som har sendt inn 13D/G- eller 13F-skjemaer til Securities Exchange Commission (SEC). Disse institusjonene eier til sammen 19,117,201 aksjer. De største aksjonærene inkluderer Alliancebernstein L.p., Penserra Capital Management LLC, Innovator ETFs Trust - Innovator Laddered Fund of U.S. Equity Power Buffer ETFs, Commonwealth Equity Services, Llc, Advisor Group Holdings, Inc., Brookstone Capital Management, Old Mission Capital Llc, Wealth Enhancement Advisory Services, Llc, Raymond James Financial Inc, and Kovitz Investment Group Partners, LLC .
Innovator ETFs Trust - Innovator U.S. Equity Power Buffer ETF - February (BATS:PFEB) institusjonell eierstruktur viser nåværende posisjoner i selskapet fordelt på institusjoner og fond, samt de siste endringene i posisjonsstørrelse. De største aksjonærene kan være individuelle investorer, verdipapirfond, hedgefond eller institusjoner. Schedule 13D indikerer at investoren eier (eller har eid) mer enn 5 % av selskapet og har til hensikt (eller hadde til hensikt) å aktivt forfølge en endring i forretningsstrategien. Schedule 13G indikerer en passiv investering på over 5 %.
The share price as of September 11, 2025 is 39,41 / share. Previously, on September 12, 2024, the share price was 35,69 / share. This represents an increase of 10,42% over that period.
Fondssentiment-score
Fondssentiment Score (også kjent som akkumulering av eierskap poengsum) viser hvilke aksjer som er mest kjøpt av fond. Den er resultatet av en sofistikert, kvantitativ flerfaktormodell som identifiserer selskaper med de høyeste nivåene av institusjonell akkumulering. Beregningsmodellen for poeng bruker en kombinasjon av den totale økningen i antall offentliggjorte eiere, endringer i porteføljeallokeringen til disse eierne og andre beregninger. Tallet går fra 0 til 100, der høyere tall indikerer en høyere grad av akkumulering i forhold til sammenlignbare selskaper, der 50 er gjennomsnittet.
Oppdateringsfrekvens: Daglig
Sjekk ut Ownership Explorer, som inneholder en liste over de høyest rangerte selskapene.
Institusjonell Put/Call-forhold
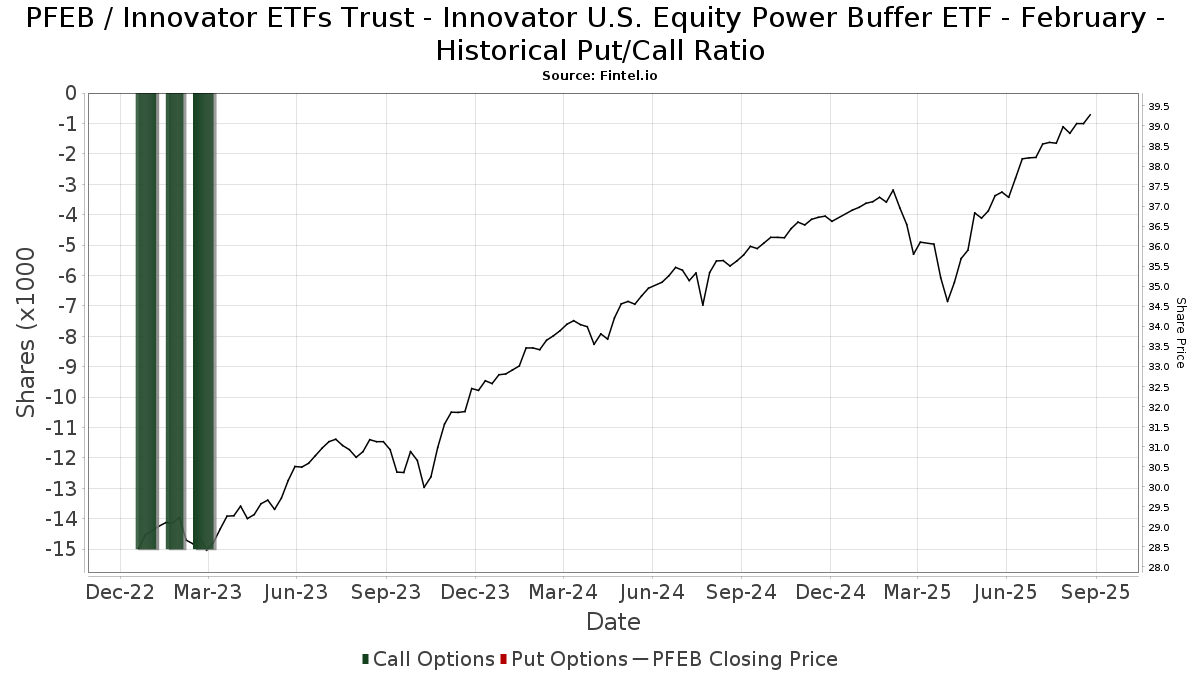
I tillegg til å rapportere standard aksje- og gjeldsemisjoner må institusjoner med mer enn 100 millioner kroner i forvaltningskapital også oppgi beholdningen av put- og callopsjoner. Siden put-opsjoner generelt indikerer et negativt sentiment, og call-opsjoner indikerer et positivt sentiment, kan vi få et inntrykk av det generelle institusjonelle sentimentet ved å plotte forholdet mellom put- og call-opsjoner. Diagrammet til høyre viser det historiske forholdet mellom put- og call-opsjoner for dette instrumentet.
Ved å bruke Put/Call-forholdet som en indikator på investorsentimentet kan man overvinne en av de viktigste svakhetene ved å bruke totalt institusjonelt eierskap, nemlig at en betydelig andel av forvaltningskapitalen investeres passivt for å følge indekser. Passivt forvaltede fond kjøper vanligvis ikke opsjoner, slik at indikatoren for put/call-forhold i større grad gjenspeiler stemningen i aktivt forvaltede fond.
13F- og NPORT-arkiveringer
Detaljer om 13F-arkiveringer er gratis. Detaljer om NP-arkiveringer krever et premium-medlemskap. Grønne rader indikerer nye posisjoner. Røde rader indikerer lukkede posisjoner. Klikk på lenke ikonet for å se hele transaksjonshistorikken.
Oppgrader
for å låse opp premiedata og eksportere til Excel. ![]() .
.
| Fildato | Kilde | Investor | Type | Gjennomsnittlig pris (estimert) |
Aksjer | Δ Aksjer (%) |
Rapportert verdi ($1000) | Verdi (%) | Portallokering (%) | |
|---|---|---|---|---|---|---|---|---|---|---|
| 2025-08-14 | 13F | Helium Advisors LLC | 15 335 | 0,00 | 583 | 6,01 | ||||
| 2025-07-30 | 13F | Strategic Blueprint, LLC | 10 239 | −5,19 | 389 | 0,78 | ||||
| 2025-08-06 | 13F | AE Wealth Management LLC | 114 685 | −74,88 | 4 359 | −73,34 | ||||
| 2025-08-14 | 13F | Apriem Advisors | 9 150 | 0,00 | 348 | 6,12 | ||||
| 2025-07-22 | 13F | Merit Financial Group, LLC | 6 529 | 248 | ||||||
| 2025-07-25 | 13F | Apollon Wealth Management, LLC | 23 500 | 0,00 | 893 | 6,18 | ||||
| 2025-08-14 | 13F | Visionary Wealth Advisors | 45 088 | −12,37 | 1 714 | −7,05 | ||||
| 2025-05-07 | 13F | HB Wealth Management, LLC | 0 | −100,00 | 0 | −100,00 | ||||
| 2025-08-06 | 13F | Penserra Capital Management LLC | 1 542 531 | 16,39 | 59 | 23,40 | ||||
| 2025-07-23 | 13F | Prasad Wealth Partners, LLC | 6 730 | 0,00 | 256 | 5,81 | ||||
| 2025-08-14 | 13F | Ausdal Financial Partners, Inc. | 10 527 | 0,00 | 400 | 6,10 | ||||
| 2025-08-11 | 13F | Summit Wealth Partners, LLC | 9 496 | −4,86 | 361 | 0,84 | ||||
| 2025-07-23 | 13F | Valmark Advisers, Inc. | 24 777 | −2,08 | 942 | 3,86 | ||||
| 2025-05-15 | 13F | Bank Of America Corp /de/ | 0 | −100,00 | 0 | |||||
| 2025-08-14 | 13F | Ambassador Advisors, LLC | 8 665 | −0,63 | 329 | 5,45 | ||||
| 2025-08-14 | 13F | Wells Fargo & Company/mn | 599 | 0,00 | 23 | 4,76 | ||||
| 2025-07-11 | 13F | SILVER OAK SECURITIES, Inc | 11 214 | −2,91 | 426 | 3,15 | ||||
| 2025-08-14 | 13F | Jane Street Group, Llc | 0 | −100,00 | 0 | |||||
| 2025-07-16 | 13F | NovaPoint Capital, LLC | 0 | −100,00 | 0 | |||||
| 2025-08-13 | 13F | BCJ Capital Management, LLC | 28 112 | −41,93 | 1 069 | −38,41 | ||||
| 2025-07-31 | 13F | Gill Capital Partners, Llc | 87 762 | 1,43 | 3 336 | 7,62 | ||||
| 2025-08-05 | 13F | Smith Shellnut Wilson Llc /adv | 8 712 | 0,00 | 331 | 6,09 | ||||
| 2025-08-11 | 13F | Blue Bell Private Wealth Management, Llc | 56 036 | −0,38 | 2 130 | 5,71 | ||||
| 2025-05-15 | 13F | CAPROCK Group, Inc. | 325 964 | 11 676 | ||||||
| 2025-08-01 | 13F | Gwn Securities Inc. | 0 | −100,00 | 0 | |||||
| 2025-08-11 | 13F | Annis Gardner Whiting Capital Advisors, LLC | 1 300 | 49 | ||||||
| 2025-07-25 | 13F | Cwm, Llc | 15 250 | −7,12 | 1 | |||||
| 2025-08-14 | 13F | Vista Investment Management | 6 092 | 0,00 | 232 | 5,96 | ||||
| 2025-07-25 | 13F | Atria Wealth Solutions, Inc. | 32 871 | 5,24 | 1 250 | 11,81 | ||||
| 2025-08-14 | 13F | CoreCap Advisors, LLC | 144 089 | 63,94 | 5 477 | 73,95 | ||||
| 2025-08-08 | 13F | Thoroughbred Financial Services, Llc | 10 000 | 0,00 | 0 | |||||
| 2025-08-12 | 13F | Steward Partners Investment Advisory, Llc | 120 | 0,00 | 5 | 0,00 | ||||
| 2025-08-06 | 13F | Valtinson Bruner Financial Planning LLC | 14 221 | −5,93 | 541 | −0,18 | ||||
| 2025-07-31 | 13F | Optimum Investment Advisors | 115 | 0,00 | 4 | 0,00 | ||||
| 2025-08-07 | 13F | PFG Advisors | 6 617 | −1,72 | 252 | 4,15 | ||||
| 2025-07-29 | 13F | Stephens Inc /ar/ | 90 970 | −3,27 | 3 458 | 2,64 | ||||
| 2025-07-08 | 13F | Nbc Securities, Inc. | 450 | 0,00 | 0 | |||||
| 2025-07-28 | 13F | Cypress Wealth Services, LLC | 0 | −100,00 | 0 | |||||
| 2025-08-08 | 13F | Avantax Advisory Services, Inc. | 33 290 | −3,39 | 1 265 | 2,51 | ||||
| 2025-07-29 | 13F | AssuredPartners Investment Advisors, LLC | 6 894 | −66,68 | 262 | −64,64 | ||||
| 2025-08-12 | 13F | Ascent Wealth Partners, LLC | 86 670 | 24,96 | 3 294 | 32,61 | ||||
| 2025-08-14 | 13F | Royal Bank Of Canada | 0 | −100,00 | 0 | |||||
| 2025-08-12 | 13F | Jacobi Capital Management LLC | 12 529 | 0,00 | 476 | 6,25 | ||||
| 2025-08-11 | 13F | Nations Financial Group Inc, /ia/ /adv | 34 531 | 0,54 | 1 313 | 6,67 | ||||
| 2025-07-31 | 13F | Brinker Capital Investments, LLC | 0 | −100,00 | 0 | −100,00 | ||||
| 2025-07-23 | 13F | Kingswood Wealth Advisors, Llc | 8 311 | 0,00 | 316 | 6,06 | ||||
| 2025-08-12 | 13F | Proequities, Inc. | 0 | 0 | ||||||
| 2025-07-31 | 13F | FSR Wealth Management Ltd. | 0 | −100,00 | 0 | |||||
| 2025-08-14 | 13F | Financial Network Wealth Advisors LLC | 3 077 | 0,00 | 117 | 5,45 | ||||
| 2025-07-22 | 13F | Global Strategic Investment Solutions, LLC | 38 476 | 0,00 | 1 462 | 6,10 | ||||
| 2025-08-01 | 13F | Advisory Alpha, LLC | 104 928 | 63,34 | 3 988 | 73,32 | ||||
| 2025-08-05 | 13F | C2P Capital Advisory Group, LLC d.b.a. Prosperity Capital Advisors | 7 999 | 0,00 | 304 | 5,92 | ||||
| 2025-05-15 | 13F | Citadel Advisors Llc | 0 | −100,00 | 0 | |||||
| 2025-07-24 | 13F | Weaver Capital Management LLC | 42 475 | 0,00 | 1 614 | 6,11 | ||||
| 2025-07-10 | 13F | Signal Advisors Wealth, LLC | 8 261 | 314 | ||||||
| 2025-08-12 | 13F | Park Square Financial Group, LLC | 0 | −100,00 | 0 | |||||
| 2025-04-10 | 13F | Sugar Maple Asset Management, LLC | 0 | −100,00 | 0 | |||||
| 2025-07-02 | 13F | McAlister, Sweet & Associates, Inc. | 81 632 | 0,42 | 3 103 | 6,56 | ||||
| 2025-05-15 | 13F | Two Sigma Securities, Llc | 0 | −100,00 | 0 | −100,00 | ||||
| 2025-08-07 | 13F | Investment Management Corp /va/ /adv | 1 600 | 0,00 | 61 | 5,26 | ||||
| 2025-07-18 | 13F | Foundry Financial Group, Inc. | 13 658 | 0,00 | 519 | 6,13 | ||||
| 2025-08-12 | 13F | Waterloo Capital, L.P. | 7 637 | 0,00 | 290 | 6,23 | ||||
| 2025-07-09 | 13F | Keystone Wealth Services, LLC | 24 483 | 12,33 | 931 | 19,23 | ||||
| 2025-05-02 | 13F | Capital A Wealth Management, LLC | 25 | 1 | ||||||
| 2025-08-12 | 13F | Leigh Baldwin & Co., Llc | 10 200 | −10,53 | 388 | −5,15 | ||||
| 2025-08-06 | 13F | Commonwealth Equity Services, Llc | 1 157 385 | 1,83 | 44 | 7,50 | ||||
| 2025-07-11 | 13F | Cypress Financial Planning Llc | 11 253 | 2,56 | 428 | 8,65 | ||||
| 2025-06-24 | NP | Innovator ETFs Trust - Innovator Laddered Fund of U.S. Equity Power Buffer ETFs | 1 347 819 | 13,00 | 48 104 | 8,65 | ||||
| 2025-07-18 | 13F | Truist Financial Corp | 92 903 | −1,58 | 3 531 | 4,44 | ||||
| 2025-07-21 | 13F | DHJJ Financial Advisors, Ltd. | 17 329 | −0,77 | 659 | 5,28 | ||||
| 2025-07-31 | 13F | Orion Capital Management LLC | 22 097 | −4,33 | 840 | 1,45 | ||||
| 2025-08-11 | 13F | Atlantic Private Wealth, LLC | 4 006 | 152 | ||||||
| 2025-07-10 | 13F | Family Legacy Financial Solutions, LLC | 700 | 27 | ||||||
| 2025-08-14 | 13F | Susquehanna International Group, Llp | 7 268 | −78,72 | 276 | −77,43 | ||||
| 2025-08-14 | 13F | Raymond James Financial Inc | 378 339 | −4,31 | 14 381 | 1,54 | ||||
| 2025-08-05 | 13F | Milestone Asset Management, Llc | 5 816 | 0,00 | 221 | 6,25 | ||||
| 2025-08-14 | 13F | Talon Private Wealth, LLC | 50 874 | −7,04 | 1 934 | −1,38 | ||||
| 2025-07-17 | 13F | City Holding Co | 700 | 0,00 | 27 | 4,00 | ||||
| 2025-08-06 | 13F | Atlantic Union Bankshares Corp | 5 384 | 205 | ||||||
| 2025-08-04 | 13F | JDM Financial Group LLC | 48 466 | −1,27 | 1 842 | 4,78 | ||||
| 2025-07-25 | 13F | Yarger Wealth Strategies, Llc | 75 017 | −11,44 | 2 851 | −6,03 | ||||
| 2025-07-29 | 13F | Madison Wealth Partners, Inc | 6 319 | 0,00 | 240 | 6,19 | ||||
| 2025-07-10 | 13F | Wealth Enhancement Advisory Services, Llc | 394 589 | −6,95 | 15 081 | −0,71 | ||||
| 2025-05-01 | 13F | Quest 10 Wealth Builders, Inc. | 5 774 | −34,96 | 207 | −36,81 | ||||
| 2025-08-05 | 13F | Lord & Richards Wealth Management, LLC | 0 | −100,00 | 0 | |||||
| 2025-07-28 | 13F | WealthPlan Investment Management, LLC | 10 880 | −18,82 | 414 | −13,96 | ||||
| 2025-08-12 | 13F | Bedel Financial Consulting, Inc. | 17 736 | 0,00 | 674 | 6,14 | ||||
| 2025-08-19 | 13F | Cape Investment Advisory, Inc. | 25 400 | −1,93 | 965 | 4,10 | ||||
| 2025-08-14 | 13F | Mml Investors Services, Llc | 72 669 | 4,98 | 3 | 0,00 | ||||
| 2025-07-10 | 13F | Focus Financial Network, Inc. | 16 137 | −17,63 | 613 | −12,55 | ||||
| 2025-08-08 | 13F | Gts Securities Llc | 6 958 | 264 | ||||||
| 2025-07-17 | 13F | Clay Northam Wealth Management, LLC | 5 500 | 209 | ||||||
| 2025-07-31 | 13F | Pinnacle Wealth Management Group, Inc. | 37 271 | −1,32 | 1 417 | 4,73 | ||||
| 2025-04-14 | 13F | ARS Wealth Advisors Group, LLC | 0 | −100,00 | 0 | |||||
| 2025-08-13 | 13F | Grantvest Financial Group LLC | 9 249 | 49,20 | 352 | 58,11 | ||||
| 2025-08-04 | 13F | Assetmark, Inc | 37 | −52,56 | 1 | −50,00 | ||||
| 2025-07-28 | 13F | Cornerstone Wealth Group, LLC | 31 993 | 0,00 | 1 216 | 6,20 | ||||
| 2025-08-14 | 13F | GWM Advisors LLC | 31 991 | −10,60 | 1 216 | −5,15 | ||||
| 2025-08-04 | 13F | Spire Wealth Management | 13 702 | −8,39 | 521 | −2,80 | ||||
| 2025-08-15 | 13F | Captrust Financial Advisors | 0 | −100,00 | 0 | |||||
| 2025-07-08 | 13F | Ptm Wealth Management, Llc | 17 075 | −5,10 | 653 | 8,31 | ||||
| 2025-08-04 | 13F | Pensionmark Financial Group, Llc | 158 530 | 26,12 | 6 026 | 33,83 | ||||
| 2025-08-12 | 13F | Calton & Associates, Inc. | 6 595 | 0,00 | 251 | 5,93 | ||||
| 2025-08-08 | 13F | Foundations Investment Advisors, LLC | 36 419 | 44,47 | 1 384 | 53,44 | ||||
| 2025-07-22 | 13F | Diligent Investors, LLC | 54 470 | 0,00 | 2 070 | 6,10 | ||||
| 2025-08-01 | 13F | PCA Investment Advisory Services Inc. | 31 406 | 0,00 | 1 194 | 6,14 | ||||
| 2025-07-21 | 13F | Keystone Financial Group, Inc. | 13 922 | −4,86 | 534 | 1,72 | ||||
| 2025-08-14 | 13F | Old Mission Capital Llc | 512 215 | 3 816,62 | 19 469 | 4 060,04 | ||||
| 2025-07-21 | 13F | Seros Financial, LLC | 14 450 | 0,00 | 549 | 6,19 | ||||
| 2025-07-16 | 13F | PFS Partners, LLC | 1 200 | 46 | ||||||
| 2025-08-12 | 13F | New Republic Capital, LLC | 13 548 | 0,00 | 515 | 5,98 | ||||
| 2025-07-28 | 13F | Sagespring Wealth Partners, Llc | 8 535 | 5,71 | 324 | 12,11 | ||||
| 2025-08-14 | 13F | First Commonwealth Financial Corp /pa/ | 16 258 | 11,39 | 618 | 18,20 | ||||
| 2025-07-29 | 13F | Stratos Wealth Advisors, LLC | 49 224 | 0,00 | 1 871 | 6,13 | ||||
| 2025-08-07 | 13F | Lakeridge Wealth Management LLC | 18 930 | 10,51 | 720 | 17,29 | ||||
| 2025-08-08 | 13F | Capital Investment Advisory Services, LLC | 4 056 | 1,25 | 154 | 7,69 | ||||
| 2025-07-31 | 13F | Cambridge Investment Research Advisors, Inc. | 106 785 | −11,38 | 4 | 0,00 | ||||
| 2025-07-09 | 13F | Lineweaver Wealth Advisors, LLC | 37 785 | 0,00 | 1 436 | 6,13 | ||||
| 2025-08-11 | 13F | Outlook Wealth Advisors, LLC | 7 383 | −86,00 | 281 | −85,17 | ||||
| 2025-07-25 | 13F | Hazlett, Burt & Watson, Inc. | 3 435 | 0,00 | 0 | |||||
| 2025-07-30 | 13F | Brookstone Capital Management | 989 111 | −2,11 | 37 596 | 3,88 | ||||
| 2025-08-13 | 13F | Cresset Asset Management, LLC | 39 340 | −0,00 | 1 495 | 6,10 | ||||
| 2025-07-21 | 13F | Patriot Financial Group Insurance Agency, LLC | 35 937 | 2,57 | 1 366 | 8,76 | ||||
| 2025-08-01 | 13F | Envestnet Asset Management Inc | 218 876 | 1,86 | 8 319 | 8,08 | ||||
| 2025-07-25 | 13F | Mitchell Capital Management Co | 0 | −100,00 | 0 | |||||
| 2025-08-08 | 13F | Wealth Alliance | 49 945 | 0,00 | 1 898 | 6,09 | ||||
| 2025-08-12 | 13F | LPL Financial LLC | 222 140 | 4,23 | 8 444 | 10,60 | ||||
| 2025-08-15 | 13F | Kestra Advisory Services, LLC | 331 289 | −0,88 | 12 592 | 5,18 | ||||
| 2025-07-28 | 13F | Harbour Investments, Inc. | 8 736 | 12,74 | 332 | 19,86 | ||||
| 2025-07-22 | 13F | Belpointe Asset Management LLC | 33 135 | −4,85 | 1 259 | 0,96 | ||||
| 2025-07-28 | 13F | Mutual Advisors, LLC | 6 921 | −3,58 | 268 | 4,71 | ||||
| 2025-07-30 | 13F | Evermay Wealth Management Llc | 3 657 | 0,00 | 139 | 6,92 | ||||
| 2025-08-07 | 13F | Allworth Financial LP | 3 711 | 0,00 | 141 | 7,63 | ||||
| 2025-04-10 | 13F | Whipplewood Advisors, LLC | 0 | −100,00 | 0 | |||||
| 2025-07-25 | 13F | We Are One Seven, LLC | 18 881 | 718 | ||||||
| 2025-08-07 | 13F | Resources Investment Advisors, LLC. | 72 853 | 166,27 | 2 769 | 182,55 | ||||
| 2025-08-01 | 13F | FSA Advisors, Inc. | 38 991 | −15,60 | 1 482 | −10,40 | ||||
| 2025-08-12 | 13F | SRS Capital Advisors, Inc. | 8 097 | 12,77 | 308 | 19,46 | ||||
| 2025-08-14 | 13F | Colony Group, LLC | 53 235 | 42,16 | 2 023 | 50,86 | ||||
| 2025-07-14 | 13F | AdvisorNet Financial, Inc | 1 498 | −16,69 | 57 | −12,50 | ||||
| 2025-08-01 | 13F | Corrado Advisors, Llc | 28 822 | −0,29 | 1 096 | 5,80 | ||||
| 2025-08-14 | 13F | Sunbelt Securities, Inc. | 8 047 | 60,94 | 296 | 65,36 | ||||
| 2025-08-12 | 13F | MAI Capital Management | 78 344 | −4,77 | 2 978 | 1,05 | ||||
| 2025-07-28 | 13F | RFG Advisory, LLC | 0 | −100,00 | 0 | |||||
| 2025-08-11 | 13F | Bellwether Advisors, LLC | 53 542 | 106,94 | 2 035 | 119,76 | ||||
| 2025-08-05 | 13F | Mma Asset Management Llc | 10 153 | 386 | ||||||
| 2025-07-23 | 13F | Trifecta Capital Advisors, LLC | 541 | 0,00 | 21 | 5,26 | ||||
| 2025-07-03 | 13F | Fiduciary Financial Group, Llc | 9 106 | 29,51 | 346 | 42,56 | ||||
| 2025-07-28 | 13F | Elmwood Wealth Management, Inc. | 18 910 | 719 | ||||||
| 2025-07-09 | 13F | Tounjian Advisory Partners, Llc | 11 352 | −0,86 | 407 | −0,98 | ||||
| 2025-08-05 | 13F | WorthPointe, LLC | 47 019 | −7,57 | 1 787 | −1,92 | ||||
| 2025-04-15 | 13F | Noble Wealth Management PBC | 26 327 | 943 | ||||||
| 2025-08-05 | 13F | Sigma Planning Corp | 5 477 | −94,69 | 208 | −94,37 | ||||
| 2025-08-04 | 13F | Arkadios Wealth Advisors | 19 987 | 9,72 | 760 | 16,41 | ||||
| 2025-07-17 | 13F | Wagner Wealth Management, Llc | 2 000 | 0,00 | 76 | 7,04 | ||||
| 2025-08-14 | 13F | Sequent Planning LLC | 8 564 | 0,00 | 326 | 6,21 | ||||
| 2025-08-15 | 13F | Morgan Stanley | 4 272 | 2 427,81 | 162 | 2 600,00 | ||||
| 2025-07-14 | 13F | Kfg Wealth Management, Llc | 69 594 | −1,16 | 2 645 | 4,88 | ||||
| 2025-08-11 | 13F | WPWealth LLP | 10 194 | −35,13 | 387 | −31,14 | ||||
| 2025-08-14 | 13F | Kovitz Investment Group Partners, LLC | 340 090 | 3,31 | 12 927 | 9,63 | ||||
| 2025-07-10 | 13F | Three Seasons Wealth, LLC | 12 055 | 0,00 | 458 | 6,26 | ||||
| 2025-07-23 | 13F | Castle Rock Wealth Management, LLC | 99 861 | −5,37 | 3 842 | 1,53 | ||||
| 2025-08-14 | 13F | Mercer Global Advisors Inc /adv | 52 435 | −3,22 | 1 993 | 2,73 | ||||
| 2025-04-22 | 13F | Castleview Partners, Llc | 0 | −100,00 | 0 | |||||
| 2025-07-10 | 13F | Atticus Wealth Management, Llc | 34 596 | 0,00 | 1 315 | 6,05 | ||||
| 2025-08-14 | 13F | Aqr Capital Management Llc | 6 622 | −69,59 | 252 | −67,82 | ||||
| 2025-05-15 | 13F | Hrt Financial Lp | 0 | −100,00 | 0 | |||||
| 2025-08-05 | 13F | Bank Of Montreal /can/ | 676 | 0,00 | 26 | 4,17 | ||||
| 2025-08-04 | 13F | Creative Financial Designs Inc /adv | 9 800 | −1,21 | 372 | 4,79 | ||||
| 2025-08-13 | 13F | Continuum Advisory, LLC | 30 835 | 64,46 | 1 172 | 74,66 | ||||
| 2025-08-13 | 13F | EverSource Wealth Advisors, LLC | 316 | 0,00 | 12 | 9,09 | ||||
| 2025-07-14 | 13F | Chris Bulman Inc | 73 300 | 0,89 | 2 786 | 7,07 | ||||
| 2025-07-17 | 13F | Global Trust Asset Management, LLC | 7 000 | 0,00 | 266 | 6,40 | ||||
| 2025-08-14 | 13F | Alliancebernstein L.p. | 3 674 042 | −1,12 | 139 650 | 4,93 | ||||
| 2025-07-31 | 13F | Cardinal Point Capital Management, ULC | 7 190 | 0,00 | 273 | 6,23 | ||||
| 2025-08-12 | 13F | Jpmorgan Chase & Co | 4 340 | 38,35 | 165 | 46,43 | ||||
| 2025-07-22 | 13F | Miracle Mile Advisors, LLC | 36 766 | 0,00 | 1 397 | 6,16 | ||||
| 2025-07-24 | 13F | IFP Advisors, Inc | 54 956 | 2,70 | 2 089 | 8,98 | ||||
| 2025-08-12 | 13F | Coldstream Capital Management Inc | 0 | −100,00 | 0 | |||||
| 2025-08-12 | 13F | Tradition Wealth Management, LLC | 70 727 | −4,90 | 2 688 | 0,90 | ||||
| 2025-05-22 | 13F | Mattson Financial Services, LLC | 0 | −100,00 | 0 | |||||
| 2025-08-29 | 13F | Evolution Wealth Management Inc. | 1 250 | 48 | ||||||
| 2025-07-17 | 13F | Janney Montgomery Scott LLC | 66 805 | 1,17 | 3 | 0,00 | ||||
| 2025-08-15 | 13F | Chapman Financial Group, Llc | 28 712 | 40,88 | 1 091 | 45,66 | ||||
| 2025-08-07 | 13F | Runnymede Capital Advisors, Inc. | 0 | −100,00 | 0 | |||||
| 2025-08-13 | 13F | Capital Analysts, Inc. | 13 438 | 0,00 | 1 | |||||
| 2025-08-19 | 13F | Advisory Services Network, LLC | 60 971 | 0,00 | 2 351 | 7,70 | ||||
| 2025-08-08 | 13F | Kingsview Wealth Management, LLC | 39 018 | −0,13 | 1 483 | 6,00 | ||||
| 2025-08-14 | 13F | UBS Group AG | 7 141 | 271 | ||||||
| 2025-08-12 | 13F | Wood Tarver Financial Group, LLC | 12 785 | −49,34 | 0 | −100,00 | ||||
| 2025-07-29 | 13F | Chicago Partners Investment Group LLC | 12 219 | −3,12 | 471 | 4,20 | ||||
| 2025-08-13 | 13F | Cerity Partners LLC | 26 640 | 23,11 | 1 013 | 30,58 | ||||
| 2025-07-15 | 13F | BCS Wealth Management | 148 327 | −3,57 | 6 | 0,00 | ||||
| 2025-08-05 | 13F | Huntington National Bank | 10 | |||||||
| 2025-08-14 | 13F | Diversify Advisory Services, LLC | 45 219 | −4,84 | 1 759 | 3,78 | ||||
| 2025-08-11 | 13F | HighTower Advisors, LLC | 176 465 | 13,06 | 6 707 | 19,98 | ||||
| 2025-07-21 | 13F | Triad Wealth Partners, LLC | 14 171 | −3,44 | 539 | 2,48 | ||||
| 2025-07-02 | 13F | HBW Advisory Services LLC | 18 992 | −1,67 | 722 | 4,34 | ||||
| 2025-07-14 | 13F | Southland Equity Partners LLC | 176 060 | 7,10 | 6 692 | 13,65 | ||||
| 2025-07-29 | 13F | Straight Path Wealth Management | 16 644 | 0,00 | 633 | 6,04 | ||||
| 2025-08-13 | 13F | Transce3nd, LLC | 0 | −100,00 | 0 | |||||
| 2025-07-24 | 13F | Bernard Wealth Management Corp. | 1 074 | −12,54 | 41 | −6,98 | ||||
| 2025-07-21 | 13F | Catalina Capital Group, LLC | 8 004 | 0,00 | 304 | 6,29 | ||||
| 2025-08-08 | 13F | Cetera Investment Advisers | 252 398 | 0,81 | 9 594 | 6,98 | ||||
| 2025-07-22 | 13F | DAVENPORT & Co LLC | 5 338 | 203 | ||||||
| 2025-08-13 | 13F | Townsquare Capital Llc | 0 | −100,00 | 0 | |||||
| 2025-08-14 | 13F | Mariner, LLC | 12 924 | 0,00 | 491 | 6,28 | ||||
| 2025-07-25 | 13F | Sequoia Financial Advisors, LLC | 38 973 | −29,41 | 1 481 | −25,09 | ||||
| 2025-08-08 | 13F | Creative Planning | 0 | −100,00 | 0 | |||||
| 2025-07-08 | 13F | Gradient Investments LLC | 0 | −100,00 | 0 | |||||
| 2025-07-22 | 13F | Beacon Financial Advisory LLC | 10 842 | 25,46 | 412 | 33,33 | ||||
| 2025-07-30 | 13F | IMG Wealth Management, Inc. | 1 574 | 60 | ||||||
| 2025-07-29 | 13F | BKD Wealth Advisors, LLC | 79 532 | −3,39 | 3 023 | 2,54 | ||||
| 2025-08-05 | 13F | BCGM Wealth Management, LLC | 19 693 | 0,00 | 749 | 6,10 | ||||
| 2025-08-06 | 13F | Bullseye Investment Management, LLC | 23 006 | 0,00 | 824 | 0,00 | ||||
| 2025-07-21 | 13F | Ameritas Advisory Services, LLC | 470 | −92,81 | 18 | −92,74 | ||||
| 2025-07-11 | 13F | Farther Finance Advisors, LLC | 124 769 | 352,78 | 4 742 | 378,51 | ||||
| 2025-07-22 | 13F | Berkshire Money Management, Inc. | 1 621 | 62 | ||||||
| 2025-08-12 | 13F | Change Path, LLC | 41 849 | −1,20 | 1 591 | 4,81 | ||||
| 2025-08-08 | 13F | Emerald Investment Partners, Llc | 7 481 | −1,12 | 284 | 4,80 | ||||
| 2025-07-24 | 13F | Riverchase Wealth Management, Llc | 55 663 | 0,00 | 2 116 | 6,12 | ||||
| 2025-08-01 | 13F | Stuart Chaussee & Associates, Inc. | 11 365 | 432 | ||||||
| 2025-08-19 | 13F | National Asset Management, Inc. | 0 | −100,00 | 0 | |||||
| 2025-08-15 | 13F | Tower Research Capital LLC (TRC) | 162 | 6 | ||||||
| 2025-05-14 | 13F | Delta Investment Management, LLC | 0 | −100,00 | 0 | |||||
| 2025-08-14 | 13F | Certified Advisory Corp | 24 037 | −1,42 | 914 | 4,58 | ||||
| 2025-08-12 | 13F | Archer Investment Corp | 37 400 | −27,24 | 1 422 | −22,81 | ||||
| 2025-08-13 | 13F | Luminist Capital LLC | 0 | −100,00 | 0 | |||||
| 2025-07-30 | 13F | Phoenix Holdings Ltd. | 14 375 | 0,00 | 546 | 6,23 | ||||
| 2025-08-13 | 13F | RK Capital Management, LLC/FL | 324 093 | 0,00 | 12 319 | 6,11 | ||||
| 2025-08-14 | 13F | Benjamin Edwards Inc | 12 513 | 1,07 | 476 | 7,22 | ||||
| 2025-08-11 | 13F | Principal Securities, Inc. | 5 136 | 77,35 | 195 | 83,96 | ||||
| 2025-08-12 | 13F | Weaver Consulting Group | 103 870 | 0,10 | 3 948 | 6,21 | ||||
| 2025-07-22 | 13F | BridgePort Financial Solutions, LLC | 0 | −100,00 | 0 | |||||
| 2025-08-14 | 13F/A | Barclays Plc | 1 994 | 0 | ||||||
| 2025-08-08 | 13F | Firestone Capital Management | 8 917 | 0,00 | 339 | 5,96 | ||||
| 2025-08-12 | 13F | Winnow Wealth Llc | 0 | 0 | ||||||
| 2025-07-28 | 13F | Axxcess Wealth Management, Llc | 14 585 | 0,00 | 554 | 6,13 | ||||
| 2025-07-24 | 13F | Blair William & Co/il | 229 649 | 0,52 | 8 729 | 6,66 | ||||
| 2025-09-04 | 13F/A | Advisor Group Holdings, Inc. | 1 155 859 | 59,92 | 43 934 | 69,70 | ||||
| 2025-08-11 | 13F | Anfield Capital Management, LLC | 345 | 13 | ||||||
| 2025-08-14 | 13F | Betterment LLC | 11 130 | −6,86 | 0 | |||||
| 2025-07-23 | 13F | Guild Investment Management, Inc. | 124 345 | 203,28 | 4 726 | 221,93 | ||||
| 2025-07-14 | 13F | CRA Financial Services, LLC | 28 800 | 0,00 | 1 095 | 6,11 | ||||
| 2025-08-13 | 13F | Beacon Pointe Advisors, LLC | 176 143 | −8,19 | 6 695 | −2,58 | ||||
| 2025-05-09 | 13F | Rps Advisory Solutions Llc | 0 | −100,00 | 0 | −100,00 |