Grunnleggende statistikk
| Institusjonelle eiere | 127 total, 127 long only, 0 short only, 0 long/short - change of −3,05% MRQ |
| Gjennomsnittlig porteføljeallokering | 0.0988 % - change of 2,12% MRQ |
| Institusjonelle aksjer (Long) | 8 383 991 (ex 13D/G) - change of −0,14MM shares −1,63% MRQ |
| Institusjonell verdi (Long) | $ 293 464 USD ($1000) |
Institusjonelt eierskap og aksjonærer
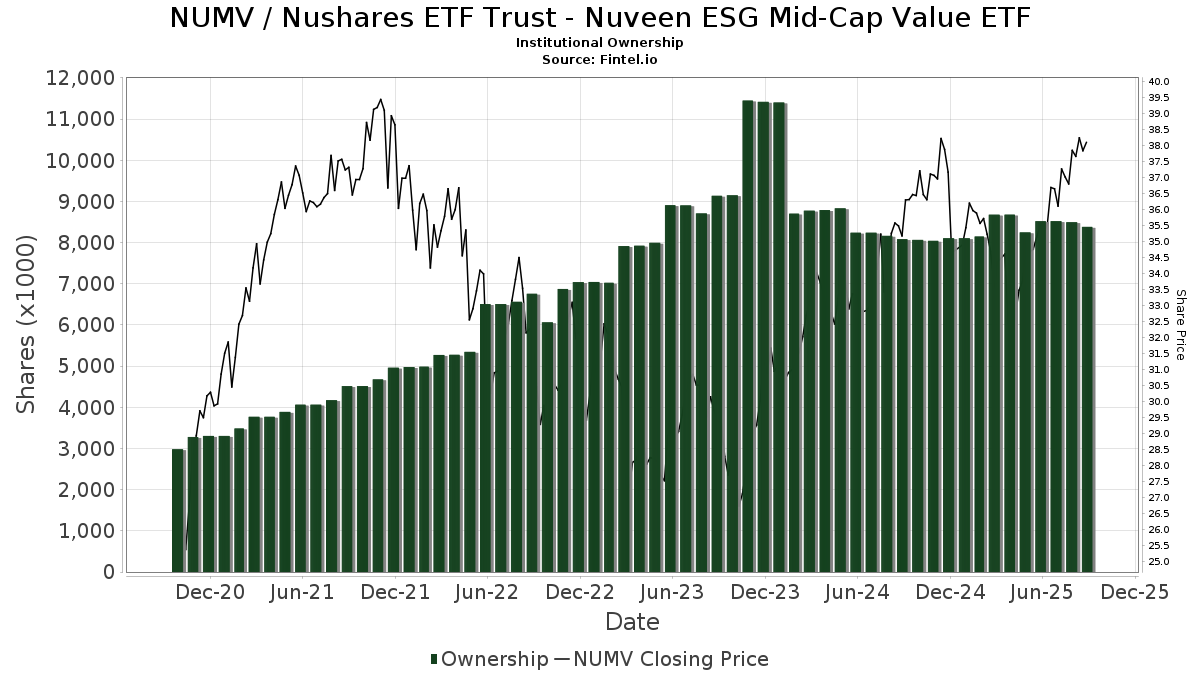
Nushares ETF Trust - Nuveen ESG Mid-Cap Value ETF (US:NUMV) har 127 institusjonelle eiere og aksjonærer som har sendt inn 13D/G- eller 13F-skjemaer til Securities Exchange Commission (SEC). Disse institusjonene eier til sammen 8,383,991 aksjer. De største aksjonærene inkluderer Morgan Stanley, Tiaa Trust, National Association, Abacus Wealth Partners, LLC, LPL Financial LLC, Royal Bank Of Canada, Raymond James Financial Inc, Bank of New York Mellon Corp, Bank Of America Corp /de/, UBS Group AG, and Empirical Financial Services, LLC d.b.a. Empirical Wealth Management .
Nushares ETF Trust - Nuveen ESG Mid-Cap Value ETF (BATS:NUMV) institusjonell eierstruktur viser nåværende posisjoner i selskapet fordelt på institusjoner og fond, samt de siste endringene i posisjonsstørrelse. De største aksjonærene kan være individuelle investorer, verdipapirfond, hedgefond eller institusjoner. Schedule 13D indikerer at investoren eier (eller har eid) mer enn 5 % av selskapet og har til hensikt (eller hadde til hensikt) å aktivt forfølge en endring i forretningsstrategien. Schedule 13G indikerer en passiv investering på over 5 %.
The share price as of September 10, 2025 is 38,09 / share. Previously, on September 11, 2024, the share price was 35,17 / share. This represents an increase of 8,30% over that period.
Fondssentiment-score
Fondssentiment Score (også kjent som akkumulering av eierskap poengsum) viser hvilke aksjer som er mest kjøpt av fond. Den er resultatet av en sofistikert, kvantitativ flerfaktormodell som identifiserer selskaper med de høyeste nivåene av institusjonell akkumulering. Beregningsmodellen for poeng bruker en kombinasjon av den totale økningen i antall offentliggjorte eiere, endringer i porteføljeallokeringen til disse eierne og andre beregninger. Tallet går fra 0 til 100, der høyere tall indikerer en høyere grad av akkumulering i forhold til sammenlignbare selskaper, der 50 er gjennomsnittet.
Oppdateringsfrekvens: Daglig
Sjekk ut Ownership Explorer, som inneholder en liste over de høyest rangerte selskapene.
Institusjonell Put/Call-forhold
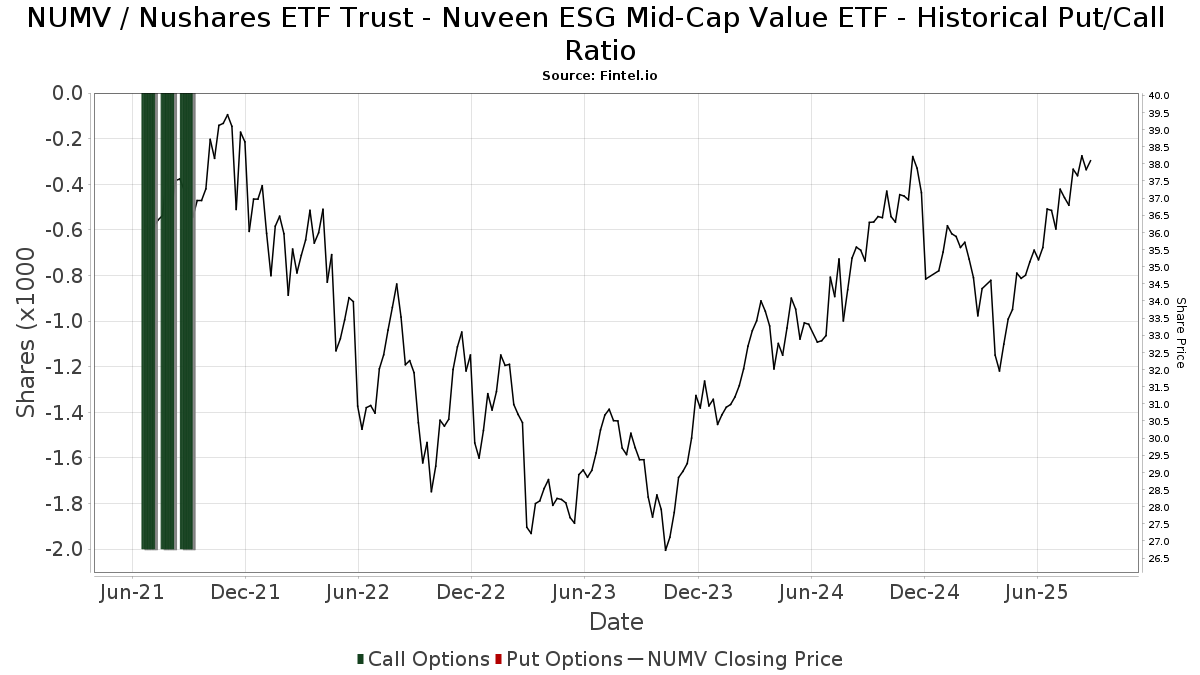
I tillegg til å rapportere standard aksje- og gjeldsemisjoner må institusjoner med mer enn 100 millioner kroner i forvaltningskapital også oppgi beholdningen av put- og callopsjoner. Siden put-opsjoner generelt indikerer et negativt sentiment, og call-opsjoner indikerer et positivt sentiment, kan vi få et inntrykk av det generelle institusjonelle sentimentet ved å plotte forholdet mellom put- og call-opsjoner. Diagrammet til høyre viser det historiske forholdet mellom put- og call-opsjoner for dette instrumentet.
Ved å bruke Put/Call-forholdet som en indikator på investorsentimentet kan man overvinne en av de viktigste svakhetene ved å bruke totalt institusjonelt eierskap, nemlig at en betydelig andel av forvaltningskapitalen investeres passivt for å følge indekser. Passivt forvaltede fond kjøper vanligvis ikke opsjoner, slik at indikatoren for put/call-forhold i større grad gjenspeiler stemningen i aktivt forvaltede fond.
13F- og NPORT-arkiveringer
Detaljer om 13F-arkiveringer er gratis. Detaljer om NP-arkiveringer krever et premium-medlemskap. Grønne rader indikerer nye posisjoner. Røde rader indikerer lukkede posisjoner. Klikk på lenke ikonet for å se hele transaksjonshistorikken.
Oppgrader
for å låse opp premiedata og eksportere til Excel. ![]() .
.
| Fildato | Kilde | Investor | Type | Gjennomsnittlig pris (estimert) |
Aksjer | Δ Aksjer (%) |
Rapportert verdi ($1000) | Verdi (%) | Portallokering (%) | |
|---|---|---|---|---|---|---|---|---|---|---|
| 2025-08-13 | 13F | Millstone Evans Group, LLC | 519 | 0,00 | 19 | 5,88 | ||||
| 2025-08-14 | 13F | Comerica Bank | 1 833 | −39,54 | 66 | −35,92 | ||||
| 2025-08-12 | 13F | LPL Financial LLC | 547 029 | 2,93 | 19 720 | 8,46 | ||||
| 2025-08-07 | 13F | Allworth Financial LP | 256 | 0,00 | 9 | 12,50 | ||||
| 2025-08-08 | 13F | Cetera Investment Advisers | 44 774 | −4,88 | 1 614 | 0,25 | ||||
| 2025-08-11 | 13F | Annis Gardner Whiting Capital Advisors, LLC | 236 | 3,96 | 9 | 14,29 | ||||
| 2025-07-24 | 13F | IFP Advisors, Inc | 217 | 102,80 | 8 | 133,33 | ||||
| 2025-08-12 | 13F | Proequities, Inc. | 0 | 0 | ||||||
| 2025-07-15 | 13F | McAdam, LLC | 6 992 | 8,44 | 252 | 14,55 | ||||
| 2025-08-05 | 13F | GPS Wealth Strategies Group, LLC | 61 | 0,00 | 2 | 0,00 | ||||
| 2025-08-06 | 13F | SOUTH STATE Corp | 17 | 0,00 | 1 | |||||
| 2025-04-22 | 13F | Synergy Financial Management, LLC | 0 | −100,00 | 0 | |||||
| 2025-07-25 | 13F | NorthRock Partners, LLC | 56 | 0,00 | 2 | 100,00 | ||||
| 2025-08-14 | 13F | UBS Group AG | 278 749 | 4,58 | 10 049 | 10,20 | ||||
| 2025-08-08 | 13F | ERTS Wealth Advisors, LLC | 0 | −100,00 | 0 | |||||
| 2025-07-21 | 13F | Empirical Financial Services, LLC d.b.a. Empirical Wealth Management | 256 110 | −0,23 | 9 233 | 5,14 | ||||
| 2025-07-25 | 13F | Fifth Third Wealth Advisors LLC | 10 720 | 0,00 | 386 | 5,46 | ||||
| 2025-07-25 | 13F | Concord Wealth Partners | 821 | −76,09 | 30 | −75,21 | ||||
| 2025-07-16 | 13F | Falcon Wealth Planning | 7 269 | 10,17 | 262 | 16,44 | ||||
| 2025-08-26 | 13F/A | Thrivent Financial For Lutherans | 12 057 | −77,83 | 0 | −100,00 | ||||
| 2025-07-16 | 13F/A | CX Institutional | 6 447 | −5,21 | 0 | |||||
| 2025-08-12 | 13F | O'shaughnessy Asset Management, Llc | 14 | 0,00 | 1 | |||||
| 2025-08-13 | 13F | SageView Advisory Group, LLC | 14 500 | 0,00 | 540 | 8,67 | ||||
| 2025-08-13 | 13F | Jones Financial Companies Lllp | 96 611 | 9,36 | 3 460 | 15,38 | ||||
| 2025-08-14 | 13F | Bank Of America Corp /de/ | 303 998 | −0,01 | 10 959 | 5,36 | ||||
| 2025-08-08 | 13F | Pnc Financial Services Group, Inc. | 28 713 | −4,70 | 1 035 | 0,49 | ||||
| 2025-07-09 | 13F | Dynamic Advisor Solutions LLC | 41 661 | −20,18 | 1 502 | −15,91 | ||||
| 2025-08-14 | 13F | Citadel Advisors Llc | 13 446 | 485 | ||||||
| 2025-07-30 | 13F | Fingerlakes Wealth Management, Inc. | 18 438 | 1,65 | 665 | 7,10 | ||||
| 2025-08-12 | 13F | MAI Capital Management | 530 | 1,53 | 19 | 11,76 | ||||
| 2025-08-15 | 13F | Equitable Holdings, Inc. | 7 660 | 18,69 | 276 | 25,45 | ||||
| 2025-08-14 | 13F | Mariner, LLC | 26 120 | 0,00 | 942 | 5,38 | ||||
| 2025-08-14 | 13F | Susquehanna International Group, Llp | 41 847 | 183,98 | 1 509 | 199,21 | ||||
| 2025-07-29 | 13F | Harbor Asset Planning, Inc. | 318 | 11 | ||||||
| 2025-07-17 | 13F | Neumann Capital Management, LLC | 15 560 | 0,00 | 561 | 5,26 | ||||
| 2025-08-12 | 13F | Investor's Fiduciary Advisor Network, LLC | 7 852 | 0 | ||||||
| 2025-07-31 | 13F | Cambridge Investment Research Advisors, Inc. | 11 615 | −1,01 | 0 | |||||
| 2025-08-14 | 13F | Wiley Bros.-aintree Capital, Llc | 17 566 | 0,00 | 633 | 6,21 | ||||
| 2025-08-14 | 13F | Raymond James Financial Inc | 538 787 | 3,94 | 19 423 | 9,53 | ||||
| 2025-07-15 | 13F | RTD Financial Advisors, Inc. | 24 825 | −3,98 | 895 | 1,13 | ||||
| 2025-05-07 | 13F | Vista Private Wealth Partners. LLC | 0 | −100,00 | 0 | |||||
| 2025-07-08 | 13F | Parallel Advisors, LLC | 1 018 | 19,34 | 37 | 24,14 | ||||
| 2025-08-06 | 13F | Simmons Bank | 11 066 | −2,34 | 399 | 2,84 | ||||
| 2025-08-05 | 13F | Tiaa Trust, National Association | 1 004 386 | −17,57 | 36 208 | −13,13 | ||||
| 2025-07-29 | 13F | Private Trust Co Na | 0 | −100,00 | 0 | |||||
| 2025-08-14 | 13F | Stage Harbor Financial, Llc | 6 473 | −25,02 | 233 | −21,02 | ||||
| 2025-08-13 | 13F | Beacon Pointe Advisors, LLC | 139 271 | −0,68 | 5 021 | 4,65 | ||||
| 2025-07-31 | 13F | Opes Wealth Management LLC | 38 115 | 0,40 | 1 374 | 5,86 | ||||
| 2025-07-28 | 13F | Revolve Wealth Partners, LLC | 27 485 | 2,02 | 991 | 7,49 | ||||
| 2025-07-29 | 13F | Private Wealth Management Group, LLC | 9 491 | 1,38 | 342 | 6,88 | ||||
| 2025-08-07 | 13F | CENTRAL TRUST Co | 13 550 | −11,27 | 488 | −6,51 | ||||
| 2025-08-13 | 13F | WCG Wealth Advisors LLC | 35 710 | 0,74 | 1 287 | 6,19 | ||||
| 2025-08-13 | 13F | Northwestern Mutual Wealth Management Co | 29 298 | 12,08 | 1 056 | 18,12 | ||||
| 2025-08-14 | 13F | Fmr Llc | 1 373 | 17,55 | 49 | 25,64 | ||||
| 2025-08-07 | 13F | McClarren Financial Advisors, Inc. | 0 | −100,00 | 0 | |||||
| 2025-08-14 | 13F | Betterment LLC | 8 225 | 25,67 | 0 | |||||
| 2025-08-06 | 13F | AE Wealth Management LLC | 0 | −100,00 | 0 | |||||
| 2025-04-30 | 13F | Stratos Wealth Advisors, LLC | 0 | −100,00 | 0 | |||||
| 2025-07-07 | 13F | Trust Co | 9 744 | −4,68 | 351 | 0,57 | ||||
| 2025-08-11 | 13F | Heritage Wealth Advisors | 25 648 | −5,17 | 925 | −0,11 | ||||
| 2025-08-01 | 13F | Envestnet Asset Management Inc | 100 714 | −0,47 | 3 631 | 4,88 | ||||
| 2025-07-16 | 13F | Evergreen Private Wealth LLC | 9 677 | −16,40 | 349 | −11,90 | ||||
| 2025-08-15 | 13F | Morgan Stanley | 1 463 546 | 2,13 | 52 761 | 7,63 | ||||
| 2025-08-13 | 13F | Lido Advisors, LLC | 11 762 | −59,73 | 424 | −57,56 | ||||
| 2025-07-17 | 13F | LexAurum Advisors, LLC | 12 721 | 0,32 | 459 | 5,77 | ||||
| 2025-08-14 | 13F | Bragg Financial Advisors, Inc | 8 611 | 4,21 | 310 | 9,93 | ||||
| 2025-08-14 | 13F | GWM Advisors LLC | 20 040 | 10,59 | 722 | 16,64 | ||||
| 2025-07-08 | 13F | Nbc Securities, Inc. | 68 | 0,00 | 0 | |||||
| 2025-08-19 | 13F | Cape Investment Advisory, Inc. | 499 | 0,00 | 18 | 0,00 | ||||
| 2025-07-21 | 13F | DHJJ Financial Advisors, Ltd. | 35 | 0,00 | 1 | 0,00 | ||||
| 2025-08-11 | 13F | Private Advisor Group, LLC | 9 325 | −9,72 | 336 | −4,82 | ||||
| 2025-05-15 | 13F | Baird Financial Group, Inc. | 0 | −100,00 | 0 | |||||
| 2025-07-11 | 13F/A | Umb Bank N A/mo | 2 183 | −31,37 | 79 | −27,78 | ||||
| 2025-08-11 | 13F | Aptus Capital Advisors, LLC | 465 | 0,00 | 17 | 6,67 | ||||
| 2025-08-13 | 13F | Flow Traders U.s. Llc | 6 589 | −28,55 | 0 | |||||
| 2025-08-04 | 13F | Assetmark, Inc | 6 680 | 108,36 | 241 | 120,18 | ||||
| 2025-07-18 | 13F | Vicus Capital | 9 643 | 0,73 | 348 | 6,12 | ||||
| 2025-07-31 | 13F | LongView Asset Management LLC | 8 032 | −11,42 | 290 | −6,77 | ||||
| 2025-08-14 | 13F | Mercer Global Advisors Inc /adv | 0 | −100,00 | 0 | |||||
| 2025-08-01 | 13F | Bessemer Group Inc | 2 909 | 0,00 | 0 | |||||
| 2025-08-13 | 13F | EverSource Wealth Advisors, LLC | 68 | 0,00 | 2 | 0,00 | ||||
| 2025-07-24 | 13F | Us Bancorp \de\ | 0 | −100,00 | 0 | |||||
| 2025-09-04 | 13F/A | Advisor Group Holdings, Inc. | 24 747 | 27,70 | 892 | 34,59 | ||||
| 2025-08-13 | 13F | Cresset Asset Management, LLC | 26 583 | 3,40 | 958 | 8,99 | ||||
| 2025-08-14 | 13F | Evergreen Capital Management Llc | 9 246 | −2,89 | 333 | 2,46 | ||||
| 2025-08-11 | 13F | Citigroup Inc | 380 | 0,00 | 14 | 0,00 | ||||
| 2025-08-14 | 13F/A | Rockefeller Capital Management L.P. | 28 280 | 0,00 | 1 019 | 5,38 | ||||
| 2025-08-14 | 13F | EP Wealth Advisors, Inc. | 2 980 | 107 | ||||||
| 2025-07-10 | 13F | Wealth Enhancement Advisory Services, Llc | 7 482 | −3,38 | 275 | 4,17 | ||||
| 2025-08-05 | 13F | Bank of New York Mellon Corp | 446 116 | 9,51 | 16 082 | 15,40 | ||||
| 2025-07-15 | 13F | MCF Advisors LLC | 0 | −100,00 | 0 | |||||
| 2025-07-22 | 13F | DT Investment Partners, LLC | 175 | −15,46 | 6 | −14,29 | ||||
| 2025-08-12 | 13F | Ameritas Investment Partners, Inc. | 1 208 | 0,00 | 44 | 4,88 | ||||
| 2025-07-08 | 13F | Canandaigua National Bank & Trust Co | 48 152 | −10,90 | 1 736 | −6,11 | ||||
| 2025-08-07 | 13F | Commerce Bank | 15 030 | −11,25 | 542 | −6,56 | ||||
| 2025-07-15 | 13F | Signet Financial Management, Llc | 6 280 | 0,00 | 226 | 5,61 | ||||
| 2025-07-15 | 13F | RVW Wealth, LLC | 17 964 | −1,55 | 648 | 3,69 | ||||
| 2025-07-09 | 13F | Bruce G. Allen Investments, LLC | 370 | 0,00 | 13 | 8,33 | ||||
| 2025-08-12 | 13F | Coldstream Capital Management Inc | 18 007 | 0,00 | 649 | 5,36 | ||||
| 2025-08-15 | 13F | CI Private Wealth, LLC | 14 818 | 118,88 | 534 | 131,17 | ||||
| 2025-05-02 | 13F | Invera Wealth Advisors, LLC | 63 582 | 0,35 | 2 175 | −5,15 | ||||
| 2025-08-06 | 13F | Commonwealth Equity Services, Llc | 150 875 | −11,76 | 5 | 0,00 | ||||
| 2025-08-14 | 13F | Mml Investors Services, Llc | 8 916 | 34,08 | 0 | |||||
| 2025-04-09 | 13F | West Financial Advisors, LLC | 0 | −100,00 | 0 | |||||
| 2025-08-14 | 13F | Clarity Asset Management, Inc. | 405 | 0,00 | 15 | 7,69 | ||||
| 2025-07-30 | 13F | Crewe Advisors LLC | 401 | 0,00 | 14 | 7,69 | ||||
| 2025-07-24 | 13F | Stonebridge Financial Group, LLC | 0 | −100,00 | 0 | |||||
| 2025-07-14 | 13F | Abacus Wealth Partners, LLC | 902 286 | −3,09 | 32 527 | 2,13 | ||||
| 2025-08-13 | 13F | VestGen Advisors, LLC | 6 774 | 0,00 | 244 | 5,63 | ||||
| 2025-08-07 | 13F | Parkside Financial Bank & Trust | 18 962 | 0,00 | 684 | 5,40 | ||||
| 2025-08-14 | 13F | Fiduciary Trust Co | 89 246 | 0,00 | 3 217 | 5,37 | ||||
| 2025-08-12 | 13F | Steward Partners Investment Advisory, Llc | 2 294 | 3,10 | 83 | 7,89 | ||||
| 2025-04-21 | 13F | Nelson, Van Denburg & Campbell Wealth Management Group, LLC | 0 | −100,00 | 0 | |||||
| 2025-07-29 | 13F | Fundamentun, Llc | 11 450 | 0,00 | 413 | 5,37 | ||||
| 2025-08-12 | 13F | Global Retirement Partners, LLC | 194 | −17,09 | 7 | −25,00 | ||||
| 2025-08-07 | 13F | Addison Advisors LLC | 19 097 | −3,61 | 688 | 1,62 | ||||
| 2025-08-14 | 13F | Colony Group, LLC | 8 253 | 0,00 | 298 | 5,32 | ||||
| 2025-07-11 | 13F | Farther Finance Advisors, LLC | 2 575 | 0,00 | 93 | 4,55 | ||||
| 2025-08-08 | 13F | Creative Planning | 108 300 | 0,00 | 3 904 | 5,40 | ||||
| 2025-07-14 | 13F | AdvisorNet Financial, Inc | 259 | 0,00 | 9 | 12,50 | ||||
| 2025-07-15 | 13F | Regatta Capital Group, Llc | 36 010 | −3,20 | 1 298 | 2,04 | ||||
| 2025-07-25 | 13F | Cwm, Llc | 9 522 | 169,82 | 0 | |||||
| 2025-08-14 | 13F | Marshall Investment Management, Llc | 0 | −100,00 | 0 | |||||
| 2025-08-14 | 13F | Royal Bank Of Canada | 540 324 | −0,82 | 19 478 | 4,51 | ||||
| 2025-08-14 | 13F | Wells Fargo & Company/mn | 136 996 | 7,03 | 4 939 | 12,79 | ||||
| 2025-08-13 | 13F | Natixis Advisors, L.p. | 13 723 | 11,20 | 0 | |||||
| 2025-08-14 | 13F | Abound Financial, Llc | 7 915 | 24,53 | 285 | 31,34 | ||||
| 2025-08-15 | 13F | Tower Research Capital LLC (TRC) | 14 503 | 258,45 | 523 | 278,26 | ||||
| 2025-08-13 | 13F | IAG Wealth Partners, LLC | 634 | 0,00 | 23 | 4,76 | ||||
| 2025-08-01 | 13F | Rossby Financial, LCC | 61 | 0,00 | 2 | 0,00 | ||||
| 2025-08-11 | 13F | Principal Securities, Inc. | 869 | 0,00 | 31 | 3,33 | ||||
| 2025-08-05 | 13F | Carson Advisory Inc. | 18 970 | 0,00 | 684 | 5,40 | ||||
| 2025-08-12 | 13F | Jpmorgan Chase & Co | 15 827 | 19,97 | 571 | 26,39 | ||||
| 2025-07-30 | 13F | Greenup Street Wealth Management Llc | 6 540 | 4,11 | 236 | 9,81 | ||||
| 2025-07-22 | 13F | Wealthcare Advisory Partners LLC | 5 860 | 0,00 | 211 | 5,50 | ||||
| 2025-07-30 | 13F | Whittier Trust Co | 12 433 | 0,00 | 448 | 5,41 | ||||
| 2025-05-09 | 13F | Avalon Trust Co | 0 | −100,00 | 0 | |||||
| 2025-07-24 | 13F | rebel Financial LLC | 29 542 | 1 065 | ||||||
| 2025-08-08 | 13F | Emerald Investment Partners, Llc | 22 427 | −25,79 | 808 | −21,78 | ||||
| 2025-07-25 | 13F | Joel Adams & Associates, Inc. | 9 686 | 349 | ||||||
| 2025-07-28 | 13F | Harbour Investments, Inc. | 1 829 | 20,49 | 66 | 27,45 | ||||
| 2025-08-14 | 13F | Stifel Financial Corp | 17 473 | 2,21 | 630 | 7,71 | ||||
| 2025-08-15 | 13F | Urban Financial Advisory Corp | 682 | 0,00 | 25 | 4,35 | ||||
| 2025-08-11 | 13F | Greykasell Wealth Strategies, Inc. | 1 834 | 0,00 | 66 | 6,45 |