Grunnleggende statistikk
| Institusjonelle eiere | 155 total, 155 long only, 0 short only, 0 long/short - change of 9,15% MRQ |
| Gjennomsnittlig porteføljeallokering | 0.1209 % - change of −14,24% MRQ |
| Institusjonelle aksjer (Long) | 15 384 005 (ex 13D/G) - change of 0,93MM shares 6,47% MRQ |
| Institusjonell verdi (Long) | $ 377 736 USD ($1000) |
Institusjonelt eierskap og aksjonærer
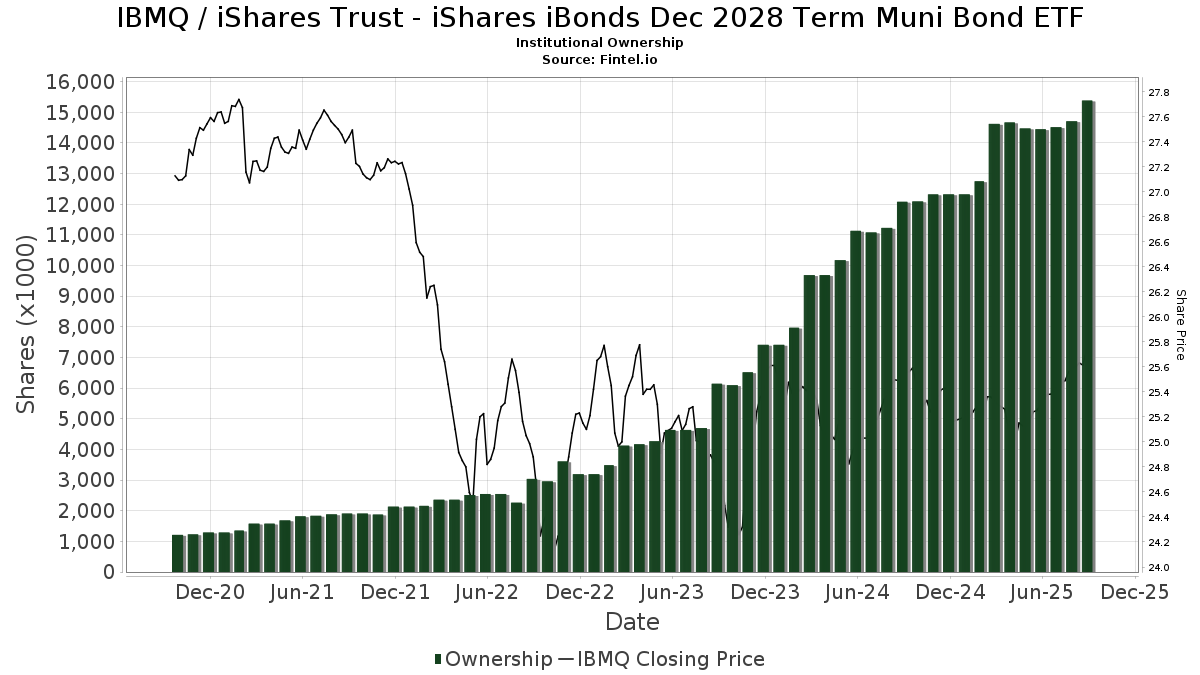
iShares Trust - iShares iBonds Dec 2028 Term Muni Bond ETF (US:IBMQ) har 155 institusjonelle eiere og aksjonærer som har sendt inn 13D/G- eller 13F-skjemaer til Securities Exchange Commission (SEC). Disse institusjonene eier til sammen 15,384,005 aksjer. De største aksjonærene inkluderer Bank Of America Corp /de/, Hartland & Co., LLC, Mercer Global Advisors Inc /adv, Envestnet Asset Management Inc, Us Bancorp \de\, HighTower Advisors, LLC, Wells Fargo & Company/mn, GWM Advisors LLC, Hengehold Capital Management Llc, and Hills Bank & Trust Co .
iShares Trust - iShares iBonds Dec 2028 Term Muni Bond ETF (BATS:IBMQ) institusjonell eierstruktur viser nåværende posisjoner i selskapet fordelt på institusjoner og fond, samt de siste endringene i posisjonsstørrelse. De største aksjonærene kan være individuelle investorer, verdipapirfond, hedgefond eller institusjoner. Schedule 13D indikerer at investoren eier (eller har eid) mer enn 5 % av selskapet og har til hensikt (eller hadde til hensikt) å aktivt forfølge en endring i forretningsstrategien. Schedule 13G indikerer en passiv investering på over 5 %.
The share price as of September 9, 2025 is 25,69 / share. Previously, on September 10, 2024, the share price was 25,53 / share. This represents an increase of 0,63% over that period.
Fondssentiment-score
Fondssentiment Score (også kjent som akkumulering av eierskap poengsum) viser hvilke aksjer som er mest kjøpt av fond. Den er resultatet av en sofistikert, kvantitativ flerfaktormodell som identifiserer selskaper med de høyeste nivåene av institusjonell akkumulering. Beregningsmodellen for poeng bruker en kombinasjon av den totale økningen i antall offentliggjorte eiere, endringer i porteføljeallokeringen til disse eierne og andre beregninger. Tallet går fra 0 til 100, der høyere tall indikerer en høyere grad av akkumulering i forhold til sammenlignbare selskaper, der 50 er gjennomsnittet.
Oppdateringsfrekvens: Daglig
Sjekk ut Ownership Explorer, som inneholder en liste over de høyest rangerte selskapene.
Institusjonell Put/Call-forhold
I tillegg til å rapportere standard aksje- og gjeldsemisjoner må institusjoner med mer enn 100 millioner kroner i forvaltningskapital også oppgi beholdningen av put- og callopsjoner. Siden put-opsjoner generelt indikerer et negativt sentiment, og call-opsjoner indikerer et positivt sentiment, kan vi få et inntrykk av det generelle institusjonelle sentimentet ved å plotte forholdet mellom put- og call-opsjoner. Diagrammet til høyre viser det historiske forholdet mellom put- og call-opsjoner for dette instrumentet.
Ved å bruke Put/Call-forholdet som en indikator på investorsentimentet kan man overvinne en av de viktigste svakhetene ved å bruke totalt institusjonelt eierskap, nemlig at en betydelig andel av forvaltningskapitalen investeres passivt for å følge indekser. Passivt forvaltede fond kjøper vanligvis ikke opsjoner, slik at indikatoren for put/call-forhold i større grad gjenspeiler stemningen i aktivt forvaltede fond.
13F- og NPORT-arkiveringer
Detaljer om 13F-arkiveringer er gratis. Detaljer om NP-arkiveringer krever et premium-medlemskap. Grønne rader indikerer nye posisjoner. Røde rader indikerer lukkede posisjoner. Klikk på lenke ikonet for å se hele transaksjonshistorikken.
Oppgrader
for å låse opp premiedata og eksportere til Excel. ![]() .
.
| Fildato | Kilde | Investor | Type | Gjennomsnittlig pris (estimert) |
Aksjer | Δ Aksjer (%) |
Rapportert verdi ($1000) | Verdi (%) | Portallokering (%) | |
|---|---|---|---|---|---|---|---|---|---|---|
| 2025-07-08 | 13F | FF Advisors,LLC | 21 309 | 3,66 | 541 | 4,84 | ||||
| 2025-08-14 | 13F | Garden State Investment Advisory Services LLC | 0 | −100,00 | 0 | |||||
| 2025-07-28 | 13F | Harbour Investments, Inc. | 294 | 0,00 | 7 | 0,00 | ||||
| 2025-07-23 | 13F | Sax Wealth Advisors, Llc | 13 241 | 336 | ||||||
| 2025-08-07 | 13F | Kestra Private Wealth Services, Llc | 8 031 | 204 | ||||||
| 2025-07-24 | 13F | Cyndeo Wealth Partners, LLC | 97 284 | −9,73 | 2 472 | −9,32 | ||||
| 2025-08-13 | 13F | Peloton Wealth Strategists | 13 000 | 0,00 | 0 | |||||
| 2025-08-13 | 13F | RIA Advisory Group LLC | 49 569 | 9,03 | 1 260 | 9,57 | ||||
| 2025-08-04 | 13F | Spinnaker Trust | 54 020 | 13,48 | 1 373 | 14,05 | ||||
| 2025-07-29 | 13F | Stratos Wealth Partners, LTD. | 28 281 | −17,44 | 719 | −17,09 | ||||
| 2025-08-08 | 13F | Hartland & Co., LLC | 891 719 | 3,39 | 22 659 | 3,88 | ||||
| 2025-07-08 | 13F | Parallel Advisors, LLC | 16 279 | 7,67 | 414 | 8,12 | ||||
| 2025-07-16 | 13F | Kathmere Capital Management, LLC | 301 088 | −45,68 | 7 651 | −45,43 | ||||
| 2025-08-12 | 13F | BlackRock, Inc. | 150 | 0,67 | 4 | 0,00 | ||||
| 2025-08-07 | 13F | Rossmore Private Capital | 13 887 | 353 | ||||||
| 2025-07-17 | 13F | Archford Capital Strategies, LLC | 13 065 | 4,74 | 332 | 5,08 | ||||
| 2025-08-11 | 13F | Arrow Financial Corp | 9 448 | 0,00 | 240 | 0,84 | ||||
| 2025-07-28 | 13F | Nestegg Advisors, Inc. | 13 225 | −39,34 | 336 | −39,02 | ||||
| 2025-07-30 | 13F | Rehmann Capital Advisory Group | 11 065 | 0,00 | 281 | 0,72 | ||||
| 2025-08-14 | 13F | Wells Fargo & Company/mn | 454 319 | 4,82 | 11 544 | 5,32 | ||||
| 2025-08-15 | 13F | Morgan Stanley | 192 905 | 5,83 | 4 902 | 6,34 | ||||
| 2025-08-15 | 13F | Captrust Financial Advisors | 19 844 | −2,53 | 504 | −1,95 | ||||
| 2025-07-17 | 13F | Hengehold Capital Management Llc | 386 615 | 3,24 | 9 824 | 3,73 | ||||
| 2025-08-11 | 13F | United Capital Financial Advisers, Llc | 107 202 | 0,06 | 2 724 | 0,55 | ||||
| 2025-08-13 | 13F | Smith, Moore & Co. | 14 163 | 360 | ||||||
| 2025-07-22 | 13F | Valley National Advisers Inc | 3 943 | 0 | ||||||
| 2025-07-18 | 13F | Precision Wealth Strategies, LLC | 10 392 | 264 | ||||||
| 2025-08-08 | 13F | Cetera Investment Advisers | 34 100 | 42,15 | 866 | 42,90 | ||||
| 2025-08-04 | 13F | Jim Saulnier & Associates, Llc | 13 612 | 0,61 | 346 | 0,88 | ||||
| 2025-08-08 | 13F | Meridian Wealth Management, LLC | 12 954 | 329 | ||||||
| 2025-07-07 | 13F | Trust Co | 13 728 | 0,00 | 349 | 0,29 | ||||
| 2025-07-08 | 13F | Heartwood Wealth Advisors LLC | 252 883 | 0,05 | 6 426 | 0,53 | ||||
| 2025-08-12 | 13F | LPL Financial LLC | 265 242 | 2,44 | 6 740 | 2,92 | ||||
| 2025-07-09 | 13F | Massmutual Trust Co Fsb/adv | 19 660 | 14 462,96 | 500 | 16 533,33 | ||||
| 2025-07-29 | 13F | Stratos Wealth Advisors, LLC | 97 842 | 137,99 | 2 486 | 139,27 | ||||
| 2025-07-22 | 13F | Partners Wealth Management, Llc | 11 593 | 0,00 | 293 | −0,34 | ||||
| 2025-08-12 | 13F | YANKCOM Partnership | 0 | −100,00 | 0 | |||||
| 2025-08-14 | 13F | Mercer Global Advisors Inc /adv | 856 888 | 13,85 | 21 774 | 14,39 | ||||
| 2025-08-14 | 13F | Snowden Capital Advisors LLC | 31 000 | 0,00 | 788 | 0,51 | ||||
| 2025-07-16 | 13F | Evergreen Private Wealth LLC | 43 810 | 1,33 | 1 113 | 1,83 | ||||
| 2025-07-17 | 13F/A | Capital Investment Advisors, LLC | 58 555 | 13,15 | 1 488 | 13,69 | ||||
| 2025-07-15 | 13F | Postrock Partners Llc | 16 841 | 26,71 | 428 | 27,08 | ||||
| 2025-07-11 | 13F | Quantum Financial Advisors, LLC | 87 204 | 5,12 | 2 216 | 5,58 | ||||
| 2025-08-27 | 13F/A | Brinker Capital Investments, LLC | 27 000 | 27,92 | 686 | 28,71 | ||||
| 2025-07-15 | 13F | Droms Strauss Advisors Inc /mo/ /adv | 15 443 | 10,77 | 392 | 11,36 | ||||
| 2025-07-31 | 13F | Leavell Investment Management, Inc. | 50 439 | 93,17 | 1 282 | 94,09 | ||||
| 2025-07-08 | 13F | Legacy Private Trust Co. | 82 149 | 0,00 | 2 087 | 0,48 | ||||
| 2025-08-14 | 13F | STAR Financial Bank | 0 | −100,00 | 0 | |||||
| 2025-08-14 | 13F | Ameriprise Financial Inc | 113 132 | 3,51 | 2 875 | 4,02 | ||||
| 2025-08-14 | 13F | Citadel Advisors Llc | 0 | −100,00 | 0 | |||||
| 2025-08-12 | 13F | Steward Partners Investment Advisory, Llc | 11 666 | 33,51 | 296 | 34,55 | ||||
| 2025-08-14 | 13F | Royal Bank Of Canada | 92 733 | −1,27 | 2 356 | −0,80 | ||||
| 2025-07-18 | 13F | Client 1st Advisory Group, Llc | 19 920 | 0,00 | 506 | 0,60 | ||||
| 2025-08-12 | 13F | Covington Investment Advisors Inc. | 308 365 | 9,30 | 8 | 0,00 | ||||
| 2025-08-14 | 13F | Comerica Bank | 5 889 | 0,00 | 150 | 0,68 | ||||
| 2025-08-11 | 13F | Avantax Planning Partners, Inc. | 12 459 | −0,01 | 317 | 0,32 | ||||
| 2025-08-14 | 13F | Mariner, LLC | 14 536 | 0,00 | 369 | 0,54 | ||||
| 2025-05-14 | 13F | Evergreen Wealth Solutions, LLC | 0 | −100,00 | 0 | |||||
| 2025-08-12 | 13F | OneAscent Financial Services LLC | 9 066 | −7,38 | 0 | |||||
| 2025-08-14 | 13F | UBS Group AG | 335 095 | −8,03 | 8 515 | −7,60 | ||||
| 2025-07-17 | 13F | Catalytic Wealth RIA, LLC | 31 217 | −2,05 | 793 | −1,49 | ||||
| 2025-08-06 | 13F | Rialto Wealth Management, LLC | 828 | 0,00 | 21 | 5,00 | ||||
| 2025-08-15 | 13F | CI Private Wealth, LLC | 11 656 | −65,87 | 296 | −65,70 | ||||
| 2025-05-12 | 13F | Sandy Spring Bank | 61 833 | 15,14 | 1 564 | 15,61 | ||||
| 2025-08-01 | 13F | First National Trust Co | 14 433 | 4,28 | 367 | 4,57 | ||||
| 2025-07-30 | 13F | Granite Harbor Advisors, Inc. | 41 059 | −9,39 | 1 043 | −8,91 | ||||
| 2025-08-12 | 13F | Proequities, Inc. | 0 | 0 | ||||||
| 2025-08-07 | 13F | Allworth Financial LP | 813 | 0,00 | 21 | 0,00 | ||||
| 2025-08-13 | 13F | MONECO Advisors, LLC | 10 933 | 0,00 | 278 | 0,36 | ||||
| 2025-08-12 | 13F | Passive Capital Management, LLC. | 13 803 | 0,00 | 350 | 0,29 | ||||
| 2025-07-24 | 13F | IFP Advisors, Inc | 30 559 | 14,36 | 776 | 14,96 | ||||
| 2025-07-29 | 13F | Roof Eidam & Maycock/adv | 31 789 | 0,14 | 808 | 0,62 | ||||
| 2025-08-07 | 13F | CENTRAL TRUST Co | 151 130 | 0,76 | 3 840 | 1,24 | ||||
| 2025-08-14 | 13F | Fmr Llc | 2 043 | −75,05 | 52 | −75,36 | ||||
| 2025-08-14 | 13F | Benjamin Edwards Inc | 81 830 | 150,56 | 2 079 | 152,00 | ||||
| 2025-07-09 | 13F | Praetorian Wealth Management, Inc. | 242 261 | 1,30 | 6 156 | 1,79 | ||||
| 2025-08-04 | 13F | ArborFi Advisors, LLC | 0 | −100,00 | 0 | |||||
| 2025-08-13 | 13F | Beacon Pointe Advisors, LLC | 23 464 | 0,32 | 596 | 0,85 | ||||
| 2025-07-11 | 13F | Financial Advisory Corp | 27 255 | 693 | ||||||
| 2025-08-06 | 13F | Commonwealth Equity Services, Llc | 62 636 | 3,26 | 2 | 0,00 | ||||
| 2025-08-14 | 13F | Jane Street Group, Llc | 117 601 | 91,66 | 2 988 | 92,65 | ||||
| 2025-05-16 | 13F/A | Kestra Investment Management, LLC | 0 | −100,00 | 0 | |||||
| 2025-07-23 | 13F | Valmark Advisers, Inc. | 59 642 | 11,45 | 1 516 | 11,97 | ||||
| 2025-08-06 | 13F | Atlantic Union Bankshares Corp | 63 186 | 1 606 | ||||||
| 2025-08-14 | 13F | Glen Eagle Advisors, LLC | 2 725 | 0,00 | 69 | 1,47 | ||||
| 2025-08-08 | 13F | Wrapmanager Inc | 13 905 | −4,43 | 353 | −3,81 | ||||
| 2025-08-13 | 13F | Lido Advisors, LLC | 185 542 | 10,01 | 4 715 | 10,53 | ||||
| 2025-07-22 | 13F | Woodmont Investment Counsel Llc | 95 929 | 17,12 | 2 438 | 17,67 | ||||
| 2025-07-09 | 13F | Bank of New Hampshire | 4 770 | 0,00 | 121 | 0,83 | ||||
| 2025-07-21 | 13F | Crews Bank & Trust | 31 482 | 0,00 | 800 | 0,38 | ||||
| 2025-08-11 | 13F | CFS Investment Advisory Services, LLC | 24 308 | −0,32 | 1 | |||||
| 2025-07-30 | 13F | Phillips Financial Management, Llc | 48 020 | 106,27 | 1 220 | 107,48 | ||||
| 2025-08-01 | 13F | Envestnet Asset Management Inc | 841 032 | 4,56 | 21 371 | 5,06 | ||||
| 2025-08-11 | 13F | Private Advisor Group, LLC | 8 726 | 222 | ||||||
| 2025-08-13 | 13F | Jones Financial Companies Lllp | 9 776 | 22,31 | 248 | 23,38 | ||||
| 2025-07-25 | 13F | Cwm, Llc | 39 362 | 18,93 | 1 | |||||
| 2025-08-14 | 13F | Integrated Wealth Concepts LLC | 115 028 | 3,23 | 2 923 | 3,69 | ||||
| 2025-08-14 | 13F | GWM Advisors LLC | 434 996 | 2,27 | 11 053 | 2,75 | ||||
| 2025-07-29 | 13F | Private Trust Co Na | 8 883 | −3,31 | 226 | −3,02 | ||||
| 2025-08-14 | 13F | Stifel Financial Corp | 193 861 | 80,61 | 4 926 | 81,50 | ||||
| 2025-08-05 | 13F | American Capital Advisory, LLC | 2 217 | 0,00 | 56 | 0,00 | ||||
| 2025-08-14 | 13F | Bank Of America Corp /de/ | 2 070 507 | 7,45 | 52 612 | 7,96 | ||||
| 2025-08-07 | 13F | Gryphon Financial Partners LLC | 24 940 | 634 | ||||||
| 2025-08-13 | 13F | Cary Street Partners Financial Llc | 7 956 | 0,00 | 202 | 0,50 | ||||
| 2025-08-13 | 13F | Northwestern Mutual Wealth Management Co | 185 252 | 12,72 | 4 707 | 13,26 | ||||
| 2025-07-31 | 13F | Cambridge Investment Research Advisors, Inc. | 30 265 | 275,64 | 1 | |||||
| 2025-08-12 | 13F | Ameritas Investment Partners, Inc. | 18 062 | 0,03 | 459 | 0,44 | ||||
| 2025-07-21 | 13F | Barrett & Company, Inc. | 1 794 | 46 | ||||||
| 2025-07-28 | 13F | WJ Wealth Management, LLC | 39 200 | 996 | ||||||
| 2025-07-22 | 13F | Penobscot Investment Management Company, Inc. | 8 000 | 0,00 | 203 | 0,50 | ||||
| 2025-08-01 | 13F | Paradigm, Strategies in Wealth Management, LLC | 22 906 | −16,44 | 582 | −16,02 | ||||
| 2025-08-13 | 13F | Flow Traders U.s. Llc | 9 668 | 0 | ||||||
| 2025-08-14 | 13F | 10Elms LLP | 19 160 | 0,00 | 487 | 0,41 | ||||
| 2025-07-07 | 13F | Vishria Bird Financial Group, LLC | 15 929 | 405 | ||||||
| 2025-05-15 | 13F/A | Orion Portfolio Solutions, LLC | 21 107 | 534 | ||||||
| 2025-08-19 | 13F | Asset Dedication, LLC | 2 004 | 0,00 | 51 | 0,00 | ||||
| 2025-08-13 | 13F | Green Harvest Asset Management LLC | 11 385 | 289 | ||||||
| 2025-08-14 | 13F | Envision Financial Planning, LLC | 84 482 | −6,02 | 2 147 | −5,59 | ||||
| 2025-07-25 | 13F | Commonwealth Financial Services, LLC | 10 367 | −2,44 | 263 | −1,87 | ||||
| 2025-08-14 | 13F | Colony Group, LLC | 62 843 | 3,26 | 1 597 | 3,70 | ||||
| 2025-07-29 | 13F | Accretive Wealth Partners, LLC | 8 274 | 210 | ||||||
| 2025-08-14 | 13F | Raymond James Financial Inc | 239 730 | −35,92 | 6 092 | −35,62 | ||||
| 2025-08-11 | 13F | PFG Private Wealth Management, LLC | 11 649 | 0,00 | 296 | 0,68 | ||||
| 2025-07-21 | 13F | Atwater Malick LLC | 10 921 | 278 | ||||||
| 2025-09-04 | 13F/A | Advisor Group Holdings, Inc. | 36 609 | 16,11 | 930 | 16,69 | ||||
| 2025-07-22 | 13F | Blue Square Asset Management, Llc | 29 176 | −2,99 | 741 | −2,50 | ||||
| 2025-07-21 | 13F | Cliftonlarsonallen Wealth Advisors, Llc | 181 110 | 4,87 | 4 602 | 5,38 | ||||
| 2025-08-05 | 13F | Hills Bank & Trust Co | 382 180 | 15,54 | 9 711 | 16,09 | ||||
| 2025-08-12 | 13F | Wealthbridge Capital Management, Llc | 12 732 | 5,64 | 324 | 6,25 | ||||
| 2025-07-30 | 13F | Klingman & Associates, LLC | 18 088 | −11,47 | 460 | −11,05 | ||||
| 2025-07-30 | 13F | Brookstone Capital Management | 11 292 | 21,94 | 287 | 22,22 | ||||
| 2025-08-14 | 13F/A | Rockefeller Capital Management L.P. | 18 154 | 8,56 | 461 | 9,24 | ||||
| 2025-07-14 | 13F | Sentinel Pension Advisors Inc | 51 221 | 0,61 | 1 302 | 1,09 | ||||
| 2025-07-24 | 13F | Us Bancorp \de\ | 734 646 | 7,39 | 18 667 | 7,90 | ||||
| 2025-07-01 | 13F | Confluence Investment Management Llc | 98 908 | 200,29 | 2 513 | 202,04 | ||||
| 2025-07-29 | 13F | Regions Financial Corp | 27 089 | 24,18 | 688 | 24,86 | ||||
| 2025-08-11 | 13F | HighTower Advisors, LLC | 653 576 | −6,72 | 16 607 | −6,28 | ||||
| 2025-07-21 | 13F | Segment Wealth Management, LLC | 9 500 | 0,00 | 241 | 0,42 | ||||
| 2025-05-14 | 13F | Stonebridge Capital Advisors LLC | 0 | −100,00 | 0 | |||||
| 2025-08-07 | 13F | Addison Advisors LLC | 995 | 947,37 | 25 | 1 150,00 | ||||
| 2025-08-01 | 13F | James Investment Research Inc | 13 800 | −6,76 | 351 | −6,42 | ||||
| 2025-08-15 | 13F | Howland Capital Management Llc | 338 675 | 1,73 | 8 606 | 2,21 | ||||
| 2025-07-25 | 13F | Stephens Consulting, LLC | 313 | 0,00 | 8 | 0,00 | ||||
| 2025-07-21 | 13F | Cornell Pochily Investment Advisors, Inc. | 8 045 | 204 | ||||||
| 2025-08-13 | 13F | Baird Financial Group, Inc. | 10 000 | 0,00 | 254 | 0,79 | ||||
| 2025-08-12 | 13F | Coldstream Capital Management Inc | 83 958 | 2,41 | 2 133 | 2,89 | ||||
| 2025-05-07 | 13F | Mb, Levis & Associates, Llc | 0 | −100,00 | 0 | −100,00 | ||||
| 2025-07-18 | 13F | Newman Dignan & Sheerar, Inc. | 48 256 | 0,00 | 1 226 | 0,49 | ||||
| 2025-08-04 | 13F | Assetmark, Inc | 20 448 | 110,20 | 520 | 110,98 | ||||
| 2025-08-07 | 13F | Sound View Wealth Advisors Group, LLC | 112 390 | 26,63 | 2 856 | 27,23 | ||||
| 2025-08-14 | 13F | Goldman Sachs Group Inc | 8 456 | −26,21 | 215 | −25,95 | ||||
| 2025-07-10 | 13F | Cypress Point Wealth Management, LLC | 119 536 | 0,00 | 3 037 | 0,46 | ||||
| 2025-08-11 | 13F | Principal Securities, Inc. | 20 | −86,49 | 1 | −100,00 | ||||
| 2025-07-02 | 13F | Crumly & Associates Inc. | 0 | −100,00 | 0 | |||||
| 2025-08-07 | 13F | Hughes Financial Services, LLC | 5 930 | 0,00 | 152 | 1,34 | ||||
| 2025-08-12 | 13F | Jpmorgan Chase & Co | 81 923 | 2 082 | ||||||
| 2025-08-15 | 13F | Kestra Advisory Services, LLC | 19 081 | 45,82 | 485 | 46,67 | ||||
| 2025-07-09 | 13F | Lbmc Investment Advisors, Llc | 375 752 | 17,16 | 9 548 | 17,72 | ||||
| 2025-07-21 | 13F | Exchange Capital Management, Inc. | 14 484 | −6,67 | 368 | −6,12 | ||||
| 2025-08-01 | 13F | Schmidt P J Investment Management Inc | 8 562 | 218 | ||||||
| 2025-07-17 | 13F | Janney Montgomery Scott LLC | 14 809 | −7,68 | 0 | |||||
| 2025-08-01 | 13F | Signature Wealth Management Group | 47 520 | 1,96 | 1 207 | 2,46 | ||||
| 2025-08-14 | 13F | Glenview Trust Co | 36 400 | 0,00 | 925 | 0,43 | ||||
| 2025-07-18 | 13F | TPG Advisors LLC | 9 143 | 0,00 | 232 | 0,43 | ||||
| 2025-04-15 | 13F | Collier Financial | 402 | 0,50 | 10 | 0,00 | ||||
| 2025-05-05 | 13F | Creekmur Asset Management LLC | 0 | −100,00 | 0 | |||||
| 2025-08-14 | 13F | Godshalk Welsh Capital Management, Inc. | 25 750 | 128,89 | 654 | 130,28 |