Grunnleggende statistikk
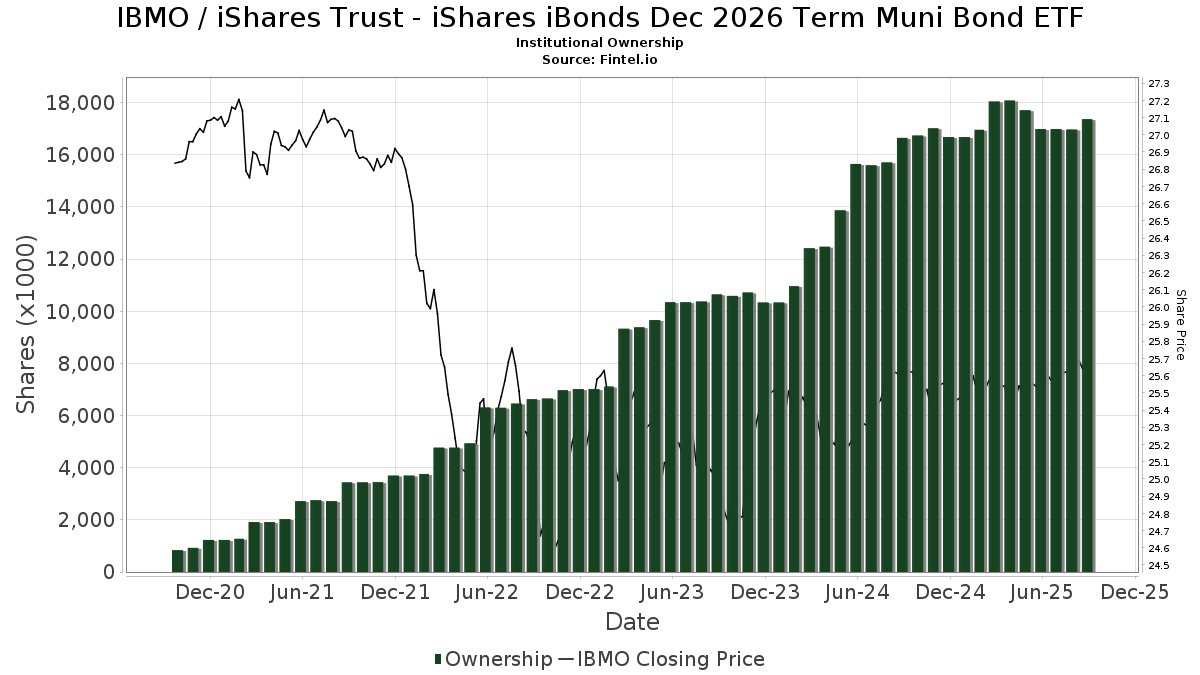
| Institusjonelle eiere | 175 total, 175 long only, 0 short only, 0 long/short - change of −2,22% MRQ |
| Gjennomsnittlig porteføljeallokering | 0.1285 % - change of −10,96% MRQ |
| Institusjonelle aksjer (Long) | 17 367 063 (ex 13D/G) - change of 0,38MM shares 2,22% MRQ |
| Institusjonell verdi (Long) | $ 427 198 USD ($1000) |
Institusjonelt eierskap og aksjonærer
iShares Trust - iShares iBonds Dec 2026 Term Muni Bond ETF (US:IBMO) har 175 institusjonelle eiere og aksjonærer som har sendt inn 13D/G- eller 13F-skjemaer til Securities Exchange Commission (SEC). Disse institusjonene eier til sammen 17,367,063 aksjer. De største aksjonærene inkluderer Bank Of America Corp /de/, Mercer Global Advisors Inc /adv, Hartland & Co., LLC, Envestnet Asset Management Inc, Us Bancorp \de\, Morgan Stanley, GWM Advisors LLC, Wells Fargo & Company/mn, Kathmere Capital Management, LLC, and UBS Group AG .
iShares Trust - iShares iBonds Dec 2026 Term Muni Bond ETF (BATS:IBMO) institusjonell eierstruktur viser nåværende posisjoner i selskapet fordelt på institusjoner og fond, samt de siste endringene i posisjonsstørrelse. De største aksjonærene kan være individuelle investorer, verdipapirfond, hedgefond eller institusjoner. Schedule 13D indikerer at investoren eier (eller har eid) mer enn 5 % av selskapet og har til hensikt (eller hadde til hensikt) å aktivt forfølge en endring i forretningsstrategien. Schedule 13G indikerer en passiv investering på over 5 %.
The share price as of September 12, 2025 is 25,71 / share. Previously, on September 13, 2024, the share price was 25,63 / share. This represents an increase of 0,31% over that period.
Fondssentiment-score
Fondssentiment Score (også kjent som akkumulering av eierskap poengsum) viser hvilke aksjer som er mest kjøpt av fond. Den er resultatet av en sofistikert, kvantitativ flerfaktormodell som identifiserer selskaper med de høyeste nivåene av institusjonell akkumulering. Beregningsmodellen for poeng bruker en kombinasjon av den totale økningen i antall offentliggjorte eiere, endringer i porteføljeallokeringen til disse eierne og andre beregninger. Tallet går fra 0 til 100, der høyere tall indikerer en høyere grad av akkumulering i forhold til sammenlignbare selskaper, der 50 er gjennomsnittet.
Oppdateringsfrekvens: Daglig
Sjekk ut Ownership Explorer, som inneholder en liste over de høyest rangerte selskapene.
Institusjonell Put/Call-forhold
I tillegg til å rapportere standard aksje- og gjeldsemisjoner må institusjoner med mer enn 100 millioner kroner i forvaltningskapital også oppgi beholdningen av put- og callopsjoner. Siden put-opsjoner generelt indikerer et negativt sentiment, og call-opsjoner indikerer et positivt sentiment, kan vi få et inntrykk av det generelle institusjonelle sentimentet ved å plotte forholdet mellom put- og call-opsjoner. Diagrammet til høyre viser det historiske forholdet mellom put- og call-opsjoner for dette instrumentet.
Ved å bruke Put/Call-forholdet som en indikator på investorsentimentet kan man overvinne en av de viktigste svakhetene ved å bruke totalt institusjonelt eierskap, nemlig at en betydelig andel av forvaltningskapitalen investeres passivt for å følge indekser. Passivt forvaltede fond kjøper vanligvis ikke opsjoner, slik at indikatoren for put/call-forhold i større grad gjenspeiler stemningen i aktivt forvaltede fond.
13F- og NPORT-arkiveringer
Detaljer om 13F-arkiveringer er gratis. Detaljer om NP-arkiveringer krever et premium-medlemskap. Grønne rader indikerer nye posisjoner. Røde rader indikerer lukkede posisjoner. Klikk på lenke ikonet for å se hele transaksjonshistorikken.
Oppgrader
for å låse opp premiedata og eksportere til Excel. ![]() .
.
| Fildato | Kilde | Investor | Type | Gjennomsnittlig pris (estimert) |
Aksjer | Δ Aksjer (%) |
Rapportert verdi ($1000) | Verdi (%) | Portallokering (%) | |
|---|---|---|---|---|---|---|---|---|---|---|
| 2025-05-05 | 13F | Creekmur Asset Management LLC | 0 | −100,00 | 0 | |||||
| 2025-07-16 | 13F | Signaturefd, Llc | 8 988 | 0,00 | 230 | 0,44 | ||||
| 2025-08-04 | 13F | Atria Investments Llc | 38 536 | −16,99 | 987 | −16,78 | ||||
| 2025-08-04 | 13F | Spinnaker Trust | 47 700 | 5,80 | 1 222 | 6,08 | ||||
| 2025-08-14 | 13F | Mercer Global Advisors Inc /adv | 947 342 | 10,28 | 24 274 | 10,55 | ||||
| 2025-07-15 | 13F | Cora Capital Advisors Llc | 12 500 | 0,00 | 320 | 0,31 | ||||
| 2025-08-07 | 13F | Rossmore Private Capital | 11 736 | 0,00 | 301 | 0,33 | ||||
| 2025-08-12 | 13F | BlackRock, Inc. | 147 | 0,68 | 4 | 0,00 | ||||
| 2025-07-17 | 13F | Archford Capital Strategies, LLC | 16 384 | 3,65 | 420 | 3,71 | ||||
| 2025-07-29 | 13F | Stratos Wealth Partners, LTD. | 34 352 | −22,48 | 880 | −22,26 | ||||
| 2025-08-11 | 13F | United Capital Financial Advisers, Llc | 108 197 | 0,08 | 2 772 | 0,33 | ||||
| 2025-08-12 | 13F | Deutsche Bank Ag\ | 41 021 | 0,00 | 1 051 | 0,19 | ||||
| 2025-08-14 | 13F | Garden State Investment Advisory Services LLC | 0 | −100,00 | 0 | |||||
| 2025-07-07 | 13F | Trust Co | 13 708 | −0,01 | 351 | 0,29 | ||||
| 2025-07-22 | 13F | Partners Wealth Management, Llc | 11 489 | 0,00 | 293 | 0,00 | ||||
| 2025-07-16 | 13F | Evergreen Private Wealth LLC | 44 590 | −0,97 | 1 143 | −0,70 | ||||
| 2025-07-17 | 13F | Coastline Trust Co | 1 918 | 0,00 | 49 | 0,00 | ||||
| 2025-08-15 | 13F | Captrust Financial Advisors | 18 689 | −8,31 | 479 | −8,08 | ||||
| 2025-07-10 | 13F | Global Financial Private Client, LLC | 0 | −100,00 | 0 | |||||
| 2025-07-11 | 13F | Quantum Financial Advisors, LLC | 156 480 | 2,79 | 4 009 | 3,03 | ||||
| 2025-08-12 | 13F | Wealthbridge Capital Management, Llc | 15 433 | 5,27 | 395 | 5,61 | ||||
| 2025-08-15 | 13F | Morgan Stanley | 688 174 | 0,09 | 17 633 | 0,34 | ||||
| 2025-07-15 | 13F | Droms Strauss Advisors Inc /mo/ /adv | 11 714 | 3,52 | 300 | 3,81 | ||||
| 2025-08-14 | 13F | Susquehanna International Group, Llp | 0 | −100,00 | 0 | |||||
| 2025-07-09 | 13F | Praetorian Wealth Management, Inc. | 237 175 | 0,12 | 6 077 | 0,36 | ||||
| 2025-08-12 | 13F | Steward Partners Investment Advisory, Llc | 8 474 | 0,00 | 217 | 0,46 | ||||
| 2025-08-14 | 13F | Goldman Sachs Group Inc | 28 310 | 151,44 | 725 | 152,61 | ||||
| 2025-07-15 | 13F | Postrock Partners Llc | 38 416 | 3,64 | 984 | 3,91 | ||||
| 2025-08-12 | 13F | Covington Investment Advisors Inc. | 306 590 | 1,76 | 8 | 0,00 | ||||
| 2025-08-06 | 13F | Rialto Wealth Management, LLC | 965 | 0,00 | 25 | 0,00 | ||||
| 2025-08-01 | 13F | First National Trust Co | 9 949 | 12,63 | 255 | 12,89 | ||||
| 2025-08-14 | 13F | UBS Group AG | 447 469 | −4,57 | 11 465 | −4,34 | ||||
| 2025-04-11 | 13F | First Affirmative Financial Network | 19 444 | 4,22 | 497 | 4,64 | ||||
| 2025-07-01 | 13F | Harbor Investment Advisory, Llc | 3 656 | 0,00 | 94 | 0,00 | ||||
| 2025-08-11 | 13F | Summit Wealth Partners, LLC | 8 918 | 0,00 | 229 | 0,44 | ||||
| 2025-05-07 | 13F | HB Wealth Management, LLC | 0 | −100,00 | 0 | |||||
| 2025-05-14 | 13F | Evergreen Wealth Solutions, LLC | 0 | −100,00 | 0 | |||||
| 2025-08-14 | 13F | Benjamin Edwards Inc | 47 752 | −1,72 | 1 224 | −1,45 | ||||
| 2025-07-29 | 13F | Roof Eidam & Maycock/adv | 29 703 | 0,16 | 761 | 0,53 | ||||
| 2025-07-30 | 13F | Granite Harbor Advisors, Inc. | 44 803 | −7,30 | 1 148 | −7,13 | ||||
| 2025-07-11 | 13F | Financial Advisory Corp | 26 910 | 690 | ||||||
| 2025-08-13 | 13F | Beacon Pointe Advisors, LLC | 48 859 | −8,47 | 1 252 | −8,28 | ||||
| 2025-08-14 | 13F | Diversify Advisory Services, LLC | 8 140 | 0,78 | 209 | 0,97 | ||||
| 2025-08-06 | 13F | Commonwealth Equity Services, Llc | 149 722 | −2,51 | 4 | 0,00 | ||||
| 2025-08-14 | 13F | Jane Street Group, Llc | 82 820 | 159,18 | 2 122 | 160,05 | ||||
| 2025-08-07 | 13F | Allworth Financial LP | 802 | 0,00 | 21 | 0,00 | ||||
| 2025-07-23 | 13F | Valmark Advisers, Inc. | 63 358 | 8,77 | 1 623 | 9,07 | ||||
| 2025-07-16 | 13F | Kerntke Otto McGlone Wealth Management Group | 0 | −100,00 | 0 | |||||
| 2025-08-14 | 13F | Glen Eagle Advisors, LLC | 3 225 | 0,00 | 83 | 0,00 | ||||
| 2025-08-08 | 13F | Wrapmanager Inc | 13 881 | −4,37 | 356 | −4,31 | ||||
| 2025-07-22 | 13F | Woodmont Investment Counsel Llc | 65 336 | −0,60 | 1 674 | −0,36 | ||||
| 2025-08-05 | 13F | American Capital Advisory, LLC | 2 221 | 0,00 | 57 | 0,00 | ||||
| 2025-08-14 | 13F | Stifel Financial Corp | 131 227 | 4,87 | 3 362 | 5,13 | ||||
| 2025-08-14 | 13F | Integrated Wealth Concepts LLC | 336 583 | 3,47 | 8 624 | 3,73 | ||||
| 2025-08-14 | 13F | Wiley Bros.-aintree Capital, Llc | 15 130 | −25,92 | 388 | −21,66 | ||||
| 2025-08-13 | 13F | Northwestern Mutual Wealth Management Co | 287 385 | 6,92 | 7 364 | 7,18 | ||||
| 2025-08-14 | 13F | Raymond James Financial Inc | 204 997 | −28,16 | 5 253 | −27,99 | ||||
| 2025-08-14 | 13F | Colony Group, LLC | 65 243 | 8,80 | 1 672 | 9,07 | ||||
| 2025-08-01 | 13F | Envestnet Asset Management Inc | 878 008 | 0,52 | 22 497 | 0,77 | ||||
| 2025-07-31 | 13F | Cambridge Investment Research Advisors, Inc. | 33 963 | 119,31 | 1 | |||||
| 2025-08-12 | 13F | Ameritas Investment Partners, Inc. | 6 455 | −6,08 | 165 | −5,71 | ||||
| 2025-04-24 | 13F | Aspect Partners, LLC | 0 | −100,00 | 0 | |||||
| 2025-07-18 | 13F | Foundry Financial Group, Inc. | 39 977 | 0,10 | 1 024 | 0,39 | ||||
| 2025-07-23 | 13F | Beaumont Asset Management, L.L.C. | 8 320 | 213 | ||||||
| 2025-05-15 | 13F/A | Orion Portfolio Solutions, LLC | 44 564 | 438,80 | 1 139 | 442,38 | ||||
| 2025-07-25 | 13F | Commonwealth Financial Services, LLC | 13 655 | −3,12 | 350 | −3,06 | ||||
| 2025-07-21 | 13F | Cornell Pochily Investment Advisors, Inc. | 7 935 | 203 | ||||||
| 2025-08-14 | 13F | Wells Fargo & Company/mn | 503 073 | 2,03 | 12 890 | 2,29 | ||||
| 2025-07-16 | 13F | Novem Group | 21 753 | 1,13 | 557 | 1,46 | ||||
| 2025-04-15 | 13F | Members Wealth Llc | 22 406 | 3,64 | 573 | 3,81 | ||||
| 2025-08-05 | 13F | Hills Bank & Trust Co | 383 212 | 17,75 | 9 819 | 18,05 | ||||
| 2025-08-14 | 13F | STAR Financial Bank | 0 | −100,00 | 0 | |||||
| 2025-08-19 | 13F | Asset Dedication, LLC | 9 282 | 0,00 | 238 | 0,00 | ||||
| 2025-09-04 | 13F/A | Advisor Group Holdings, Inc. | 107 449 | −6,24 | 2 753 | −6,04 | ||||
| 2025-08-08 | 13F | Creative Planning | 11 556 | 0,00 | 296 | 0,34 | ||||
| 2025-08-12 | 13F | Argent Trust Co | 0 | −100,00 | 0 | −100,00 | ||||
| 2025-07-24 | 13F | Us Bancorp \de\ | 734 542 | 6,75 | 18 821 | 7,02 | ||||
| 2025-07-14 | 13F | Sentinel Pension Advisors Inc | 68 613 | −0,20 | 1 758 | 0,06 | ||||
| 2025-07-17 | 13F | Janney Montgomery Scott LLC | 14 125 | −36,77 | 0 | |||||
| 2025-08-01 | 13F | Ashton Thomas Private Wealth, LLC | 0 | −100,00 | 0 | |||||
| 2025-08-15 | 13F | Howland Capital Management Llc | 188 806 | 3,92 | 4 838 | 4,18 | ||||
| 2025-08-11 | 13F | HighTower Advisors, LLC | 329 979 | −4,25 | 8 455 | −4,01 | ||||
| 2025-08-13 | 13F | Baird Financial Group, Inc. | 10 000 | 0,00 | 256 | 0,39 | ||||
| 2025-05-07 | 13F | Mb, Levis & Associates, Llc | 0 | −100,00 | 0 | −100,00 | ||||
| 2025-07-17 | 13F | E Six Thirteen, Llc | 135 772 | 0,00 | 3 479 | 0,23 | ||||
| 2025-08-07 | 13F | New England Private Wealth Advisors LLC | 73 288 | 0,05 | 1 878 | 0,27 | ||||
| 2025-08-15 | 13F | CI Private Wealth, LLC | 23 406 | −51,98 | 600 | −51,89 | ||||
| 2025-08-05 | 13F | Huntington National Bank | 0 | |||||||
| 2025-08-14 | 13F | Mariner, LLC | 41 741 | −0,22 | 1 070 | 0,00 | ||||
| 2025-08-14 | 13F | Glenview Trust Co | 58 838 | 0,00 | 1 508 | 0,27 | ||||
| 2025-07-25 | 13F | Apollon Wealth Management, LLC | 14 000 | −30,00 | 359 | −29,94 | ||||
| 2025-05-09 | 13F | Ogorek Anthony Joseph /ny/ /adv | 0 | −100,00 | 0 | |||||
| 2025-08-14 | 13F | IHT Wealth Management, LLC | 42 008 | 0,58 | 1 076 | 0,84 | ||||
| 2025-08-05 | 13F | Gould Asset Management Llc /ca/ | 20 375 | 17,23 | 522 | 17,57 | ||||
| 2025-07-30 | 13F | Rehmann Capital Advisory Group | 12 479 | 0,16 | 320 | 0,31 | ||||
| 2025-08-13 | 13F | Peloton Wealth Strategists | 11 000 | 0,00 | 0 | |||||
| 2025-08-06 | 13F | AE Wealth Management LLC | 0 | −100,00 | 0 | |||||
| 2025-07-28 | 13F | Harbour Investments, Inc. | 1 936 | 426,09 | 50 | 444,44 | ||||
| 2025-08-07 | 13F | Kestra Private Wealth Services, Llc | 60 724 | 10,88 | 1 556 | 11,15 | ||||
| 2025-08-06 | 13F | Savant Capital, LLC | 9 312 | 0,00 | 239 | 0,00 | ||||
| 2025-08-13 | 13F | Lido Advisors, LLC | 319 096 | 13,02 | 8 176 | 13,30 | ||||
| 2025-08-13 | 13F | RIA Advisory Group LLC | 55 323 | 4,77 | 1 418 | 5,04 | ||||
| 2025-08-08 | 13F | Hartland & Co., LLC | 882 174 | 3,13 | 22 604 | 3,38 | ||||
| 2025-07-16 | 13F | Kathmere Capital Management, LLC | 474 005 | −10,29 | 12 145 | −10,06 | ||||
| 2025-07-24 | 13F | Moseley Investment Management Inc | 55 929 | −9,69 | 1 433 | −9,42 | ||||
| 2025-07-24 | 13F | Cyndeo Wealth Partners, LLC | 133 532 | −17,50 | 3 421 | −17,29 | ||||
| 2025-07-11 | 13F | Farther Finance Advisors, LLC | 180 | 0,00 | 5 | 0,00 | ||||
| 2025-08-11 | 13F | Arrow Financial Corp | 9 451 | 0,00 | 242 | 0,41 | ||||
| 2025-08-13 | 13F | Smith, Moore & Co. | 13 848 | 71,45 | 355 | 71,84 | ||||
| 2025-07-18 | 13F | Precision Wealth Strategies, LLC | 10 225 | 262 | ||||||
| 2025-08-06 | 13F | Horan Securities, Inc. | 8 453 | 0,00 | 217 | 0,00 | ||||
| 2025-08-14 | 13F/A | Rockefeller Capital Management L.P. | 10 403 | 0,29 | 267 | 0,38 | ||||
| 2025-08-12 | 13F | LPL Financial LLC | 388 657 | 0,19 | 9 959 | 0,43 | ||||
| 2025-07-17 | 13F/A | Capital Investment Advisors, LLC | 63 738 | 11,05 | 1 633 | 11,39 | ||||
| 2025-08-08 | 13F | Cetera Investment Advisers | 45 411 | 13,88 | 1 164 | 14,13 | ||||
| 2025-07-08 | 13F | Richard P Slaughter Associates Inc | 0 | −100,00 | 0 | |||||
| 2025-07-22 | 13F | Strid Group, LLC | 13 404 | −57,01 | 343 | −56,91 | ||||
| 2025-07-31 | 13F | Resonant Capital Advisors, LLC | 27 461 | 0,00 | 704 | 0,29 | ||||
| 2025-08-11 | 13F | Actinver Wealth Management, Inc. | 11 127 | 2,52 | 285 | 2,89 | ||||
| 2025-07-31 | 13F | Leavell Investment Management, Inc. | 270 987 | 1,83 | 6 944 | 2,09 | ||||
| 2025-08-01 | 13F | Schmidt P J Investment Management Inc | 0 | −100,00 | 0 | |||||
| 2025-07-08 | 13F | Legacy Private Trust Co. | 7 870 | 0,00 | 202 | 0,00 | ||||
| 2025-08-27 | 13F/A | Brinker Capital Investments, LLC | 54 917 | 23,23 | 1 407 | 23,53 | ||||
| 2025-08-14 | 13F | Ameriprise Financial Inc | 143 957 | −9,03 | 3 689 | −8,74 | ||||
| 2025-07-08 | 13F | Prism Advisors, Inc. | 35 665 | 0,00 | 914 | 0,22 | ||||
| 2025-08-14 | 13F | Comerica Bank | 836 | −5,32 | 21 | −4,55 | ||||
| 2025-07-30 | 13F | Patten Group, Inc. | 9 111 | 0,00 | 233 | 0,43 | ||||
| 2025-04-16 | 13F | Wealth Enhancement Advisory Services, Llc | 0 | −100,00 | 0 | |||||
| 2025-05-13 | 13F | PFG Private Wealth Management, LLC | 0 | −100,00 | 0 | |||||
| 2025-08-14 | 13F | Royal Bank Of Canada | 95 232 | −0,63 | 2 440 | −0,37 | ||||
| 2025-08-11 | 13F | Avantax Planning Partners, Inc. | 13 229 | 0,00 | 339 | 0,00 | ||||
| 2025-08-07 | 13F | CENTRAL TRUST Co | 172 675 | 6,59 | 4 424 | 6,86 | ||||
| 2025-08-04 | 13F | ArborFi Advisors, LLC | 0 | −100,00 | 0 | |||||
| 2025-08-13 | 13F | MONECO Advisors, LLC | 10 893 | 0,00 | 279 | 0,36 | ||||
| 2025-08-14 | 13F | Fmr Llc | 300 | −96,09 | 8 | −96,43 | ||||
| 2025-05-12 | 13F | Sandy Spring Bank | 43 869 | 1,11 | 1 121 | 1,54 | ||||
| 2025-08-12 | 13F | Proequities, Inc. | 0 | 0 | ||||||
| 2025-08-15 | 13F | Stonebridge Capital Advisors LLC | 0 | −100,00 | 0 | |||||
| 2025-07-28 | 13F | Nestegg Advisors, Inc. | 0 | −100,00 | 0 | |||||
| 2025-08-13 | 13F | Baltimore-Washington Financial Advisors, Inc. | 8 179 | 0,00 | 210 | 0,00 | ||||
| 2025-07-17 | 13F | Catalytic Wealth RIA, LLC | 31 114 | −2,05 | 797 | −1,73 | ||||
| 2025-07-24 | 13F | IFP Advisors, Inc | 34 578 | 12,47 | 886 | 12,74 | ||||
| 2025-08-06 | 13F | Atlantic Union Bankshares Corp | 43 830 | 1 123 | ||||||
| 2025-08-15 | 13F | Kestra Advisory Services, LLC | 0 | −100,00 | 0 | |||||
| 2025-07-09 | 13F | Bank of New Hampshire | 2 905 | 0,00 | 74 | 0,00 | ||||
| 2025-08-13 | 13F | Jones Financial Companies Lllp | 2 141 | 0,00 | 55 | 0,00 | ||||
| 2025-07-21 | 13F | Crews Bank & Trust | 30 981 | 0,00 | 794 | 0,25 | ||||
| 2025-07-30 | 13F | Phillips Financial Management, Llc | 59 217 | 19,55 | 1 517 | 19,83 | ||||
| 2025-08-14 | 13F | Bank Of America Corp /de/ | 1 963 364 | 4,07 | 50 307 | 4,33 | ||||
| 2025-08-14 | 13F | 10Elms LLP | 23 794 | 1,71 | 610 | 2,01 | ||||
| 2025-07-29 | 13F | Private Trust Co Na | 9 739 | 28,58 | 250 | 29,02 | ||||
| 2025-08-11 | 13F | Private Advisor Group, LLC | 17 719 | 454 | ||||||
| 2025-08-14 | 13F | GWM Advisors LLC | 615 172 | 8,01 | 15 763 | 8,27 | ||||
| 2025-08-11 | 13F | Shufro Rose & Co Llc | 9 964 | 0,00 | 255 | 0,00 | ||||
| 2025-08-13 | 13F | Cary Street Partners Financial Llc | 9 595 | 0,00 | 246 | 0,00 | ||||
| 2025-08-14 | 13F | Modern Wealth Management, LLC | 45 042 | 18,37 | 1 154 | 18,72 | ||||
| 2025-07-28 | 13F | WJ Wealth Management, LLC | 12 179 | −71,89 | 312 | −71,82 | ||||
| 2025-05-16 | 13F/A | Kestra Investment Management, LLC | 0 | −100,00 | 0 | |||||
| 2025-07-29 | 13F | Accretive Wealth Partners, LLC | 8 196 | 210 | ||||||
| 2025-08-14 | 13F | Kovitz Investment Group Partners, LLC | 69 052 | 60,12 | 1 769 | 60,53 | ||||
| 2025-07-22 | 13F | Belpointe Asset Management LLC | 47 256 | 1 211 | ||||||
| 2025-07-22 | 13F | Blue Square Asset Management, Llc | 44 750 | −1,99 | 1 147 | −1,80 | ||||
| 2025-07-21 | 13F | Atwater Malick LLC | 97 835 | 3,30 | 2 507 | 3,55 | ||||
| 2025-08-07 | 13F | Sound View Wealth Advisors Group, LLC | 205 621 | 30,66 | 5 269 | 30,98 | ||||
| 2025-08-15 | 13F | Scissortail Wealth Management, LLC | 55 165 | −15,00 | 1 413 | −14,78 | ||||
| 2025-07-21 | 13F | Cliftonlarsonallen Wealth Advisors, Llc | 181 579 | 25,75 | 4 653 | 26,07 | ||||
| 2025-07-30 | 13F | Klingman & Associates, LLC | 11 767 | −16,50 | 302 | −16,39 | ||||
| 2025-07-30 | 13F | Princeton Global Asset Management LLC | 15 700 | 0,00 | 402 | 0,25 | ||||
| 2025-07-30 | 13F | Brookstone Capital Management | 11 068 | 22,22 | 284 | 22,51 | ||||
| 2025-08-12 | 13F | Eldridge Investment Advisors, Inc. | 8 000 | 0,00 | 205 | 0,00 | ||||
| 2025-08-14 | 13F | EP Wealth Advisors, Inc. | 11 490 | 294 | ||||||
| 2025-04-29 | 13F | 4J Wealth Management LLC | 0 | −100,00 | 0 | −100,00 | ||||
| 2025-07-01 | 13F | Confluence Investment Management Llc | 72 848 | −3,47 | 1 867 | −3,22 | ||||
| 2025-07-29 | 13F | Regions Financial Corp | 74 452 | −0,78 | 1 908 | −0,52 | ||||
| 2025-07-25 | 13F | Stephens Consulting, LLC | 313 | 0,00 | 8 | 0,00 | ||||
| 2025-07-11 | 13F | Lantz Financial LLC | 40 469 | 2,63 | 1 037 | 2,88 | ||||
| 2025-07-18 | 13F | Newman Dignan & Sheerar, Inc. | 105 943 | −10,77 | 2 715 | −10,19 | ||||
| 2025-07-23 | 13F | Sax Wealth Advisors, Llc | 15 021 | 385 | ||||||
| 2025-08-12 | 13F | Coldstream Capital Management Inc | 113 042 | 7,43 | 2 896 | 7,70 | ||||
| 2025-04-28 | 13F | Buffington Mohr McNeal | 11 490 | 9,33 | 294 | 9,74 | ||||
| 2025-08-07 | 13F | Addison Advisors LLC | 895 | 23 | ||||||
| 2025-07-30 | 13F | Strategic Blueprint, LLC | 8 381 | 215 | ||||||
| 2025-08-01 | 13F | James Investment Research Inc | 58 755 | 0,00 | 1 505 | 0,27 | ||||
| 2025-07-21 | 13F | Exchange Capital Management, Inc. | 14 899 | −3,25 | 382 | −3,05 | ||||
| 2025-08-07 | 13F | Hughes Financial Services, LLC | 6 686 | 6,26 | 171 | 6,88 | ||||
| 2025-08-01 | 13F | Signature Wealth Management Group | 59 477 | 1,34 | 1 524 | 1,53 | ||||
| 2025-08-11 | 13F | Principal Securities, Inc. | 1 943 | −4,47 | 50 | −3,92 | ||||
| 2025-08-14 | 13F | Financial Engines Advisors L.L.C. | 44 232 | 35,65 | 1 133 | 36,01 | ||||
| 2025-07-29 | 13F | Sigma Investment Counselors Inc | 10 000 | 0,00 | 256 | 0,39 | ||||
| 2025-07-09 | 13F | Lbmc Investment Advisors, Llc | 411 927 | 12,40 | 10 555 | 12,67 | ||||
| 2025-07-30 | 13F | Avidian Wealth Solutions, LLC | 8 554 | 219 | ||||||
| 2025-07-08 | 13F | Parallel Advisors, LLC | 22 690 | 15,90 | 581 | 16,20 | ||||
| 2025-07-25 | 13F | Cwm, Llc | 55 193 | 12,65 | 1 | 0,00 | ||||
| 2025-07-30 | 13F | Sonata Capital Group Inc | 95 287 | 0,00 | 2 | 0,00 | ||||
| 2025-08-12 | 13F | PSI Advisors, LLC | 0 | −100,00 | 0 | |||||
| 2025-07-24 | 13F | Riverchase Wealth Management, Llc | 19 229 | 0,00 | 493 | 0,20 | ||||
| 2025-08-11 | 13F | CFS Investment Advisory Services, LLC | 25 536 | −0,60 | 1 | |||||
| 2025-08-14 | 13F | Godshalk Welsh Capital Management, Inc. | 24 000 | 615 | ||||||
| 2025-07-02 | 13F | Crumly & Associates Inc. | 0 | −100,00 | 0 | |||||
| 2025-08-12 | 13F | Cooper/haims Advisors, Llc | 10 000 | 0,00 | 256 | 0,39 | ||||
| 2025-07-18 | 13F | TPG Advisors LLC | 9 094 | 0,00 | 233 | 0,43 | ||||
| 2025-08-04 | 13F | Assetmark, Inc | 36 944 | 330,08 | 947 | 331,96 | ||||
| 2025-08-14 | 13F | Snowden Capital Advisors LLC | 31 700 | 0,00 | 812 | 0,25 |