Grunnleggende statistikk
| Institusjonelle eiere | 140 total, 140 long only, 0 short only, 0 long/short - change of 5,22% MRQ |
| Gjennomsnittlig porteføljeallokering | 0.7676 % - change of 16,33% MRQ |
| Institusjonelle aksjer (Long) | 24 329 899 (ex 13D/G) - change of 3,23MM shares 15,31% MRQ |
| Institusjonell verdi (Long) | $ 530 334 USD ($1000) |
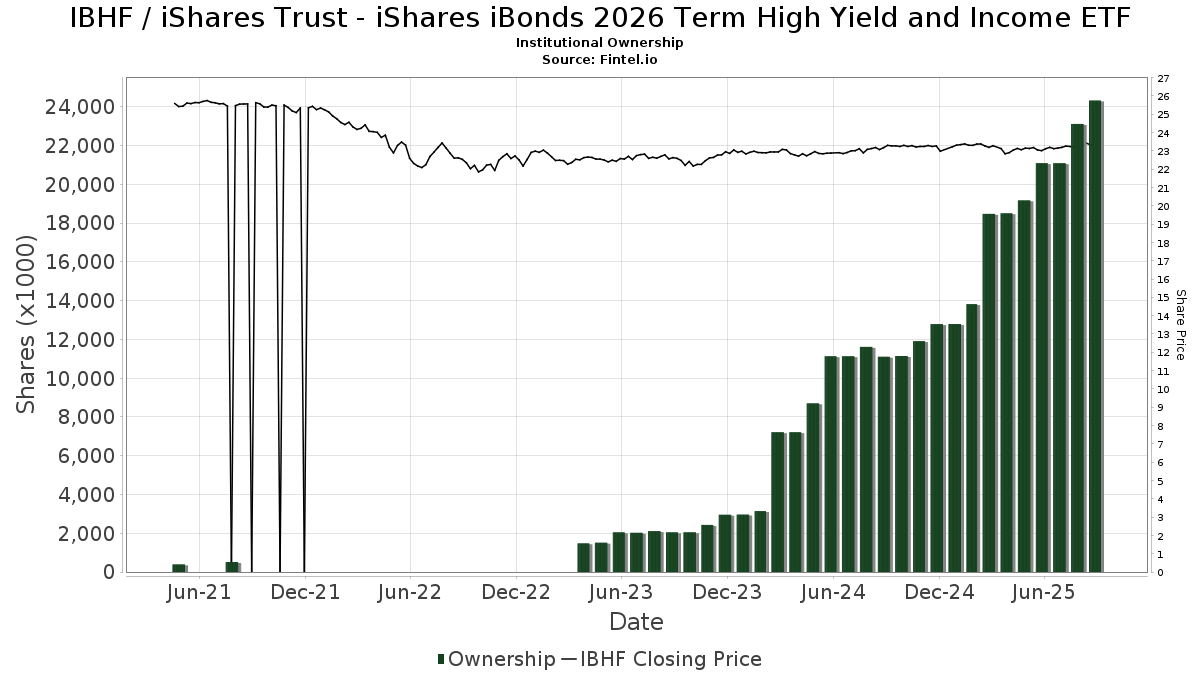
Institusjonelt eierskap og aksjonærer
iShares Trust - iShares iBonds 2026 Term High Yield and Income ETF (US:IBHF) har 140 institusjonelle eiere og aksjonærer som har sendt inn 13D/G- eller 13F-skjemaer til Securities Exchange Commission (SEC). Disse institusjonene eier til sammen 24,329,899 aksjer. De største aksjonærene inkluderer Bank Of America Corp /de/, Morgan Stanley, Sterling Financial Group, Inc., Cambridge Investment Research Advisors, Inc., Private Advisor Group, LLC, Wells Fargo & Company/mn, Lbmc Investment Advisors, Llc, Northwestern Mutual Wealth Management Co, Straightline Group Llc, and LPL Financial LLC .
iShares Trust - iShares iBonds 2026 Term High Yield and Income ETF (BATS:IBHF) institusjonell eierstruktur viser nåværende posisjoner i selskapet fordelt på institusjoner og fond, samt de siste endringene i posisjonsstørrelse. De største aksjonærene kan være individuelle investorer, verdipapirfond, hedgefond eller institusjoner. Schedule 13D indikerer at investoren eier (eller har eid) mer enn 5 % av selskapet og har til hensikt (eller hadde til hensikt) å aktivt forfølge en endring i forretningsstrategien. Schedule 13G indikerer en passiv investering på over 5 %.
The share price as of September 9, 2025 is 23,32 / share. Previously, on September 10, 2024, the share price was 23,14 / share. This represents an increase of 0,80% over that period.
Fondssentiment-score
Fondssentiment Score (også kjent som akkumulering av eierskap poengsum) viser hvilke aksjer som er mest kjøpt av fond. Den er resultatet av en sofistikert, kvantitativ flerfaktormodell som identifiserer selskaper med de høyeste nivåene av institusjonell akkumulering. Beregningsmodellen for poeng bruker en kombinasjon av den totale økningen i antall offentliggjorte eiere, endringer i porteføljeallokeringen til disse eierne og andre beregninger. Tallet går fra 0 til 100, der høyere tall indikerer en høyere grad av akkumulering i forhold til sammenlignbare selskaper, der 50 er gjennomsnittet.
Oppdateringsfrekvens: Daglig
Sjekk ut Ownership Explorer, som inneholder en liste over de høyest rangerte selskapene.
Institusjonell Put/Call-forhold
I tillegg til å rapportere standard aksje- og gjeldsemisjoner må institusjoner med mer enn 100 millioner kroner i forvaltningskapital også oppgi beholdningen av put- og callopsjoner. Siden put-opsjoner generelt indikerer et negativt sentiment, og call-opsjoner indikerer et positivt sentiment, kan vi få et inntrykk av det generelle institusjonelle sentimentet ved å plotte forholdet mellom put- og call-opsjoner. Diagrammet til høyre viser det historiske forholdet mellom put- og call-opsjoner for dette instrumentet.
Ved å bruke Put/Call-forholdet som en indikator på investorsentimentet kan man overvinne en av de viktigste svakhetene ved å bruke totalt institusjonelt eierskap, nemlig at en betydelig andel av forvaltningskapitalen investeres passivt for å følge indekser. Passivt forvaltede fond kjøper vanligvis ikke opsjoner, slik at indikatoren for put/call-forhold i større grad gjenspeiler stemningen i aktivt forvaltede fond.

13F- og NPORT-arkiveringer
Detaljer om 13F-arkiveringer er gratis. Detaljer om NP-arkiveringer krever et premium-medlemskap. Grønne rader indikerer nye posisjoner. Røde rader indikerer lukkede posisjoner. Klikk på lenke ikonet for å se hele transaksjonshistorikken.
Oppgrader
for å låse opp premiedata og eksportere til Excel. ![]() .
.
| Fildato | Kilde | Investor | Type | Gjennomsnittlig pris (estimert) |
Aksjer | Δ Aksjer (%) |
Rapportert verdi ($1000) | Verdi (%) | Portallokering (%) | |
|---|---|---|---|---|---|---|---|---|---|---|
| 2025-07-29 | 13F | Stratos Wealth Partners, LTD. | 138 721 | 66,83 | 3 223 | 66,94 | ||||
| 2025-08-06 | 13F | Savant Capital, LLC | 10 156 | 0,00 | 236 | 0,00 | ||||
| 2025-07-08 | 13F | FF Advisors,LLC | 177 871 | 3,56 | 4 132 | 4,32 | ||||
| 2025-08-14 | 13F | Goldman Sachs Group Inc | 0 | −100,00 | 0 | −100,00 | ||||
| 2025-05-02 | 13F | Whittier Trust Co | 0 | −100,00 | 0 | |||||
| 2025-08-08 | 13F | Wrapmanager Inc | 49 204 | 1,68 | 1 143 | 1,78 | ||||
| 2025-07-14 | 13F | Occidental Asset Management, LLC | 11 540 | 0,00 | 268 | 0,37 | ||||
| 2025-04-01 | 13F | Massmutual Trust Co Fsb/adv | 0 | −100,00 | 0 | |||||
| 2025-08-11 | 13F | Arrow Financial Corp | 724 261 | 116,28 | 16 825 | 116,39 | ||||
| 2025-08-08 | 13F | Marble Harbor Investment Counsel, LLC | 18 600 | −9,72 | 432 | −9,62 | ||||
| 2025-07-15 | 13F | North Star Investment Management Corp. | 2 000 | 46 | ||||||
| 2025-08-15 | 13F | High Falls Advisors, Inc | 12 551 | 16,49 | 292 | 16,40 | ||||
| 2025-08-08 | 13F | Creative Planning | 12 580 | 292 | ||||||
| 2025-07-28 | 13F | Harbour Investments, Inc. | 869 | 62,13 | 20 | 66,67 | ||||
| 2025-08-06 | 13F | Commonwealth Equity Services, Llc | 143 670 | 5,82 | 3 | 0,00 | ||||
| 2025-08-13 | 13F | Lido Advisors, LLC | 177 875 | −7,24 | 4 132 | −7,19 | ||||
| 2025-08-15 | 13F | Howland Capital Management Llc | 13 740 | 0,00 | 319 | 0,00 | ||||
| 2025-08-05 | 13F | GPS Wealth Strategies Group, LLC | 15 | 0 | ||||||
| 2025-08-11 | 13F | Aptus Capital Advisors, LLC | 1 309 | 0,46 | 30 | 0,00 | ||||
| 2025-08-01 | 13F | Ashton Thomas Private Wealth, LLC | 0 | −100,00 | 0 | |||||
| 2025-08-14 | 13F | Eight 31 Financial Llc | 79 140 | 0,62 | 1 838 | 0,66 | ||||
| 2025-08-14 | 13F | Ruggaard & Associates LLC | 574 522 | −2,16 | 13 346 | −2,12 | ||||
| 2025-08-04 | 13F | Cottage Street Advisors LLC | 69 930 | 9,74 | 1 624 | 9,80 | ||||
| 2025-08-14 | 13F | GWM Advisors LLC | 202 776 | 0,66 | 4 710 | 0,71 | ||||
| 2025-08-14 | 13F | Headinvest, Llc | 33 425 | −2,90 | 776 | −2,88 | ||||
| 2025-08-12 | 13F | Global Retirement Partners, LLC | 10 930 | 1,64 | 254 | 2,02 | ||||
| 2025-07-10 | 13F | Sterling Financial Group, Inc. | 1 210 761 | 28 126 | ||||||
| 2025-08-04 | 13F | Spire Wealth Management | 3 955 | −37,40 | 92 | −37,67 | ||||
| 2025-08-15 | 13F | Captrust Financial Advisors | 10 913 | 254 | ||||||
| 2025-08-11 | 13F | Principal Securities, Inc. | 5 822 | 39,82 | 135 | 40,63 | ||||
| 2025-08-12 | 13F | PSI Advisors, LLC | 0 | −100,00 | 0 | |||||
| 2025-08-11 | 13F | VSM Wealth Advisory, LLC | 384 | 0,00 | 9 | 0,00 | ||||
| 2025-08-08 | 13F | Thoroughbred Financial Services, Llc | 41 798 | −24,74 | 1 | −100,00 | ||||
| 2025-08-14 | 13F | Comerica Bank | 4 767 | −1,61 | 111 | −1,79 | ||||
| 2025-08-27 | 13F/A | Brinker Capital Investments, LLC | 80 035 | 2,27 | 1 859 | 2,31 | ||||
| 2025-05-14 | 13F | Susquehanna International Group, Llp | 0 | −100,00 | 0 | |||||
| 2025-07-30 | 13F | Strategic Blueprint, LLC | 49 319 | 460,44 | 1 146 | 461,27 | ||||
| 2025-08-13 | 13F | MONECO Advisors, LLC | 14 099 | 0,00 | 328 | 0,00 | ||||
| 2025-08-14 | 13F | Evergreen Capital Management Llc | 231 997 | 12,39 | 5 389 | 12,43 | ||||
| 2025-08-15 | 13F | Morgan Stanley | 1 525 335 | −25,01 | 35 434 | −24,98 | ||||
| 2025-08-06 | 13F | AE Wealth Management LLC | 33 020 | 1,60 | 767 | 1,72 | ||||
| 2025-08-14 | 13F | Sentinus, LLC | 26 056 | 0,03 | 605 | 0,17 | ||||
| 2025-07-23 | 13F | Madden Advisory Services, Inc. | 25 850 | 12,67 | 600 | 12,78 | ||||
| 2025-08-04 | 13F | Pensionmark Financial Group, Llc | 138 410 | −5,75 | 3 215 | −5,69 | ||||
| 2025-08-12 | 13F | Cowa, Llc | 685 592 | 25,98 | 15 912 | 25,92 | ||||
| 2025-05-14 | 13F | Van Hulzen Asset Management, LLC | 0 | −100,00 | 0 | −100,00 | ||||
| 2025-08-14 | 13F | UBS Group AG | 262 625 | 1,79 | 6 101 | 1,82 | ||||
| 2025-04-10 | 13F | Sugar Maple Asset Management, LLC | 0 | −100,00 | 0 | |||||
| 2025-07-25 | 13F | Commonwealth Financial Services, LLC | 100 262 | −17,58 | 2 329 | −17,53 | ||||
| 2025-08-08 | 13F | Avantax Advisory Services, Inc. | 202 734 | 44,27 | 4 710 | 44,32 | ||||
| 2025-07-16 | 13F | Littlejohn Financial Services, Inc. | 517 294 | 66,17 | 12 017 | 66,24 | ||||
| 2025-08-14 | 13F | Strategic Wealth Designers | 18 | 0 | ||||||
| 2025-08-14 | 13F | Mml Investors Services, Llc | 0 | −100,00 | 0 | |||||
| 2025-07-14 | 13F | GAMMA Investing LLC | 49 389 | −80,19 | 1 147 | −80,18 | ||||
| 2025-08-13 | 13F | Baltimore-Washington Financial Advisors, Inc. | 445 589 | −9,04 | 10 351 | −8,99 | ||||
| 2025-08-06 | 13F | Rialto Wealth Management, LLC | 67 198 | 12,33 | 1 561 | 12,38 | ||||
| 2025-08-11 | 13F | PFG Private Wealth Management, LLC | 0 | −100,00 | 0 | |||||
| 2025-07-25 | 13F | Cwm, Llc | 3 533 | −6,21 | 0 | |||||
| 2025-08-07 | 13F | Kestra Private Wealth Services, Llc | 144 299 | 10,97 | 3 352 | 11,03 | ||||
| 2025-08-13 | 13F | Beacon Pointe Advisors, LLC | 34 274 | −17,63 | 796 | −17,60 | ||||
| 2025-08-14 | 13F | Hrt Financial Lp | 0 | −100,00 | 0 | |||||
| 2025-05-07 | 13F | Vista Private Wealth Partners. LLC | 0 | −100,00 | 0 | |||||
| 2025-08-26 | 13F/A | Thrivent Financial For Lutherans | 0 | −100,00 | 0 | |||||
| 2025-08-11 | 13F | Summit Wealth Partners, LLC | 29 265 | −20,21 | 680 | −20,21 | ||||
| 2025-08-14 | 13F | Jane Street Group, Llc | 0 | −100,00 | 0 | |||||
| 2025-07-16 | 13F | Moisand Fitzgerald Tamayo, LLC | 1 | 0,00 | 0 | |||||
| 2025-07-17 | 13F | Johnson Bixby & Associates, LLC | 14 719 | 2,06 | 342 | 2,10 | ||||
| 2025-07-30 | 13F | Mid-American Wealth Advisory Group, Inc. | 598 347 | 36,55 | 13 900 | 36,61 | ||||
| 2025-07-17 | 13F | Baron Silver Stevens Financial Advisors, Llc | 10 944 | −46,70 | 254 | −46,64 | ||||
| 2025-08-12 | 13F | BlackRock, Inc. | 34 441 | 0,33 | 800 | 0,38 | ||||
| 2025-08-14 | 13F | Wells Fargo & Company/mn | 1 064 628 | 23,99 | 24 731 | 24,04 | ||||
| 2025-08-12 | 13F | Coldstream Capital Management Inc | 0 | −100,00 | 0 | |||||
| 2025-08-05 | 13F | Cherry Tree Wealth Management, LLC | 7 621 | 0,00 | 177 | 0,57 | ||||
| 2025-07-29 | 13F | Werba Rubin Papier Wealth Management | 46 638 | 0,00 | 1 083 | 0,09 | ||||
| 2025-07-29 | 13F | International Assets Investment Management, Llc | 55 710 | 14,50 | 1 294 | 14,61 | ||||
| 2025-07-30 | 13F | Avidian Wealth Solutions, LLC | 12 435 | 289 | ||||||
| 2025-08-12 | 13F | Bedel Financial Consulting, Inc. | 31 575 | 37,55 | 733 | 38,56 | ||||
| 2025-08-14 | 13F | Snowden Capital Advisors LLC | 29 377 | 0,00 | 682 | 0,00 | ||||
| 2025-07-09 | 13F | Krilogy Financial LLC | 72 641 | −2,66 | 1 687 | −2,60 | ||||
| 2025-07-29 | 13F | Straight Path Wealth Management | 99 793 | 12,11 | 2 318 | 12,20 | ||||
| 2025-08-14 | 13F | Integrated Wealth Concepts LLC | 316 269 | 8,25 | 7 347 | 8,28 | ||||
| 2025-08-07 | 13F | PFG Advisors | 69 235 | 1 608 | ||||||
| 2025-07-22 | 13F | Steele Capital Management, Inc. | 37 803 | 0,00 | 878 | 0,11 | ||||
| 2025-08-12 | 13F | Absolute Capital Management, LLC | 61 035 | −4,83 | 1 418 | −4,84 | ||||
| 2025-07-24 | 13F | IFP Advisors, Inc | 54 911 | −20,54 | 1 276 | −20,51 | ||||
| 2025-08-14 | 13F | Colony Group, LLC | 12 832 | 0,00 | 298 | 0,34 | ||||
| 2025-07-23 | 13F | Ironwood Financial, llc | 66 160 | 0,00 | 1 536 | 0,00 | ||||
| 2025-08-12 | 13F | Cornerstone Wealth Management, LLC | 60 020 | 7,53 | 1 394 | 7,56 | ||||
| 2025-08-01 | 13F | Envestnet Asset Management Inc | 126 076 | 25,35 | 2 929 | 25,40 | ||||
| 2025-07-25 | 13F | M3 Advisory Group, LLC | 9 313 | 0,22 | 216 | 0,47 | ||||
| 2025-08-14 | 13F | Stifel Financial Corp | 15 309 | 30,89 | 356 | 31,00 | ||||
| 2025-08-07 | 13F | Nwam Llc | 31 990 | −12,40 | 743 | −12,28 | ||||
| 2025-07-30 | 13F | Phillips Financial Management, Llc | 25 436 | 0,00 | 591 | 0,00 | ||||
| 2025-07-31 | 13F | Keeler THomas Management LLC | 415 775 | 15,57 | 9 658 | 15,62 | ||||
| 2025-07-15 | 13F | MCF Advisors LLC | 29 845 | 41,77 | 693 | 42,01 | ||||
| 2025-07-29 | 13F | Private Trust Co Na | 2 345 | 9,07 | 54 | 10,20 | ||||
| 2025-08-14 | 13F | Mercer Global Advisors Inc /adv | 12 006 | 279 | ||||||
| 2025-08-12 | 13F | Tableaux Llc | 1 363 | 248 | ||||||
| 2025-08-11 | 13F | Private Advisor Group, LLC | 1 117 099 | 9,50 | 25 950 | 9,55 | ||||
| 2025-07-10 | 13F | Wealth Enhancement Advisory Services, Llc | 10 850 | 0,00 | 251 | 0,00 | ||||
| 2025-08-14 | 13F | Old Mission Capital Llc | 373 758 | 2 046,31 | 8 682 | 2 049,01 | ||||
| 2025-08-14 | 13F | Citadel Advisors Llc | 0 | −100,00 | 0 | |||||
| 2025-09-04 | 13F/A | Advisor Group Holdings, Inc. | 209 350 | 1,44 | 4 864 | 1,48 | ||||
| 2025-08-06 | 13F | Prospera Financial Services Inc | 9 067 | 211 | ||||||
| 2025-05-13 | 13F | Claudia M.p. Batlle, Crp (r) Llc | 0 | −100,00 | 0 | |||||
| 2025-08-06 | 13F | Summit Investment Advisors, Inc. | 304 244 | 4,38 | 7 043 | 4,84 | ||||
| 2025-08-14 | 13F | Bank Of America Corp /de/ | 2 146 582 | 2,46 | 49 865 | 2,50 | ||||
| 2025-07-11 | 13F | Quad-Cities Investment Group, LLC | 37 902 | 57,09 | 880 | 57,14 | ||||
| 2025-08-12 | 13F | Boreal Capital Management LLC | 0 | 228 | ||||||
| 2025-05-15 | 13F/A | Orion Portfolio Solutions, LLC | 78 255 | 1 817 | ||||||
| 2025-07-01 | 13F | Private Client Services, Llc | 129 040 | −4,96 | 2 998 | −4,92 | ||||
| 2025-07-17 | 13F | Tempus Wealth Planning, LLC | 209 534 | 11,40 | 4 867 | 11,45 | ||||
| 2025-08-15 | 13F | Scissortail Wealth Management, LLC | 140 803 | −3,43 | 3 271 | −3,40 | ||||
| 2025-08-14 | 13F | Hurley Capital, LLC | 249 860 | 15,78 | 5 804 | 15,85 | ||||
| 2025-06-23 | NP | LDRH - iShares iBonds 1-5 Year High Yield and Income Ladder ETF | 34 327 | 14,29 | 794 | 13,12 | ||||
| 2025-07-16 | 13F | Rebalance, Llc | 43 540 | 1,38 | 1 011 | 1,40 | ||||
| 2025-08-01 | 13F | Austin Private Wealth, LLC | 20 379 | 23,66 | 473 | 23,82 | ||||
| 2025-08-12 | 13F | Steward Partners Investment Advisory, Llc | 14 285 | 6,60 | 332 | 6,43 | ||||
| 2025-08-13 | 13F | Jones Financial Companies Lllp | 0 | −100,00 | 0 | |||||
| 2025-07-28 | 13F | Mutual Advisors, LLC | 271 980 | 3,15 | 6 325 | 3,49 | ||||
| 2025-08-12 | 13F | Proequities, Inc. | 0 | 0 | ||||||
| 2025-08-08 | 13F | Cetera Investment Advisers | 93 990 | 2,56 | 2 183 | 2,63 | ||||
| 2025-08-12 | 13F | Landing Point Financial Group, LLC | 53 070 | 15,60 | 1 233 | 15,68 | ||||
| 2025-08-14 | 13F | Royal Bank Of Canada | 328 597 | 33,01 | 7 633 | 33,07 | ||||
| 2025-08-14 | 13F | EP Wealth Advisors, Inc. | 148 248 | −7,67 | 3 444 | −7,64 | ||||
| 2025-07-25 | 13F | Heartland Bank & Trust Co | 20 321 | 50,06 | 472 | 50,32 | ||||
| 2025-08-15 | 13F | SkyView Investment Advisors, LLC | 149 642 | −29,67 | 3 | −25,00 | ||||
| 2025-08-12 | 13F | BWM Planning, LLC | 20 566 | 1,70 | 478 | 1,71 | ||||
| 2025-08-12 | 13F | LPL Financial LLC | 733 946 | 35,34 | 17 050 | 35,40 | ||||
| 2025-08-13 | 13F | Baird Financial Group, Inc. | 15 294 | −3,64 | 355 | −3,53 | ||||
| 2025-07-25 | 13F | Atria Wealth Solutions, Inc. | 136 632 | 1,61 | 3 174 | 1,63 | ||||
| 2025-07-10 | 13F | Klaas Financial Asset Advisors, LLC | 26 578 | −5,80 | 617 | −5,80 | ||||
| 2025-07-11 | 13F | Windsor Capital Management, LLC | 0 | −100,00 | 0 | |||||
| 2025-08-15 | 13F | Kestra Advisory Services, LLC | 13 223 | 12,05 | 307 | 12,04 | ||||
| 2025-07-29 | 13F | Koshinski Asset Management, Inc. | 22 128 | 514 | ||||||
| 2025-05-05 | 13F | Diversify Advisory Services, LLC | 0 | −100,00 | 0 | |||||
| 2025-08-12 | 13F | Jpmorgan Chase & Co | 142 | −52,67 | 3 | −50,00 | ||||
| 2025-05-02 | 13F | Sigma Planning Corp | 0 | −100,00 | 0 | |||||
| 2025-07-15 | 13F | Sightline Wealth Advisors, LLC | 69 536 | 0,08 | 1 615 | 0,12 | ||||
| 2025-07-21 | 13F | Ameriflex Group, Inc. | 6 734 | 19,46 | 156 | 20,00 | ||||
| 2025-08-04 | 13F | Creative Financial Designs Inc /adv | 5 574 | 129 | ||||||
| 2025-07-24 | 13F | Ronald Blue Trust, Inc. | 3 151 | 0,45 | 73 | 1,39 | ||||
| 2025-07-14 | 13F | Golden State Equity Partners | 37 325 | 0,47 | 867 | 0,58 | ||||
| 2025-08-14 | 13F | Straightline Group Llc | 766 062 | 4,25 | 17 796 | 4,30 | ||||
| 2025-07-23 | 13F | High Note Wealth, LLC | 150 167 | 3 488 | ||||||
| 2025-08-11 | 13F | HighTower Advisors, LLC | 349 866 | 2,54 | 8 127 | 2,59 | ||||
| 2025-07-09 | 13F | Lbmc Investment Advisors, Llc | 854 318 | 13,11 | 19 846 | 13,15 | ||||
| 2025-07-31 | 13F | Cambridge Investment Research Advisors, Inc. | 1 167 957 | 6,99 | 27 | 8,00 | ||||
| 2025-08-14 | 13F | Sunbelt Securities, Inc. | 12 750 | 0,00 | 295 | −0,34 | ||||
| 2025-08-05 | 13F | Summit Investment Advisory Services, LLC | 297 431 | 6 909 | ||||||
| 2025-08-05 | 13F | Bank Of Montreal /can/ | 1 959 | 46 | ||||||
| 2025-07-24 | 13F | Us Bancorp \de\ | 400 | 9 | ||||||
| 2025-07-08 | 13F | Parallel Advisors, LLC | 32 650 | 27,29 | 758 | 27,39 | ||||
| 2025-07-31 | 13F | Orion Capital Management LLC | 11 000 | 52,35 | 256 | 52,69 | ||||
| 2025-08-14 | 13F | Raymond James Financial Inc | 568 962 | 25,49 | 13 217 | 25,54 | ||||
| 2025-07-18 | 13F | Consolidated Portfolio Review Corp | 21 649 | 8,39 | 503 | 8,42 | ||||
| 2025-08-14 | 13F | 10Elms LLP | 10 615 | 0,00 | 247 | 0,00 | ||||
| 2025-07-24 | 13F | Robertson Stephens Wealth Management, LLC | 21 610 | 40,35 | 502 | 40,62 | ||||
| 2025-08-12 | 13F | Timber Creek Capital Management LLC | 38 802 | 12,52 | 899 | 12,25 | ||||
| 2025-07-29 | 13F | Alaska Permanent Capital Management | 10 089 | 0,56 | 234 | 0,43 | ||||
| 2025-08-07 | 13F | New England Private Wealth Advisors LLC | 9 494 | 2,27 | 221 | 2,33 | ||||
| 2025-07-15 | 13F | Carr Financial Group Corp | 83 323 | 17,66 | 1 936 | 17,70 | ||||
| 2025-08-13 | 13F | Northwestern Mutual Wealth Management Co | 798 372 | 0,87 | 18 546 | 0,92 |