Grunnleggende statistikk
| Institusjonelle eiere | 161 total, 161 long only, 0 short only, 0 long/short - change of 14,18% MRQ |
| Gjennomsnittlig porteføljeallokering | 0.5856 % - change of 14,53% MRQ |
| Institusjonelle aksjer (Long) | 20 603 562 (ex 13D/G) - change of 4,32MM shares 26,55% MRQ |
| Institusjonell verdi (Long) | $ 793 466 USD ($1000) |
Institusjonelt eierskap og aksjonærer
EA Series Trust - Freedom 100 Emerging Markets ETF (US:FRDM) har 161 institusjonelle eiere og aksjonærer som har sendt inn 13D/G- eller 13F-skjemaer til Securities Exchange Commission (SEC). Disse institusjonene eier til sammen 20,603,562 aksjer. De største aksjonærene inkluderer Retirement Planning Group, Northwestern Mutual Wealth Management Co, Wells Fargo & Company/mn, Ellevest, Inc., Tanglewood Wealth Management, Inc., Willis Johnson & Associates, Inc., Aptus Capital Advisors, LLC, Guardian Wealth Advisors, Llc / Nc, Coyle Financial Counsel LLC, and Kathmere Capital Management, LLC .
EA Series Trust - Freedom 100 Emerging Markets ETF (BATS:FRDM) institusjonell eierstruktur viser nåværende posisjoner i selskapet fordelt på institusjoner og fond, samt de siste endringene i posisjonsstørrelse. De største aksjonærene kan være individuelle investorer, verdipapirfond, hedgefond eller institusjoner. Schedule 13D indikerer at investoren eier (eller har eid) mer enn 5 % av selskapet og har til hensikt (eller hadde til hensikt) å aktivt forfølge en endring i forretningsstrategien. Schedule 13G indikerer en passiv investering på over 5 %.
The share price as of September 9, 2025 is 42,74 / share. Previously, on September 10, 2024, the share price was 33,82 / share. This represents an increase of 26,37% over that period.

Fondssentiment-score
Fondssentiment Score (også kjent som akkumulering av eierskap poengsum) viser hvilke aksjer som er mest kjøpt av fond. Den er resultatet av en sofistikert, kvantitativ flerfaktormodell som identifiserer selskaper med de høyeste nivåene av institusjonell akkumulering. Beregningsmodellen for poeng bruker en kombinasjon av den totale økningen i antall offentliggjorte eiere, endringer i porteføljeallokeringen til disse eierne og andre beregninger. Tallet går fra 0 til 100, der høyere tall indikerer en høyere grad av akkumulering i forhold til sammenlignbare selskaper, der 50 er gjennomsnittet.
Oppdateringsfrekvens: Daglig
Sjekk ut Ownership Explorer, som inneholder en liste over de høyest rangerte selskapene.
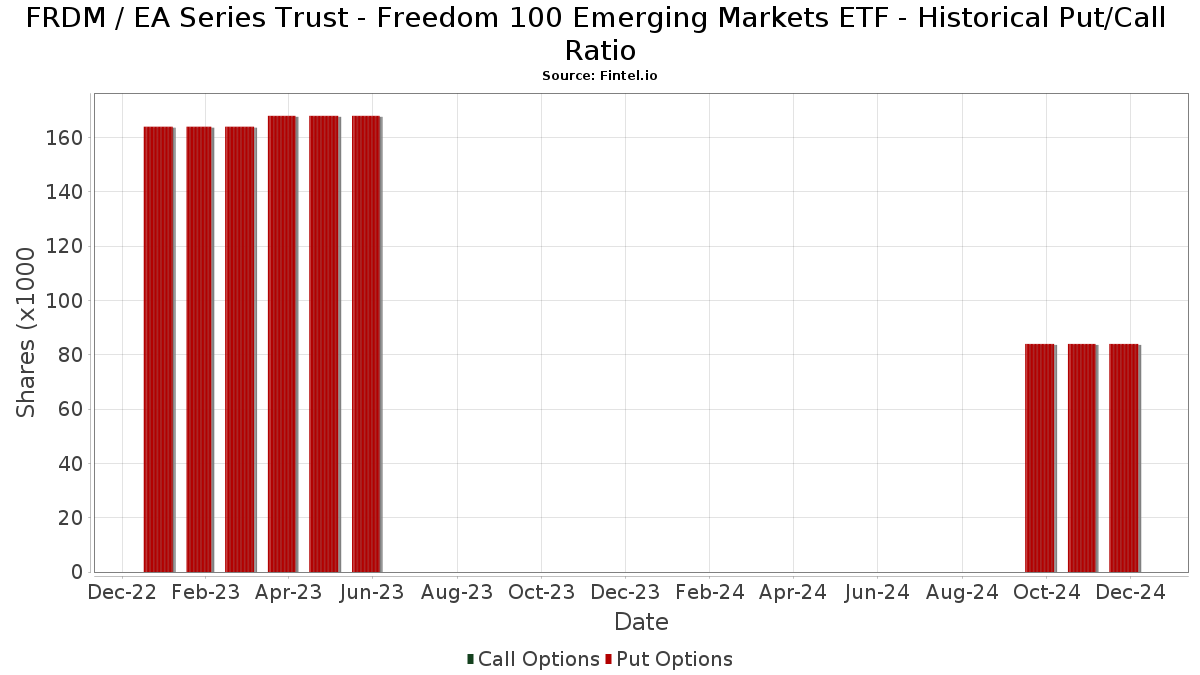
Institusjonell Put/Call-forhold
I tillegg til å rapportere standard aksje- og gjeldsemisjoner må institusjoner med mer enn 100 millioner kroner i forvaltningskapital også oppgi beholdningen av put- og callopsjoner. Siden put-opsjoner generelt indikerer et negativt sentiment, og call-opsjoner indikerer et positivt sentiment, kan vi få et inntrykk av det generelle institusjonelle sentimentet ved å plotte forholdet mellom put- og call-opsjoner. Diagrammet til høyre viser det historiske forholdet mellom put- og call-opsjoner for dette instrumentet.
Ved å bruke Put/Call-forholdet som en indikator på investorsentimentet kan man overvinne en av de viktigste svakhetene ved å bruke totalt institusjonelt eierskap, nemlig at en betydelig andel av forvaltningskapitalen investeres passivt for å følge indekser. Passivt forvaltede fond kjøper vanligvis ikke opsjoner, slik at indikatoren for put/call-forhold i større grad gjenspeiler stemningen i aktivt forvaltede fond.
13F- og NPORT-arkiveringer
Detaljer om 13F-arkiveringer er gratis. Detaljer om NP-arkiveringer krever et premium-medlemskap. Grønne rader indikerer nye posisjoner. Røde rader indikerer lukkede posisjoner. Klikk på lenke ikonet for å se hele transaksjonshistorikken.
Oppgrader
for å låse opp premiedata og eksportere til Excel. ![]() .
.
| Fildato | Kilde | Investor | Type | Gjennomsnittlig pris (estimert) |
Aksjer | Δ Aksjer (%) |
Rapportert verdi ($1000) | Verdi (%) | Portallokering (%) | |
|---|---|---|---|---|---|---|---|---|---|---|
| 2025-07-23 | 13F | Lansing Street Advisors | 37 230 | 25,76 | 1 504 | 45,03 | ||||
| 2025-08-06 | 13F | Ethos Financial Group, LLC | 51 537 | 74,11 | 2 082 | 115,31 | ||||
| 2025-08-13 | 13F | Millstone Evans Group, LLC | 634 | 0,32 | 26 | 13,64 | ||||
| 2025-08-13 | 13F | WCG Wealth Advisors LLC | 174 390 | −21,80 | 7 045 | −9,88 | ||||
| 2025-08-14 | 13F | Susquehanna International Group, Llp | 30 620 | 1 237 | ||||||
| 2025-08-07 | 13F | Mayport, Llc | 265 391 | 6,57 | 10 722 | 22,83 | ||||
| 2025-08-08 | 13F | Smithfield Trust Co | 1 328 | 0,00 | 0 | |||||
| 2025-07-25 | 13F | Commonwealth Financial Services, LLC | 259 753 | 0,84 | 10 494 | 16,24 | ||||
| 2025-07-30 | 13F | Brookstone Capital Management | 5 164 | −46,29 | 209 | −38,28 | ||||
| 2025-08-14 | 13F | Financial Network Wealth Advisors LLC | 2 119 | −32,06 | 86 | −22,02 | ||||
| 2025-07-24 | 13F | Us Bancorp \de\ | 3 858 | 21,59 | 156 | 39,64 | ||||
| 2025-08-14 | 13F | Raymond James Financial Inc | 454 117 | 16,51 | 18 346 | 34,29 | ||||
| 2025-08-07 | 13F | Sierra Ocean, Llc | 1 600 | 65 | ||||||
| 2025-07-17 | 13F | XY Planning Network, Inc. | 8 801 | 356 | ||||||
| 2025-08-13 | 13F | Jones Financial Companies Lllp | 25 396 | 157,30 | 1 019 | 194,51 | ||||
| 2025-04-25 | 13F | Smallwood Wealth Investment Management, LLC | 113 884 | 3,65 | 3 992 | 11,17 | ||||
| 2025-07-11 | 13F | Farther Finance Advisors, LLC | 236 | 293,33 | 10 | 350,00 | ||||
| 2025-08-14 | 13F | Guardian Wealth Advisors, Llc / Nc | 622 371 | 83,09 | 25 144 | 110,63 | ||||
| 2025-07-16 | 13F | Beaumont Financial Advisors, LLC | 220 075 | 14,20 | 8 891 | 31,64 | ||||
| 2025-08-14 | 13F | Mercer Global Advisors Inc /adv | 12 109 | −41,94 | 489 | −33,11 | ||||
| 2025-07-10 | 13F | Signal Advisors Wealth, LLC | 85 799 | 57,61 | 3 466 | 81,66 | ||||
| 2025-07-08 | 13F | Parallel Advisors, LLC | 5 317 | 0,00 | 215 | 15,05 | ||||
| 2025-08-12 | 13F | O'shaughnessy Asset Management, Llc | 935 | 3,89 | 38 | 19,35 | ||||
| 2025-03-12 | 13F/A | Private Capital Management Llc | 12 295 | 434 | ||||||
| 2025-08-11 | 13F | Citigroup Inc | 7 971 | 322 | ||||||
| 2025-07-10 | 13F | Redhawk Wealth Advisors, Inc. | 8 046 | 4,47 | 325 | 20,82 | ||||
| 2025-08-08 | 13F | Foundations Investment Advisors, LLC | 87 706 | 11,90 | 3 543 | 28,98 | ||||
| 2025-05-15 | 13F | Gts Securities Llc | 0 | −100,00 | 0 | |||||
| 2025-09-09 | 13F | Cambridge Financial Group, LLC | 6 883 | 0,61 | 278 | 15,83 | ||||
| 2025-07-28 | 13F | Harbour Investments, Inc. | 1 920 | 1,64 | 78 | 16,67 | ||||
| 2025-08-14 | 13F | Fmr Llc | 1 304 | −22,79 | 53 | −11,86 | ||||
| 2025-07-29 | 13F | Angeles Wealth Management, Llc | 30 072 | 1 215 | ||||||
| 2025-08-07 | 13F | 1620 Investment Advisors, Inc. | 62 574 | 4,01 | 2 528 | 19,88 | ||||
| 2025-08-14 | 13F | UBS Group AG | 813 | 33 | ||||||
| 2025-08-08 | 13F | Larson Financial Group LLC | 86 | −86,11 | 3 | −85,71 | ||||
| 2025-07-17 | 13F | Sound Income Strategies, LLC | 1 | 0 | ||||||
| 2025-07-21 | 13F | Tanglewood Wealth Management, Inc. | 1 107 772 | 48,58 | 44 754 | 71,24 | ||||
| 2025-07-30 | 13F | Strategic Blueprint, LLC | 0 | −100,00 | 0 | |||||
| 2025-07-23 | 13F | Quarry Hill Advisors, Llc | 134 479 | −1,85 | 5 433 | 13,12 | ||||
| 2025-08-06 | 13F | Prospera Financial Services Inc | 24 986 | 1 009 | ||||||
| 2025-08-07 | 13F | Resources Investment Advisors, LLC. | 160 176 | −0,73 | 6 471 | 14,43 | ||||
| 2025-08-14 | 13F | Bank Of America Corp /de/ | 12 431 | −6,56 | 502 | 7,73 | ||||
| 2025-08-13 | 13F | Willis Johnson & Associates, Inc. | 982 672 | 4,38 | 39 700 | 20,31 | ||||
| 2025-08-14 | 13F | Great Valley Advisor Group, Inc. | 178 208 | −1,74 | 7 200 | 13,25 | ||||
| 2025-08-12 | 13F | Frontier Asset Management, LLC | 7 294 | −90,97 | 295 | −89,61 | ||||
| 2025-08-13 | 13F | Baird Financial Group, Inc. | 7 940 | 321 | ||||||
| 2025-08-15 | 13F | Koesten, Hirschmann & Crabtree, INC. | 19 | 0,00 | 1 | |||||
| 2025-07-23 | 13F | Heck Capital Advisors, LLC | 249 563 | 0,22 | 10 082 | 15,51 | ||||
| 2025-08-12 | 13F | Jpmorgan Chase & Co | 184 | 0,00 | 7 | 16,67 | ||||
| 2025-08-06 | 13F | SOUTH STATE Corp | 25 440 | −15,02 | 1 028 | −2,10 | ||||
| 2025-07-11 | 13F | William Howard & Co Financial Advisors Inc | 16 137 | 0,70 | 652 | 16,04 | ||||
| 2025-08-14 | 13F | Jane Street Group, Llc | 46 326 | 1 872 | ||||||
| 2025-07-24 | 13F | IFP Advisors, Inc | 24 877 | 827,55 | 1 005 | 969,15 | ||||
| 2025-08-14 | 13F | Integrated Wealth Concepts LLC | 250 227 | 461,77 | 10 109 | 547,60 | ||||
| 2025-07-22 | 13F | Yardley Wealth Management LLC | 360 025 | −1,64 | 15 | 16,67 | ||||
| 2025-08-13 | 13F | EverSource Wealth Advisors, LLC | 30 | 0,00 | 1 | 0,00 | ||||
| 2025-07-08 | 13F | Prism Advisors, Inc. | 28 337 | −39,00 | 1 145 | −29,73 | ||||
| 2025-04-23 | 13F | Mascagni Wealth Management, Inc. | 0 | −100,00 | 0 | −100,00 | ||||
| 2025-07-18 | 13F/A | MJT & Associates Financial Advisory Group, Inc. | 685 | 28 | ||||||
| 2025-08-12 | 13F | Tableaux Llc | 15 000 | −86,72 | 15 | −99,62 | ||||
| 2025-08-13 | 13F | Northwestern Mutual Wealth Management Co | 1 438 388 | 12,01 | 58 111 | 29,10 | ||||
| 2025-08-19 | 13F | Advisory Services Network, LLC | 47 054 | 21,55 | 1 896 | 39,75 | ||||
| 2025-08-05 | 13F | Lord & Richards Wealth Management, LLC | 21 950 | 146,68 | 887 | 184,89 | ||||
| 2025-08-15 | 13F | Kestra Advisory Services, LLC | 362 962 | −0,75 | 14 664 | 14,39 | ||||
| 2025-08-15 | 13F | Morgan Stanley | 139 220 | −29,31 | 5 624 | −18,53 | ||||
| 2025-07-25 | 13F | Cwm, Llc | 31 665 | −27,02 | 1 | 0,00 | ||||
| 2025-07-23 | 13F | High Note Wealth, LLC | 178 666 | 186,57 | 7 218 | 230,34 | ||||
| 2025-07-11 | 13F/A | Umb Bank N A/mo | 200 | 0,00 | 8 | 14,29 | ||||
| 2025-05-15 | 13F | Bank Of America Corp /de/ | Put | 0 | −100,00 | 0 | −100,00 | |||
| 2025-08-11 | 13F | TD Waterhouse Canada Inc. | 1 632 | 0,00 | 66 | 14,04 | ||||
| 2025-07-21 | 13F | Investment Planning Advisors, Inc. | 416 007 | 107,51 | 16 807 | 139,16 | ||||
| 2025-05-13 | 13F/A | Magnolia Capital Advisors Llc | 26 757 | 3,61 | 874 | −4,17 | ||||
| 2025-08-12 | 13F | CIBC Private Wealth Group, LLC | 193 | 0,00 | 8 | 40,00 | ||||
| 2025-07-16 | 13F | Magnus Financial Group LLC | 32 105 | −0,12 | 1 297 | 15,19 | ||||
| 2025-07-28 | 13F | Mutual Advisors, LLC | 25 267 | 4,53 | 1 031 | 18,53 | ||||
| 2025-07-03 | 13F | TrueWealth Advisors, LLC | 128 729 | −4,52 | 5 201 | 10,03 | ||||
| 2025-08-14 | 13F | Mariner, LLC | 163 305 | −10,48 | 6 598 | 3,17 | ||||
| 2025-08-14 | 13F | Wells Fargo & Company/mn | 1 264 419 | 228,60 | 51 083 | 278,75 | ||||
| 2025-07-31 | 13F | Trademark Financial Management, LLC | 72 304 | 270,13 | 2 921 | 327,05 | ||||
| 2025-08-08 | 13F | Islay Capital Management, Llc | 71 613 | 4,53 | 2 893 | 20,49 | ||||
| 2025-08-13 | 13F | Colonial Trust Co / SC | 3 000 | 0,00 | 121 | 15,24 | ||||
| 2025-08-13 | 13F | Level Four Advisory Services, Llc | 23 568 | 0,58 | 952 | 15,96 | ||||
| 2025-08-14 | 13F | Comerica Bank | 2 401 | 0,00 | 97 | 15,48 | ||||
| 2025-07-21 | 13F | Ameritas Advisory Services, LLC | 2 133 | 86 | ||||||
| 2025-08-11 | 13F | HighTower Advisors, LLC | 396 795 | 8,89 | 16 030 | 25,50 | ||||
| 2025-07-15 | 13F | Mather Group, Llc. | 21 469 | 0,00 | 867 | 15,29 | ||||
| 2025-07-28 | 13F | Lunt Capital Management, Inc. | 62 234 | 0,81 | 2 514 | 16,23 | ||||
| 2025-08-06 | 13F | Savant Capital, LLC | 10 248 | 414 | ||||||
| 2025-08-14 | 13F | L2 Asset Management, LLC | 8 816 | 356 | ||||||
| 2025-07-17 | 13F | Janney Montgomery Scott LLC | 270 737 | 1,50 | 11 | 11,11 | ||||
| 2025-07-23 | 13F | Clear Creek Financial Management, LLC | 59 183 | −2,31 | 2 391 | 11,73 | ||||
| 2025-07-17 | 13F | HB Wealth Management, LLC | 5 300 | 214 | ||||||
| 2025-08-08 | 13F | Bailard, Inc. | 5 200 | 210 | ||||||
| 2025-08-26 | 13F/A | Thrivent Financial For Lutherans | 72 481 | −87,76 | 3 | −90,00 | ||||
| 2025-08-27 | 13F/A | Brinker Capital Investments, LLC | 55 000 | 0,00 | 2 222 | 15,31 | ||||
| 2025-05-15 | 13F/A | Orion Portfolio Solutions, LLC | 55 000 | 0,00 | 1 928 | 7,23 | ||||
| 2025-07-23 | 13F | L.K. Benson & Company, P.C. | 14 206 | 17,03 | 574 | 34,82 | ||||
| 2025-05-02 | 13F | Transcendent Capital Group LLC | 0 | −100,00 | 0 | |||||
| 2025-08-15 | 13F | Global View Capital Management LLC | 20 857 | −10,17 | 843 | 3,57 | ||||
| 2025-07-11 | 13F | SILVER OAK SECURITIES, Inc | 24 654 | 0,94 | 996 | 16,08 | ||||
| 2025-08-14 | 13F | CoreCap Advisors, LLC | 450 | 18 | ||||||
| 2025-08-14 | 13F | Coyle Financial Counsel LLC | 523 087 | 5,48 | 21 133 | 21,57 | ||||
| 2025-05-12 | 13F | Independent Advisor Alliance | 0 | −100,00 | 0 | |||||
| 2025-07-29 | 13F | Financial Guidance Group, Inc. | 31 969 | 1 292 | ||||||
| 2025-07-31 | 13F | Longview Financial Advisors, Inc. | 40 180 | 13,59 | 1 623 | 30,99 | ||||
| 2025-07-16 | 13F | Kathmere Capital Management, LLC | 519 600 | 0,78 | 20 992 | 16,15 | ||||
| 2025-07-25 | 13F | Pandora Wealth, Inc. | 45 188 | 0,65 | 1 826 | 16,02 | ||||
| 2025-08-12 | 13F | Proequities, Inc. | 0 | 0 | ||||||
| 2025-08-14 | 13F | Marshall Investment Management, Llc | 0 | −100,00 | 0 | |||||
| 2025-08-15 | 13F | Captrust Financial Advisors | 20 746 | 37,98 | 838 | 59,01 | ||||
| 2025-07-15 | 13F | Fifth Third Bancorp | 0 | −100,00 | 0 | |||||
| 2025-08-05 | 13F | Bank of New York Mellon Corp | 7 427 | 15,52 | 300 | 33,33 | ||||
| 2025-08-12 | 13F | Maripau Wealth Management Llc | 44 870 | 47,80 | 1 826 | 71,52 | ||||
| 2025-08-14 | 13F | Mml Investors Services, Llc | 55 313 | 275,44 | 2 | |||||
| 2025-08-18 | 13F/A | National Bank Of Canada /fi/ | 4 992 | 5,45 | 202 | 21,82 | ||||
| 2025-07-25 | 13F | Envestnet Portfolio Solutions, Inc. | 0 | −100,00 | 0 | |||||
| 2025-08-08 | 13F | Avantax Advisory Services, Inc. | 10 432 | 18,05 | 421 | 36,25 | ||||
| 2025-08-11 | 13F | Principal Securities, Inc. | 11 689 | 1 111,30 | 472 | 1 422,58 | ||||
| 2025-08-14 | 13F | Colony Group, LLC | 60 967 | −14,77 | 2 463 | −1,79 | ||||
| 2025-07-17 | 13F | Beacon Capital Management, LLC | 48 | 2,13 | 2 | 0,00 | ||||
| 2025-07-29 | 13F | Koshinski Asset Management, Inc. | 5 432 | 219 | ||||||
| 2025-05-06 | 13F | Venturi Wealth Management, LLC | 0 | −100,00 | 0 | |||||
| 2025-07-11 | 13F | Skyline Advisors, Inc. | 8 717 | 0,68 | 352 | 16,17 | ||||
| 2025-07-17 | 13F | Smith Anglin Financial, LLC | 11 844 | −5,87 | 478 | 8,39 | ||||
| 2025-08-13 | 13F | Townsquare Capital Llc | 0 | −100,00 | 0 | |||||
| 2025-08-07 | 13F | Tfo-tdc, Llc | 10 000 | 404 | ||||||
| 2025-08-07 | 13F | New England Private Wealth Advisors LLC | 113 580 | 1,62 | 4 597 | 17,33 | ||||
| 2025-08-08 | 13F | Creative Planning | 13 532 | 28,10 | 547 | 47,57 | ||||
| 2025-07-31 | 13F | Stegent Equity Advisors, Inc. | 11 763 | 0,00 | 475 | 15,29 | ||||
| 2025-04-21 | 13F | Nelson, Van Denburg & Campbell Wealth Management Group, LLC | 0 | −100,00 | 0 | |||||
| 2025-07-14 | 13F | AdvisorNet Financial, Inc | 1 441 | −66,57 | 58 | −61,59 | ||||
| 2025-08-06 | 13F | Stokes Family Office, LLC | 226 851 | −0,38 | 9 165 | 14,81 | ||||
| 2025-08-13 | 13F | Northern Trust Corp | 5 161 | 209 | ||||||
| 2025-05-14 | 13F | Flow Traders U.s. Llc | 0 | −100,00 | 0 | |||||
| 2025-08-13 | 13F | New Harbor Financial Group, LLC | 5 589 | −4,61 | 226 | 9,76 | ||||
| 2025-08-12 | 13F | Watchman Group, Inc. | 190 367 | −0,70 | 7 691 | 14,45 | ||||
| 2025-07-09 | 13F | Dynamic Advisor Solutions LLC | 10 109 | −3,03 | 408 | 11,78 | ||||
| 2025-08-19 | 13F | Anchor Investment Management, LLC | 5 010 | −8,98 | 202 | 5,21 | ||||
| 2025-09-04 | 13F/A | Advisor Group Holdings, Inc. | 22 443 | −37,71 | 907 | −28,32 | ||||
| 2025-04-16 | 13F | Fortitude Family Office, LLC | 0 | −100,00 | 0 | |||||
| 2025-04-10 | 13F | Clarus Wealth Advisors | 0 | −100,00 | 0 | |||||
| 2025-08-11 | 13F | Rothschild Investment Llc | 0 | −100,00 | 0 | |||||
| 2025-07-31 | 13F | Cambridge Investment Research Advisors, Inc. | 23 269 | 29,61 | 1 | |||||
| 2025-07-24 | 13F | Capital Advisors, Ltd. LLC | 8 583 | 21,31 | 0 | |||||
| 2025-08-06 | 13F | Commonwealth Equity Services, Llc | 72 132 | 5,36 | 3 | 0,00 | ||||
| 2025-08-14 | 13F | IHT Wealth Management, LLC | 7 729 | −3,04 | 312 | 11,83 | ||||
| 2025-04-28 | 13F | Strategic Financial Concepts, LLC | 0 | −100,00 | 0 | −100,00 | ||||
| 2025-08-14 | 13F | GWM Advisors LLC | 28 306 | 3,23 | 1 144 | 18,94 | ||||
| 2025-08-12 | 13F | Allen Capital Group, LLC | 33 656 | 9,53 | 1 360 | 26,18 | ||||
| 2025-08-18 | 13F | Geneos Wealth Management Inc. | 89 981 | 402,43 | 3 635 | 479,74 | ||||
| 2025-08-01 | 13F | Rossby Financial, LCC | 196 276 | 1,86 | 7 930 | 14,43 | ||||
| 2025-08-13 | 13F | Lumbard & Kellner, LLC | 154 307 | 97,17 | 6 234 | 127,27 | ||||
| 2025-08-01 | 13F | Envestnet Asset Management Inc | 356 976 | 527,54 | 14 422 | 623,58 | ||||
| 2025-08-05 | 13F | Ellevest, Inc. | 1 140 983 | 458,64 | 46 096 | 543,96 | ||||
| 2025-07-30 | 13F | Mills Wealth Advisors LLC | 5 280 | 213 | ||||||
| 2025-07-25 | 13F | We Are One Seven, LLC | 10 611 | −3,01 | 429 | 11,75 | ||||
| 2025-08-08 | 13F | Cetera Investment Advisers | 11 387 | −11,69 | 460 | 2,00 | ||||
| 2025-08-19 | 13F | Asset Dedication, LLC | 1 121 | 0,00 | 45 | 15,38 | ||||
| 2025-06-27 | NP | GIAX - Nicholas Global Equity and Income ETF | 57 776 | 22,11 | 2 089 | 29,69 | ||||
| 2025-08-04 | 13F | Center for Financial Planning, Inc. | 650 | 48,40 | 26 | 73,33 | ||||
| 2025-08-14 | 13F | Toroso Investments, LLC | 60 830 | 5,29 | 2 458 | 21,33 | ||||
| 2025-08-15 | 13F | First Heartland Consultants, Inc. | 362 182 | 14 632 | ||||||
| 2025-04-30 | 13F | Bull Oak Capital, LLC | 0 | −100,00 | 0 | |||||
| 2025-05-15 | 13F | Old Mission Capital Llc | 0 | −100,00 | 0 | |||||
| 2025-08-14 | 13F | Citadel Advisors Llc | 0 | −100,00 | 0 | |||||
| 2025-08-14 | 13F | Royal Bank Of Canada | 729 | −98,73 | 29 | −98,56 | ||||
| 2025-07-09 | 13F | Intelligence Driven Advisers, LLC | 422 619 | 25,95 | 17 074 | 45,17 | ||||
| 2025-08-01 | 13F | SwitchPoint Financial Planning, LLC | 5 644 | 228 | ||||||
| 2025-07-25 | 13F | Stephens Consulting, LLC | 187 682 | 14,25 | 7 582 | 31,70 | ||||
| 2025-08-11 | 13F | Aptus Capital Advisors, LLC | 658 174 | 91,48 | 26 590 | 120,70 | ||||
| 2025-07-15 | 13F | EWG Elevate Inc. | 93 518 | 3 778 | ||||||
| 2025-08-07 | 13F | Gs Investments, Inc. | 8 055 | 0,00 | 325 | 15,25 | ||||
| 2025-08-06 | 13F | AE Wealth Management LLC | 341 | −77,67 | 14 | −75,47 | ||||
| 2025-07-16 | 13F | ORG Partners LLC | 1 000 | 0,00 | 40 | 14,29 | ||||
| 2025-08-14 | 13F | Ancora Advisors, LLC | 3 371 | 28,47 | 136 | 49,45 | ||||
| 2025-08-12 | 13F | LPL Financial LLC | 227 106 | 25,38 | 9 175 | 44,51 | ||||
| 2025-05-15 | 13F | CAPROCK Group, Inc. | 37 747 | 1 333 | ||||||
| 2025-07-30 | 13F | Retirement Planning Group | 2 386 771 | 1,20 | 96 426 | 16,64 | ||||
| 2025-08-14 | 13F | Arete Wealth Advisors, LLC | 12 874 | −5,93 | 1 | |||||
| 2025-07-18 | 13F | Warren Street Wealth Advisors, LLC | 5 828 | 0,00 | 235 | 15,20 | ||||
| 2025-08-12 | 13F | Ameritas Investment Partners, Inc. | 94 884 | 5,72 | 3 833 | 21,88 | ||||
| 2025-07-22 | 13F | Wealthcare Advisory Partners LLC | 45 526 | 88,34 | 1 839 | 117,12 |