Grunnleggende statistikk
| Institusjonelle eiere | 109 total, 109 long only, 0 short only, 0 long/short - change of 18,48% MRQ |
| Gjennomsnittlig porteføljeallokering | 0.2906 % - change of 12,24% MRQ |
| Institusjonelle aksjer (Long) | 14 504 588 (ex 13D/G) - change of 6,12MM shares 73,09% MRQ |
| Institusjonell verdi (Long) | $ 537 683 USD ($1000) |
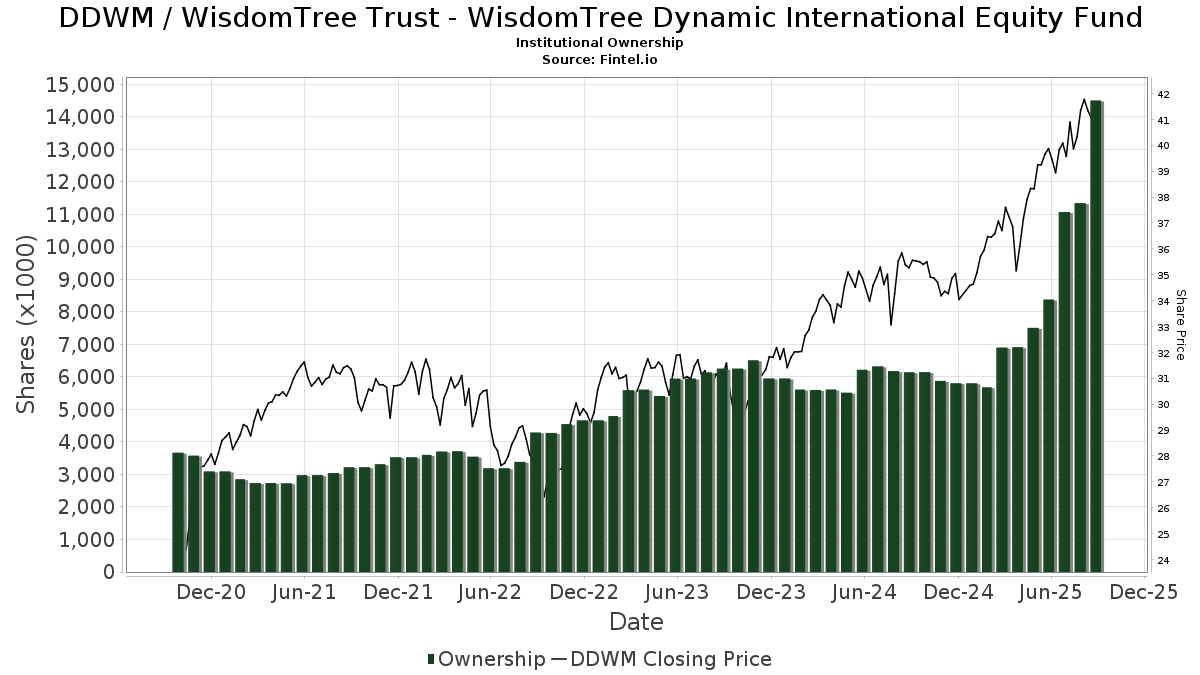
Institusjonelt eierskap og aksjonærer
WisdomTree Trust - WisdomTree Dynamic International Equity Fund (US:DDWM) har 109 institusjonelle eiere og aksjonærer som har sendt inn 13D/G- eller 13F-skjemaer til Securities Exchange Commission (SEC). Disse institusjonene eier til sammen 14,504,588 aksjer. De største aksjonærene inkluderer Park National Corp /oh/, Morgan Stanley, LPL Financial LLC, Hennion & Walsh Asset Management, Inc., Raymond James Financial Inc, Envestnet Asset Management Inc, Fundamentun, Llc, Bank Of America Corp /de/, Mml Investors Services, Llc, and Steward Partners Investment Advisory, Llc .
WisdomTree Trust - WisdomTree Dynamic International Equity Fund (BATS:DDWM) institusjonell eierstruktur viser nåværende posisjoner i selskapet fordelt på institusjoner og fond, samt de siste endringene i posisjonsstørrelse. De største aksjonærene kan være individuelle investorer, verdipapirfond, hedgefond eller institusjoner. Schedule 13D indikerer at investoren eier (eller har eid) mer enn 5 % av selskapet og har til hensikt (eller hadde til hensikt) å aktivt forfølge en endring i forretningsstrategien. Schedule 13G indikerer en passiv investering på over 5 %.
The share price as of September 12, 2025 is 41,80 / share. Previously, on September 13, 2024, the share price was 35,58 / share. This represents an increase of 17,48% over that period.
Fondssentiment-score
Fondssentiment Score (også kjent som akkumulering av eierskap poengsum) viser hvilke aksjer som er mest kjøpt av fond. Den er resultatet av en sofistikert, kvantitativ flerfaktormodell som identifiserer selskaper med de høyeste nivåene av institusjonell akkumulering. Beregningsmodellen for poeng bruker en kombinasjon av den totale økningen i antall offentliggjorte eiere, endringer i porteføljeallokeringen til disse eierne og andre beregninger. Tallet går fra 0 til 100, der høyere tall indikerer en høyere grad av akkumulering i forhold til sammenlignbare selskaper, der 50 er gjennomsnittet.
Oppdateringsfrekvens: Daglig
Sjekk ut Ownership Explorer, som inneholder en liste over de høyest rangerte selskapene.
Institusjonell Put/Call-forhold
I tillegg til å rapportere standard aksje- og gjeldsemisjoner må institusjoner med mer enn 100 millioner kroner i forvaltningskapital også oppgi beholdningen av put- og callopsjoner. Siden put-opsjoner generelt indikerer et negativt sentiment, og call-opsjoner indikerer et positivt sentiment, kan vi få et inntrykk av det generelle institusjonelle sentimentet ved å plotte forholdet mellom put- og call-opsjoner. Diagrammet til høyre viser det historiske forholdet mellom put- og call-opsjoner for dette instrumentet.
Ved å bruke Put/Call-forholdet som en indikator på investorsentimentet kan man overvinne en av de viktigste svakhetene ved å bruke totalt institusjonelt eierskap, nemlig at en betydelig andel av forvaltningskapitalen investeres passivt for å følge indekser. Passivt forvaltede fond kjøper vanligvis ikke opsjoner, slik at indikatoren for put/call-forhold i større grad gjenspeiler stemningen i aktivt forvaltede fond.
13F- og NPORT-arkiveringer
Detaljer om 13F-arkiveringer er gratis. Detaljer om NP-arkiveringer krever et premium-medlemskap. Grønne rader indikerer nye posisjoner. Røde rader indikerer lukkede posisjoner. Klikk på lenke ikonet for å se hele transaksjonshistorikken.
Oppgrader
for å låse opp premiedata og eksportere til Excel. ![]() .
.
| Fildato | Kilde | Investor | Type | Gjennomsnittlig pris (estimert) |
Aksjer | Δ Aksjer (%) |
Rapportert verdi ($1000) | Verdi (%) | Portallokering (%) | |
|---|---|---|---|---|---|---|---|---|---|---|
| 2025-07-10 | 13F | SK Wealth Management, LLC | 21 860 | 876 | ||||||
| 2025-08-19 | 13F | National Asset Management, Inc. | 26 356 | −15,19 | 1 045 | −2,15 | ||||
| 2025-07-15 | 13F | Armis Advisers, LLC | 5 978 | −13,68 | 237 | −6,69 | ||||
| 2025-08-13 | 13F | American Money Management, LLC | 10 268 | −13,53 | 407 | −6,65 | ||||
| 2025-08-12 | 13F | Steward Partners Investment Advisory, Llc | 486 524 | 4,29 | 19 296 | 12,42 | ||||
| 2025-07-29 | 13F | Signature Estate & Investment Advisors Llc | 12 518 | 1,35 | 496 | 9,25 | ||||
| 2025-08-04 | 13F | Atria Investments Llc | 140 800 | 2,58 | 5 584 | 10,60 | ||||
| 2025-07-15 | 13F | Oregon Pacific Wealth Management, LLC | 24 641 | −10,54 | 977 | −3,55 | ||||
| 2025-07-23 | 13F | REAP Financial Group, LLC | 222 | 0,00 | 9 | 0,00 | ||||
| 2025-08-14 | 13F | Smartleaf Asset Management LLC | 98 | −14,78 | 4 | −25,00 | ||||
| 2025-07-28 | 13F | Frazier Financial Advisors, LLC | 142 055 | 1,15 | 5 634 | 9,04 | ||||
| 2025-07-14 | 13F/A | Seek First Inc. | 8 820 | 0,24 | 350 | 8,05 | ||||
| 2025-07-24 | 13F | Comprehensive Money Management Services LLC | 13 748 | −5,79 | 545 | 1,68 | ||||
| 2025-08-12 | 13F | Insigneo Advisory Services, Llc | 10 773 | 427 | ||||||
| 2025-08-14 | 13F | Colony Group, LLC | 63 700 | 352,09 | 2 526 | 387,64 | ||||
| 2025-08-07 | 13F | Apeiron RIA LLC | 0 | −100,00 | 0 | |||||
| 2025-08-05 | 13F | Sigma Planning Corp | 19 207 | 48,01 | 762 | 59,54 | ||||
| 2025-07-23 | 13F | Bellevue Asset Management, Llc | 912 | 0,44 | 36 | 9,09 | ||||
| 2025-04-21 | 13F | ORG Partners LLC | 0 | −100,00 | 0 | |||||
| 2025-05-02 | 13F | Capital A Wealth Management, LLC | 0 | −100,00 | 0 | |||||
| 2025-08-12 | 13F | Global Retirement Partners, LLC | 33 223 | 1 318 | ||||||
| 2025-08-14 | 13F | Raymond James Financial Inc | 613 001 | −2,54 | 24 312 | 5,06 | ||||
| 2025-08-14 | 13F | Atomi Financial Group, Inc. | 8 294 | −78,15 | 329 | −76,50 | ||||
| 2025-08-12 | 13F | O'shaughnessy Asset Management, Llc | 11 973 | 11,53 | 475 | 20,30 | ||||
| 2025-07-18 | 13F | Truist Financial Corp | 15 779 | −0,64 | 626 | 7,02 | ||||
| 2025-08-13 | 13F | WCG Wealth Advisors LLC | 10 124 | 1,11 | 402 | 8,97 | ||||
| 2025-08-05 | 13F | GPS Wealth Strategies Group, LLC | 100 | 0,00 | 4 | 0,00 | ||||
| 2025-08-29 | 13F | Evolution Wealth Management Inc. | 12 460 | 494 | ||||||
| 2025-08-14 | 13F | Citadel Advisors Llc | 114 117 | 4 526 | ||||||
| 2025-08-14 | 13F | Gotham Asset Management, LLC | 23 019 | −2,32 | 913 | 5,31 | ||||
| 2025-07-29 | 13F | Portland Financial Advisors Inc | 6 598 | 0,00 | 262 | 7,85 | ||||
| 2025-08-19 | 13F | Asset Dedication, LLC | 104 | 4 | ||||||
| 2025-05-15 | 13F | GWM Advisors LLC | 0 | −100,00 | 0 | −100,00 | ||||
| 2025-07-28 | 13F | Ritholtz Wealth Management | 6 878 | 1,42 | 273 | 9,24 | ||||
| 2025-08-15 | 13F | Kestra Advisory Services, LLC | 103 008 | 66,98 | 4 085 | 80,04 | ||||
| 2025-08-14 | 13F | Stifel Financial Corp | 43 448 | 10,26 | 1 723 | 18,91 | ||||
| 2025-05-15 | 13F | Captrust Financial Advisors | 0 | −100,00 | 0 | |||||
| 2025-07-08 | 13F | Nbc Securities, Inc. | 20 493 | −4,87 | 1 | |||||
| 2025-07-29 | 13F | Stratos Wealth Advisors, LLC | 10 719 | 9,63 | 425 | 18,38 | ||||
| 2025-07-10 | 13F | Signal Advisors Wealth, LLC | 5 268 | 209 | ||||||
| 2025-08-18 | 13F | Geneos Wealth Management Inc. | 46 704 | 24,03 | 1 852 | 33,72 | ||||
| 2025-08-06 | 13F | Commonwealth Equity Services, Llc | 31 562 | 17,65 | 1 | |||||
| 2025-08-14 | 13F | Obsidian Personal Planning Solutions LLC | 5 423 | −8,89 | 215 | −4,44 | ||||
| 2025-07-15 | 13F | World Equity Group, Inc. | 13 790 | 20,68 | 547 | 30,00 | ||||
| 2025-07-29 | 13F | Fundamentun, Llc | 567 297 | 4,01 | 22 499 | 12,12 | ||||
| 2025-07-23 | 13F | Defined Financial Planning LLC | 5 079 | 200 | ||||||
| 2025-08-11 | 13F | Principal Securities, Inc. | 892 | 0,00 | 35 | 16,67 | ||||
| 2025-07-14 | 13F | Park Avenue Securities Llc | 6 472 | −2,31 | 0 | |||||
| 2025-08-04 | 13F | Assetmark, Inc | 114 | −30,91 | 5 | −33,33 | ||||
| 2025-07-09 | 13F | Beacon Financial Group | 9 689 | 0,00 | 384 | 7,87 | ||||
| 2025-08-14 | 13F | Glen Eagle Advisors, LLC | 110 | 0,00 | 4 | 0,00 | ||||
| 2025-07-22 | 13F | Wealthcare Advisory Partners LLC | 18 453 | 9,25 | 732 | 17,71 | ||||
| 2025-05-08 | 13F | Plante Moran Financial Advisors, LLC | 0 | −100,00 | 0 | |||||
| 2025-07-21 | 13F | Exchange Capital Management, Inc. | 441 635 | −2,58 | 17 515 | 5,02 | ||||
| 2025-08-14 | 13F | Royal Bank Of Canada | 27 699 | 803,42 | 1 099 | 872,57 | ||||
| 2025-08-14 | 13F | Money Concepts Capital Corp | 10 032 | −0,30 | 398 | 7,30 | ||||
| 2025-08-14 | 13F | UBS Group AG | 56 197 | 753,67 | 2 229 | 820,66 | ||||
| 2025-08-11 | 13F | Private Advisor Group, LLC | 20 777 | 2,08 | 824 | 10,16 | ||||
| 2025-08-14 | 13F | Mml Investors Services, Llc | 514 170 | 26,43 | 20 | 42,86 | ||||
| 2025-07-15 | 13F | Burns Matteson Capital Management, LLC | 67 312 | 2 670 | ||||||
| 2025-08-07 | 13F | BOK Financial Private Wealth, Inc. | 388 | 15 | ||||||
| 2025-07-10 | 13F | Moody National Bank Trust Division | 46 177 | 0,00 | 1 831 | 7,83 | ||||
| 2025-08-14 | 13F | Jane Street Group, Llc | 372 986 | 1 036,11 | 14 793 | 1 125,52 | ||||
| 2025-08-12 | 13F | Jpmorgan Chase & Co | 4 645 | 9,78 | 184 | 18,71 | ||||
| 2025-08-04 | 13F | Creative Financial Designs Inc /adv | 378 | −26,74 | 15 | −22,22 | ||||
| 2025-07-14 | 13F | Occidental Asset Management, LLC | 101 198 | −1,56 | 4 014 | 6,14 | ||||
| 2025-08-13 | 13F | Flow Traders U.s. Llc | 222 788 | 23,28 | 9 | 33,33 | ||||
| 2025-08-13 | 13F | Baird Financial Group, Inc. | 137 267 | −0,77 | 5 444 | 6,98 | ||||
| 2025-07-18 | 13F | Impact Capital Partners LLC | 112 066 | 1,33 | 4 445 | 9,24 | ||||
| 2025-08-14 | 13F | Bank Of America Corp /de/ | 536 086 | 9,31 | 21 261 | 17,84 | ||||
| 2025-08-14 | 13F | CoreCap Advisors, LLC | 4 021 | 11,79 | 159 | 20,45 | ||||
| 2025-08-01 | 13F | Envestnet Asset Management Inc | 575 872 | 12,25 | 22 839 | 21,01 | ||||
| 2025-07-30 | 13F | D.a. Davidson & Co. | 58 251 | 2 310 | ||||||
| 2025-07-17 | 13F | Paradigm Financial Partners, Llc | 20 154 | 7,01 | 799 | 15,46 | ||||
| 2025-08-11 | 13F | Greykasell Wealth Strategies, Inc. | 7 588 | 301 | ||||||
| 2025-08-14 | 13F | Fmr Llc | 1 125 | 307,61 | 45 | 340,00 | ||||
| 2025-05-15 | 13F | CAPROCK Group, Inc. | 56 322 | 0,32 | 2 072 | 7,36 | ||||
| 2025-07-16 | 13F | Perigon Wealth Management, LLC | 6 823 | −16,72 | 271 | −10,30 | ||||
| 2025-07-22 | 13F | Simplicity Wealth,LLC | 58 290 | 2 312 | ||||||
| 2025-07-24 | 13F | IFP Advisors, Inc | 13 309 | −19,36 | 528 | −13,18 | ||||
| 2025-07-31 | 13F | Cambridge Investment Research Advisors, Inc. | 147 612 | 23,47 | 6 | 25,00 | ||||
| 2025-07-10 | 13F | HF Advisory Group, LLC | 25 903 | −9,92 | 1 027 | −2,84 | ||||
| 2025-08-14 | 13F | Ameriprise Financial Inc | 5 700 | 0,00 | 226 | 8,13 | ||||
| 2025-08-05 | 13F | Cherry Tree Wealth Management, LLC | 3 062 | 73,39 | 121 | 89,06 | ||||
| 2025-08-14 | 13F | Susquehanna International Group, Llp | 0 | −100,00 | 0 | |||||
| 2025-08-04 | 13F | Pensionmark Financial Group, Llc | 34 575 | −17,82 | 1 371 | −11,38 | ||||
| 2025-05-08 | 13F | Harbour Investments, Inc. | 0 | −100,00 | 0 | |||||
| 2025-08-06 | 13F | AE Wealth Management LLC | 6 606 | −2,03 | 262 | 5,65 | ||||
| 2025-08-06 | 13F | Modera Wealth Management, LLC | 9 832 | 0,00 | 390 | 7,76 | ||||
| 2025-08-15 | 13F | Morgan Stanley | 1 740 805 | 844,24 | 69 040 | 917,99 | ||||
| 2025-07-01 | 13F | Park National Corp /oh/ | 2 627 025 | 104 188 | ||||||
| 2025-08-07 | 13F | WESCAP Management Group, Inc. | 10 946 | 0,00 | 434 | 7,96 | ||||
| 2025-07-25 | 13F | Concurrent Investment Advisors, LLC | 33 188 | 7,25 | 1 316 | 15,64 | ||||
| 2025-08-12 | 13F | MAI Capital Management | 4 235 | 1,03 | 168 | 8,44 | ||||
| 2025-08-14 | 13F | Comerica Bank | 1 513 | 116,76 | 60 | 140,00 | ||||
| 2025-08-13 | 13F | Northwestern Mutual Wealth Management Co | 2 329 | −95,66 | 92 | −95,34 | ||||
| 2025-08-08 | 13F | Cetera Investment Advisers | 276 351 | 4,34 | 10 960 | 12,49 | ||||
| 2025-07-23 | 13F | Tcfg Wealth Management, Llc | 32 221 | 1 278 | ||||||
| 2025-08-14 | 13F | Great Valley Advisor Group, Inc. | 5 984 | −3,06 | 237 | 4,41 | ||||
| 2025-08-08 | 13F | Foundations Investment Advisors, LLC | 5 775 | 229 | ||||||
| 2025-09-04 | 13F/A | Advisor Group Holdings, Inc. | 7 864 | 39,68 | 312 | 50,24 | ||||
| 2025-08-11 | 13F | Tidemark, LLC | 405 360 | 51,35 | 16 077 | 63,16 | ||||
| 2025-08-11 | 13F | HHM Wealth Advisors, LLC | 2 451 | 97 | ||||||
| 2025-07-22 | 13F | Ffg Retirement Advisors Llc | 100 865 | −9,37 | 4 000 | −2,30 | ||||
| 2025-07-29 | 13F | AssuredPartners Investment Advisors, LLC | 9 246 | −71,13 | 367 | −68,93 | ||||
| 2025-07-29 | 13F | Stratos Wealth Partners, LTD. | 12 540 | 0,56 | 497 | 8,52 | ||||
| 2025-08-13 | 13F | Congress Wealth Management LLC / DE / | 8 981 | 0,00 | 356 | 7,88 | ||||
| 2025-08-13 | 13F | VestGen Advisors, LLC | 139 352 | 8,83 | 5 527 | 17,32 | ||||
| 2025-08-06 | 13F | Savant Capital, LLC | 32 819 | −1,39 | 1 302 | 6,29 | ||||
| 2025-08-07 | 13F | Hennion & Walsh Asset Management, Inc. | 1 180 367 | 0,44 | 46 813 | 8,28 | ||||
| 2025-08-14 | 13F | Financial Engines Advisors L.L.C. | 12 031 | 477 | ||||||
| 2025-05-13 | 13F | Franklin Resources Inc | 0 | −100,00 | 0 | −100,00 | ||||
| 2025-08-14 | 13F | Wells Fargo & Company/mn | 1 | −50,00 | 0 | |||||
| 2025-07-29 | 13F | Crux Wealth Advisors | 14 052 | −44,99 | 557 | −40,68 | ||||
| 2025-08-11 | 13F | Rothschild Investment Llc | 650 | 0,00 | 26 | 8,70 | ||||
| 2025-08-12 | 13F | LPL Financial LLC | 1 350 030 | 85,65 | 53 542 | 100,13 | ||||
| 2025-08-11 | 13F | Western Wealth Management, LLC | 9 495 | −2,30 | 377 | 5,32 | ||||
| 2025-07-15 | 13F | Optima Capital Llc | 38 595 | −44,58 | 1 531 | −40,26 | ||||
| 2025-08-12 | 13F | Proequities, Inc. | 0 | 0 | ||||||
| 2025-05-12 | 13F | Independent Advisor Alliance | 0 | −100,00 | 0 |