Grunnleggende statistikk
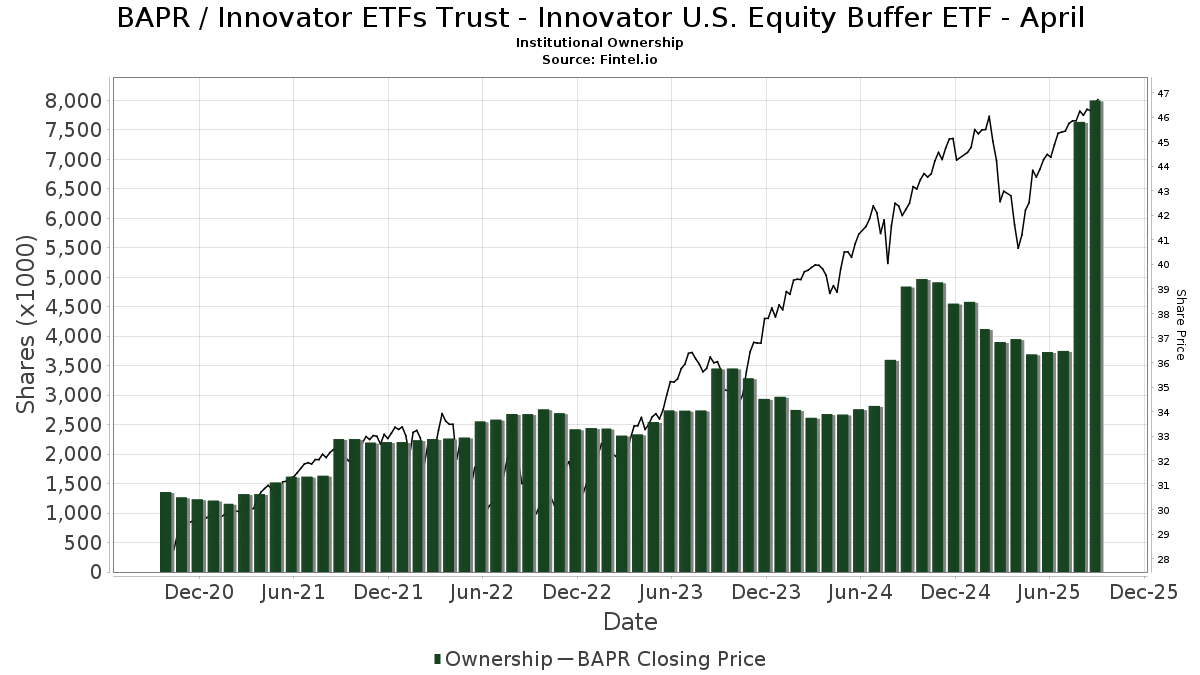
| Institusjonelle eiere | 103 total, 103 long only, 0 short only, 0 long/short - change of 10,75% MRQ |
| Gjennomsnittlig porteføljeallokering | 0.4806 % - change of 76,26% MRQ |
| Institusjonelle aksjer (Long) | 7 997 300 (ex 13D/G) - change of 4,26MM shares 114,23% MRQ |
| Institusjonell verdi (Long) | $ 315 387 USD ($1000) |
Institusjonelt eierskap og aksjonærer
Innovator ETFs Trust - Innovator U.S. Equity Buffer ETF - April (US:BAPR) har 103 institusjonelle eiere og aksjonærer som har sendt inn 13D/G- eller 13F-skjemaer til Securities Exchange Commission (SEC). Disse institusjonene eier til sammen 7,997,300 aksjer. De største aksjonærene inkluderer Stuart Chaussee & Associates, Inc., Gradient Investments LLC, Brookstone Capital Management, Commonwealth Equity Services, Llc, Innovator ETFs Trust - Innovator Laddered Allocation Buffer ETF, Penserra Capital Management LLC, Cerity Partners LLC, Integral Investment Advisors, Inc., Raymond James Financial Inc, and HighTower Advisors, LLC .
Innovator ETFs Trust - Innovator U.S. Equity Buffer ETF - April (BATS:BAPR) institusjonell eierstruktur viser nåværende posisjoner i selskapet fordelt på institusjoner og fond, samt de siste endringene i posisjonsstørrelse. De største aksjonærene kan være individuelle investorer, verdipapirfond, hedgefond eller institusjoner. Schedule 13D indikerer at investoren eier (eller har eid) mer enn 5 % av selskapet og har til hensikt (eller hadde til hensikt) å aktivt forfølge en endring i forretningsstrategien. Schedule 13G indikerer en passiv investering på over 5 %.
The share price as of September 11, 2025 is 46,66 / share. Previously, on September 12, 2024, the share price was 42,46 / share. This represents an increase of 9,89% over that period.
Fondssentiment-score
Fondssentiment Score (også kjent som akkumulering av eierskap poengsum) viser hvilke aksjer som er mest kjøpt av fond. Den er resultatet av en sofistikert, kvantitativ flerfaktormodell som identifiserer selskaper med de høyeste nivåene av institusjonell akkumulering. Beregningsmodellen for poeng bruker en kombinasjon av den totale økningen i antall offentliggjorte eiere, endringer i porteføljeallokeringen til disse eierne og andre beregninger. Tallet går fra 0 til 100, der høyere tall indikerer en høyere grad av akkumulering i forhold til sammenlignbare selskaper, der 50 er gjennomsnittet.
Oppdateringsfrekvens: Daglig
Sjekk ut Ownership Explorer, som inneholder en liste over de høyest rangerte selskapene.
Institusjonell Put/Call-forhold
I tillegg til å rapportere standard aksje- og gjeldsemisjoner må institusjoner med mer enn 100 millioner kroner i forvaltningskapital også oppgi beholdningen av put- og callopsjoner. Siden put-opsjoner generelt indikerer et negativt sentiment, og call-opsjoner indikerer et positivt sentiment, kan vi få et inntrykk av det generelle institusjonelle sentimentet ved å plotte forholdet mellom put- og call-opsjoner. Diagrammet til høyre viser det historiske forholdet mellom put- og call-opsjoner for dette instrumentet.
Ved å bruke Put/Call-forholdet som en indikator på investorsentimentet kan man overvinne en av de viktigste svakhetene ved å bruke totalt institusjonelt eierskap, nemlig at en betydelig andel av forvaltningskapitalen investeres passivt for å følge indekser. Passivt forvaltede fond kjøper vanligvis ikke opsjoner, slik at indikatoren for put/call-forhold i større grad gjenspeiler stemningen i aktivt forvaltede fond.
13F- og NPORT-arkiveringer
Detaljer om 13F-arkiveringer er gratis. Detaljer om NP-arkiveringer krever et premium-medlemskap. Grønne rader indikerer nye posisjoner. Røde rader indikerer lukkede posisjoner. Klikk på lenke ikonet for å se hele transaksjonshistorikken.
Oppgrader
for å låse opp premiedata og eksportere til Excel. ![]() .
.
| Fildato | Kilde | Investor | Type | Gjennomsnittlig pris (estimert) |
Aksjer | Δ Aksjer (%) |
Rapportert verdi ($1000) | Verdi (%) | Portallokering (%) | |
|---|---|---|---|---|---|---|---|---|---|---|
| 2025-05-15 | 13F | Hrt Financial Lp | 0 | −100,00 | 0 | |||||
| 2025-08-11 | 13F | WPWealth LLP | 12 861 | 0,00 | 581 | 6,41 | ||||
| 2025-08-15 | 13F | Morgan Stanley | 1 763 | 0,00 | 80 | 6,76 | ||||
| 2025-07-23 | 13F | Motiv8 Investments LLC | 56 247 | 4,77 | 2 542 | 11,45 | ||||
| 2025-07-22 | 13F | Belpointe Asset Management LLC | 51 231 | 4,07 | 2 315 | 10,77 | ||||
| 2025-08-14 | 13F | Sunbelt Securities, Inc. | 48 645 | 2 238,70 | 2 155 | 2 348,86 | ||||
| 2025-08-14 | 13F | CoreCap Advisors, LLC | 6 808 | −0,04 | 308 | 6,23 | ||||
| 2025-08-14 | 13F | Beck Capital Management, Llc | 6 723 | −0,16 | 304 | 6,32 | ||||
| 2025-07-22 | 13F | Berkshire Money Management, Inc. | 21 374 | 0,00 | 966 | 6,39 | ||||
| 2025-05-15 | 13F | CAPROCK Group, Inc. | 0 | −100,00 | 0 | |||||
| 2025-08-14 | 13F | Colony Group, LLC | 8 600 | 0,00 | 389 | 6,30 | ||||
| 2025-08-01 | 13F | FSA Advisors, Inc. | 17 036 | 16,67 | 770 | 8,62 | ||||
| 2025-04-29 | 13F | Pensionmark Financial Group, Llc | 0 | −100,00 | 0 | |||||
| 2025-08-04 | 13F | Arkadios Wealth Advisors | 21 595 | 976 | ||||||
| 2025-08-07 | 13F | Runnymede Capital Advisors, Inc. | 0 | −100,00 | 0 | |||||
| 2025-08-12 | 13F | LPL Financial LLC | 155 282 | 11,08 | 7 017 | 18,19 | ||||
| 2025-07-30 | 13F | Brookstone Capital Management | 553 510 | 3 197,06 | 25 012 | 3 412,78 | ||||
| 2025-08-07 | 13F | Allworth Financial LP | 1 356 | 0,00 | 61 | 8,93 | ||||
| 2025-08-01 | 13F | Integral Investment Advisors, Inc. | 270 738 | 3,20 | 12 234 | 9,81 | ||||
| 2025-08-01 | 13F | Corrado Advisors, Llc | 4 653 | 210 | ||||||
| 2025-05-19 | 13F/A | Jane Street Group, Llc | 0 | −100,00 | 0 | −100,00 | ||||
| 2025-07-15 | 13F | Armis Advisers, LLC | 28 834 | 2,77 | 1 303 | 9,32 | ||||
| 2025-07-22 | 13F | Siligmueller & Norvid Wealth Advisors LLC | 5 600 | −26,32 | 254 | −21,12 | ||||
| 2025-05-05 | 13F | PCA Investment Advisory Services Inc. | 0 | −100,00 | 0 | |||||
| 2025-07-09 | 13F | Fragasso Group Inc. | 15 416 | 55,17 | 697 | 65,32 | ||||
| 2025-07-29 | 13F | Mattson Financial Services, LLC | 10 012 | 452 | ||||||
| 2025-08-11 | 13F | Blue Bell Private Wealth Management, Llc | 52 719 | 20,25 | 2 382 | 28,00 | ||||
| 2025-08-12 | 13F | Change Path, LLC | 7 387 | −0,34 | 334 | 6,05 | ||||
| 2025-07-17 | 13F | XML Financial, LLC | 15 643 | −0,20 | 707 | 6,17 | ||||
| 2025-08-08 | 13F | Emerald Investment Partners, Llc | 150 | 0,00 | 7 | 0,00 | ||||
| 2025-08-11 | 13F | Annis Gardner Whiting Capital Advisors, LLC | 7 700 | 348 | ||||||
| 2025-04-22 | 13F | Castleview Partners, Llc | 0 | −100,00 | 0 | |||||
| 2025-07-17 | 13F | Clear Point Advisors Inc. | 24 503 | −1,83 | 1 107 | 4,43 | ||||
| 2025-08-04 | 13F | Spire Wealth Management | 29 904 | 5,30 | 1 351 | 12,02 | ||||
| 2025-08-06 | 13F | AE Wealth Management LLC | 7 145 | 4,78 | 323 | 11,42 | ||||
| 2025-07-28 | 13F | Harbour Investments, Inc. | 13 558 | 1,22 | 613 | 7,75 | ||||
| 2025-08-08 | 13F | Cetera Investment Advisers | 74 885 | 7,76 | 3 384 | 14,64 | ||||
| 2025-08-11 | 13F | Outlook Wealth Advisors, LLC | 46 882 | −60,22 | 2 118 | −57,68 | ||||
| 2025-08-15 | 13F | Kestra Advisory Services, LLC | 52 848 | −1,16 | 2 388 | 5,20 | ||||
| 2025-08-06 | 13F | Souders Financial Advisors | 5 857 | 0,00 | 265 | 6,45 | ||||
| 2025-08-11 | 13F | Bellwether Advisors, LLC | 5 352 | 0,00 | 242 | 6,17 | ||||
| 2025-07-16 | 13F | Signaturefd, Llc | 28 341 | 1 281 | ||||||
| 2025-08-06 | 13F | Valtinson Bruner Financial Planning LLC | 23 387 | −4,46 | 1 057 | 1,64 | ||||
| 2025-08-14 | 13F | Mml Investors Services, Llc | 39 546 | 67,53 | 2 | 0,00 | ||||
| 2025-08-11 | 13F | Nations Financial Group Inc, /ia/ /adv | 7 470 | 22,46 | 338 | 30,12 | ||||
| 2025-05-15 | 13F | Old Mission Capital Llc | 0 | −100,00 | 0 | |||||
| 2025-08-08 | 13F | Comprehensive Financial Planning, Inc./PA | 39 | 0,00 | 2 | 0,00 | ||||
| 2025-07-03 | 13F | City Center Advisors, LLC | 11 597 | −4,69 | 524 | 1,55 | ||||
| 2025-08-06 | 13F | Penserra Capital Management LLC | 380 937 | −5,51 | 17 | 0,00 | ||||
| 2025-08-14 | 13F | Snowden Capital Advisors LLC | 35 079 | 0,00 | 1 585 | 6,45 | ||||
| 2025-08-12 | 13F | Proequities, Inc. | 0 | 0 | ||||||
| 2025-05-16 | 13F | Ashton Thomas Private Wealth, LLC | 0 | −100,00 | 0 | −100,00 | ||||
| 2025-07-10 | 13F | Signal Advisors Wealth, LLC | 15 290 | 691 | ||||||
| 2025-07-09 | 13F | Keystone Wealth Services, LLC | 12 704 | −3,87 | 574 | 2,32 | ||||
| 2025-08-05 | 13F | Sigma Planning Corp | 23 863 | −9,72 | 1 078 | −3,92 | ||||
| 2025-08-14 | 13F | Fmr Llc | 110 | −97,85 | 5 | −98,16 | ||||
| 2025-07-14 | 13F | AdvisorNet Financial, Inc | 170 | 8 | ||||||
| 2025-04-18 | 13F | Capital Wealth Management, Llc | 0 | −100,00 | 0 | |||||
| 2025-08-15 | 13F | Brown Financial Advisors | 11 886 | 537 | ||||||
| 2025-07-22 | 13F | My Personal CFO, LLC | 91 870 | 13,60 | 4 151 | 20,88 | ||||
| 2025-08-14 | 13F | UBS Group AG | 6 424 | 290 | ||||||
| 2025-08-13 | 13F | Townsquare Capital Llc | 0 | −100,00 | 0 | |||||
| 2025-08-12 | 13F | Tradition Wealth Management, LLC | 10 504 | 7,21 | 475 | 13,94 | ||||
| 2025-07-14 | 13F | Chris Bulman Inc | 13 156 | 131,13 | 594 | 146,47 | ||||
| 2025-08-13 | 13F | Continuum Advisory, LLC | 0 | −100,00 | 0 | −100,00 | ||||
| 2025-08-14 | 13F/A | Barclays Plc | 2 102 | 210 100,00 | 0 | |||||
| 2025-07-21 | 13F | DHJJ Financial Advisors, Ltd. | 22 240 | 8,83 | 1 005 | 15,80 | ||||
| 2025-08-05 | 13F | Integrity Financial Corp /WA | 3 922 | 0,00 | 177 | 6,63 | ||||
| 2025-08-13 | 13F | Beacon Pointe Advisors, LLC | 17 888 | 18,43 | 808 | 26,05 | ||||
| 2025-08-14 | 13F | First Commonwealth Financial Corp /pa/ | 57 112 | −0,43 | 2 581 | 5,91 | ||||
| 2025-08-12 | 13F | Steward Partners Investment Advisory, Llc | 2 540 | 0,00 | 115 | 6,54 | ||||
| 2025-07-08 | 13F | Paladin Wealth, LLC | 9 775 | 442 | ||||||
| 2025-07-24 | 13F | IFP Advisors, Inc | 1 944 | 118,67 | 88 | 135,14 | ||||
| 2025-07-11 | 13F | Lantz Financial LLC | 18 539 | 94,51 | 838 | 107,18 | ||||
| 2025-07-25 | 13F | Cwm, Llc | 167 | 0,00 | 0 | |||||
| 2025-08-19 | 13F | Cape Investment Advisory, Inc. | 100 | 0,00 | 5 | 0,00 | ||||
| 2025-07-17 | 13F | Janney Montgomery Scott LLC | 23 046 | −6,21 | 1 | 0,00 | ||||
| 2025-08-06 | 13F | Commonwealth Equity Services, Llc | 482 018 | 9,74 | 22 | 16,67 | ||||
| 2025-08-13 | 13F | Cerity Partners LLC | 378 934 | 98,44 | 17 123 | 111,16 | ||||
| 2025-07-31 | 13F | Orion Capital Management LLC | 2 670 | 0,00 | 121 | 6,19 | ||||
| 2025-08-14 | 13F | Financial Network Wealth Advisors LLC | 499 | 0,00 | 23 | 4,76 | ||||
| 2025-08-29 | 13F | Centaurus Financial, Inc. | 4 439 | 14,79 | 0 | |||||
| 2025-07-14 | 13F | Kfg Wealth Management, Llc | 4 514 | −7,00 | 204 | −1,46 | ||||
| 2025-08-12 | 13F/A | Castellan Group, LLC | 7 160 | 0,00 | 324 | 6,25 | ||||
| 2025-08-12 | 13F | SRS Capital Advisors, Inc. | 11 247 | −10,17 | 508 | −4,33 | ||||
| 2025-06-24 | NP | Innovator ETFs Trust - Innovator Laddered Allocation Buffer ETF | 405 497 | 4,51 | 17 116 | −2,58 | ||||
| 2025-04-09 | 13F | RFG Advisory, LLC | 0 | −100,00 | 0 | |||||
| 2025-07-25 | 13F | Lion Street Advisors, LLC | 6 514 | 294 | ||||||
| 2025-08-12 | 13F | Wood Tarver Financial Group, LLC | 118 | 38,82 | 0 | −100,00 | ||||
| 2025-08-11 | 13F | HighTower Advisors, LLC | 179 339 | 2,05 | 8 104 | 8,58 | ||||
| 2025-05-14 | 13F | Susquehanna International Group, Llp | 0 | −100,00 | 0 | |||||
| 2025-07-11 | 13F | Farther Finance Advisors, LLC | 6 170 | −3,29 | 279 | 2,58 | ||||
| 2025-08-13 | 13F | BCJ Capital Management, LLC | 6 803 | 6,35 | 307 | 13,28 | ||||
| 2025-07-30 | 13F | Strategic Blueprint, LLC | 30 027 | −3,00 | 1 357 | 3,20 | ||||
| 2025-08-11 | 13F | Principal Securities, Inc. | 8 724 | 3,27 | 394 | 5,35 | ||||
| 2025-07-22 | 13F | Diligent Investors, LLC | 5 733 | 0,00 | 259 | 6,58 | ||||
| 2025-07-28 | 13F | WealthPLAN Partners, LLC | 9 458 | 0,00 | 427 | 6,48 | ||||
| 2025-07-10 | 13F | Secure Asset Management, LLC | 9 022 | −0,91 | 408 | 5,44 | ||||
| 2025-07-22 | 13F | Beacon Financial Advisory LLC | 4 905 | −35,08 | 222 | −30,94 | ||||
| 2025-07-30 | 13F | IMG Wealth Management, Inc. | 3 604 | 17,28 | 163 | 24,62 | ||||
| 2025-08-01 | 13F | Envestnet Asset Management Inc | 100 317 | 59,22 | 4 533 | 69,46 | ||||
| 2025-08-08 | 13F | Capital Investment Advisory Services, LLC | 2 762 | 0,00 | 125 | 5,98 | ||||
| 2025-07-14 | 13F | Southland Equity Partners LLC | 34 707 | −0,32 | 1 568 | 6,09 | ||||
| 2025-04-16 | 13F | CRA Financial Services, LLC | 0 | −100,00 | 0 | |||||
| 2025-07-31 | 13F | Cambridge Investment Research Advisors, Inc. | 42 048 | 6,44 | 2 | 0,00 | ||||
| 2025-08-06 | 13F | Maltin Wealth Management, Inc. | 41 978 | 0,00 | 1 897 | 6,40 | ||||
| 2025-08-13 | 13F | M Holdings Securities, Inc. | 15 740 | −16,37 | 1 | |||||
| 2025-05-15 | 13F | Citadel Advisors Llc | 0 | −100,00 | 0 | |||||
| 2025-04-18 | 13F | Global Trust Asset Management, LLC | 0 | −100,00 | 0 | |||||
| 2025-08-15 | 13F | Chapman Financial Group, Llc | 19 700 | −2,42 | 890 | −0,45 | ||||
| 2025-07-29 | 13F | Stratos Wealth Advisors, LLC | 8 744 | 0,00 | 395 | 6,47 | ||||
| 2025-08-14 | 13F | Royal Bank Of Canada | 0 | −100,00 | 0 | |||||
| 2025-08-19 | 13F | Advisory Services Network, LLC | 9 708 | 0,00 | 444 | 7,77 | ||||
| 2025-09-04 | 13F/A | Advisor Group Holdings, Inc. | 158 034 | 19,61 | 7 140 | 27,25 | ||||
| 2025-08-01 | 13F | Stuart Chaussee & Associates, Inc. | 2 218 802 | 100 263 | ||||||
| 2025-08-12 | 13F | Jpmorgan Chase & Co | 4 454 | 345,40 | 201 | 378,57 | ||||
| 2025-07-08 | 13F | Gradient Investments LLC | 1 035 285 | 46 782 | ||||||
| 2025-04-14 | 13F | BCS Wealth Management | 0 | −100,00 | 0 | |||||
| 2025-08-14 | 13F | Benjamin Edwards Inc | 9 941 | 0,00 | 449 | 6,40 | ||||
| 2025-08-14 | 13F | Raymond James Financial Inc | 180 133 | 31,31 | 8 140 | 39,70 | ||||
| 2025-08-04 | 13F | Creative Financial Designs Inc /adv | 1 250 | 0,00 | 56 | 5,66 | ||||
| 2025-08-15 | 13F | Captrust Financial Advisors | 8 888 | 402 | ||||||
| 2025-08-01 | 13F | Gwn Securities Inc. | 22 849 | −67,98 | 1 035 | −66,74 |