Grunnleggende statistikk
| Institusjonelle eiere | 115 total, 115 long only, 0 short only, 0 long/short - change of −5,36% MRQ |
| Gjennomsnittlig porteføljeallokering | 0.0403 % - change of −7,18% MRQ |
| Institusjonelle aksjer (Long) | 20 784 662 (ex 13D/G) - change of −0,57MM shares −8,54% MRQ |
| Institusjonell verdi (Long) | $ 310 781 USD ($1000) |
Institusjonelt eierskap og aksjonærer
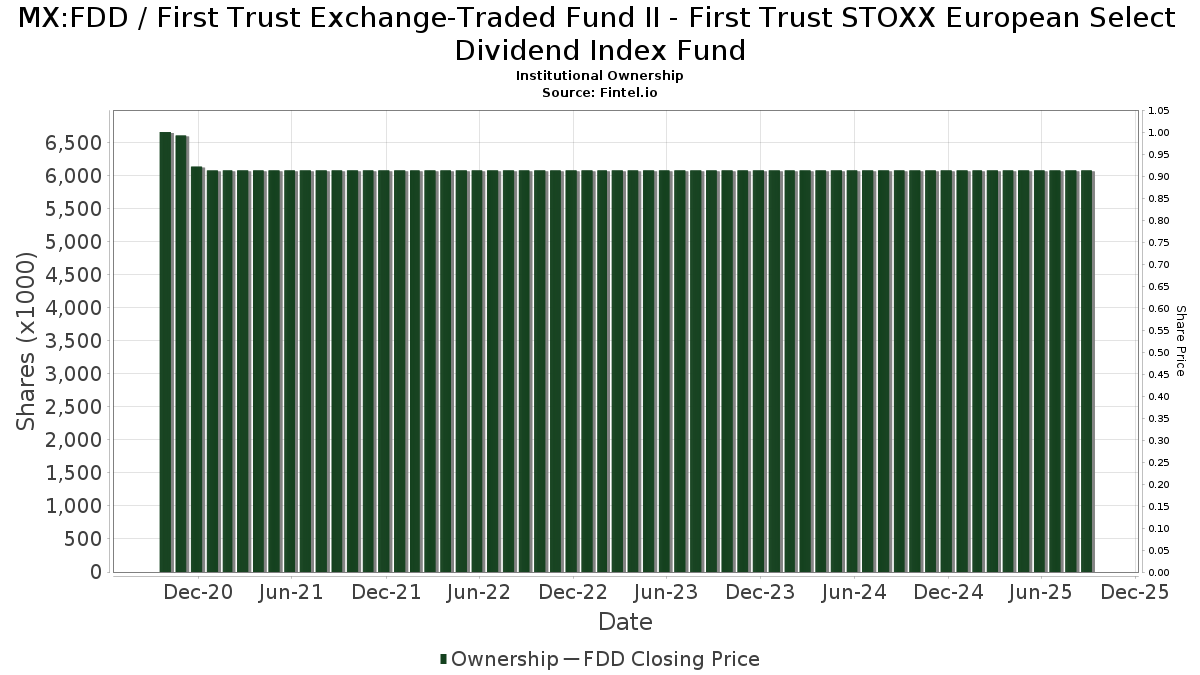
First Trust Exchange-Traded Fund II - First Trust STOXX European Select Dividend Index Fund (MX:FDD) har 115 institusjonelle eiere og aksjonærer som har sendt inn 13D/G- eller 13F-skjemaer til Securities Exchange Commission (SEC). Disse institusjonene eier til sammen 20,784,662 aksjer. De største aksjonærene inkluderer Morgan Stanley, Wells Fargo & Company/mn, Raymond James Financial Inc, Manchester Financial Inc, SMI Advisory Services, LLC, UBS Group AG, LPL Financial LLC, ODonnell Financial Services, LLC, Ameriprise Financial Inc, and Intellectus Partners, LLC .
First Trust Exchange-Traded Fund II - First Trust STOXX European Select Dividend Index Fund (BMV:FDD) institusjonell eierstruktur viser nåværende posisjoner i selskapet fordelt på institusjoner og fond, samt de siste endringene i posisjonsstørrelse. De største aksjonærene kan være individuelle investorer, verdipapirfond, hedgefond eller institusjoner. Schedule 13D indikerer at investoren eier (eller har eid) mer enn 5 % av selskapet og har til hensikt (eller hadde til hensikt) å aktivt forfølge en endring i forretningsstrategien. Schedule 13G indikerer en passiv investering på over 5 %.
Fondssentiment-score
Fondssentiment Score (også kjent som akkumulering av eierskap poengsum) viser hvilke aksjer som er mest kjøpt av fond. Den er resultatet av en sofistikert, kvantitativ flerfaktormodell som identifiserer selskaper med de høyeste nivåene av institusjonell akkumulering. Beregningsmodellen for poeng bruker en kombinasjon av den totale økningen i antall offentliggjorte eiere, endringer i porteføljeallokeringen til disse eierne og andre beregninger. Tallet går fra 0 til 100, der høyere tall indikerer en høyere grad av akkumulering i forhold til sammenlignbare selskaper, der 50 er gjennomsnittet.
Oppdateringsfrekvens: Daglig
Sjekk ut Ownership Explorer, som inneholder en liste over de høyest rangerte selskapene.
13F- og NPORT-arkiveringer
Detaljer om 13F-arkiveringer er gratis. Detaljer om NP-arkiveringer krever et premium-medlemskap. Grønne rader indikerer nye posisjoner. Røde rader indikerer lukkede posisjoner. Klikk på lenke ikonet for å se hele transaksjonshistorikken.
Oppgrader
for å låse opp premiedata og eksportere til Excel. ![]() .
.
| Fildato | Kilde | Investor | Type | Gjennomsnittlig pris (estimert) |
Aksjer | Δ Aksjer (%) |
Rapportert verdi ($1000) | Verdi (%) | Portallokering (%) | |
|---|---|---|---|---|---|---|---|---|---|---|
| 2025-08-06 | 13F | Wedbush Securities Inc | 25 055 | 0,00 | 0 | |||||
| 2025-08-14 | 13F | Raymond James Financial Inc | 1 491 557 | 609,22 | 23 179 | 712,41 | ||||
| 2025-08-14 | 13F | Susquehanna International Group, Llp | 29 323 | 456 | ||||||
| 2025-07-08 | 13F | Nbc Securities, Inc. | 2 192 | 0,00 | 0 | |||||
| 2025-08-06 | 13F | Commonwealth Equity Services, Llc | 100 802 | −29,70 | 2 | 0,00 | ||||
| 2025-07-17 | 13F | Forefront Wealth Management Inc. | 157 967 | 2 455 | ||||||
| 2025-08-14 | 13F | Treasure Coast Financial Planning | 13 493 | 7,75 | 210 | 23,67 | ||||
| 2025-06-30 | NP | SMIFX - Sound Mind Investing Fund | 427 620 | 6 128 | ||||||
| 2025-08-05 | 13F | Ciovacco Capital Management LLC | 34 994 | 544 | ||||||
| 2025-08-27 | 13F/A | Brinker Capital Investments, LLC | 32 600 | −30,87 | 507 | −20,81 | ||||
| 2025-07-31 | 13F | Topsail Wealth Management, LLC | 14 060 | 218 | ||||||
| 2025-08-14 | 13F | Wells Fargo & Company/mn | 2 494 548 | 474,53 | 38 765 | 558,04 | ||||
| 2025-07-17 | 13F | Sound Income Strategies, LLC | 87 | 1 | ||||||
| 2025-08-04 | 13F | Spire Wealth Management | 0 | −100,00 | 0 | |||||
| 2025-08-12 | 13F | Proequities, Inc. | 0 | 0 | ||||||
| 2025-08-08 | 13F | Cetera Investment Advisers | 57 259 | 178,40 | 890 | 218,64 | ||||
| 2025-08-13 | 13F | Flow Traders U.s. Llc | 32 694 | 1 | ||||||
| 2025-08-14 | 13F | Goldman Sachs Group Inc | 16 304 | 253 | ||||||
| 2025-07-25 | 13F | Envestnet Portfolio Solutions, Inc. | 47 936 | −7,26 | 745 | 6,13 | ||||
| 2025-08-04 | 13F | Integrity Alliance, Llc. | 29 086 | 452 | ||||||
| 2025-08-06 | 13F | Strategic Financial Partners, Ltd. | 14 910 | 0,17 | 232 | 14,93 | ||||
| 2025-08-11 | 13F | Principal Securities, Inc. | 14 086 | −25,14 | 219 | 3,32 | ||||
| 2025-08-18 | 13F | Geneos Wealth Management Inc. | 750 | −48,28 | 12 | −42,11 | ||||
| 2025-05-15 | 13F/A | Orion Portfolio Solutions, LLC | 47 160 | −3,89 | 640 | 15,76 | ||||
| 2025-05-12 | 13F | Virtu Financial LLC | 0 | −100,00 | 0 | |||||
| 2025-07-24 | 13F | Blair William & Co/il | 3 000 | 47 | ||||||
| 2025-07-29 | 13F | International Assets Investment Management, Llc | 44 010 | 684 | ||||||
| 2025-08-14 | 13F/A | Rockefeller Capital Management L.P. | 114 170 | 26,49 | 1 774 | 44,93 | ||||
| 2025-08-06 | 13F | Prospera Financial Services Inc | 156 115 | 2 426 | ||||||
| 2025-07-18 | 13F | SMI Advisory Services, LLC | 1 247 631 | 19 338 | ||||||
| 2025-07-18 | 13F | Truist Financial Corp | 120 316 | 620,15 | 1 870 | 726,99 | ||||
| 2025-07-17 | 13F | Janney Montgomery Scott LLC | 380 881 | 93,91 | 6 | 150,00 | ||||
| 2025-08-06 | 13F | Moors & Cabot, Inc. | 22 366 | 348 | ||||||
| 2025-08-14 | 13F | Susquehanna International Group, Llp | Call | 0 | −100,00 | 0 | ||||
| 2025-08-14 | 13F | Benjamin Edwards Inc | 20 521 | −11,76 | 319 | 0,95 | ||||
| 2025-08-08 | 13F | SBI Securities Co., Ltd. | 6 438 | 137,04 | 100 | 177,78 | ||||
| 2025-08-01 | 13F | Rossby Financial, LCC | 401 | 0,00 | 6 | 20,00 | ||||
| 2025-07-29 | 13F | Balboa Wealth Partners | 32 459 | 171,35 | 504 | 211,11 | ||||
| 2025-08-12 | 13F | Change Path, LLC | 20 361 | −23,72 | 316 | −12,71 | ||||
| 2025-08-13 | 13F | Continuum Advisory, LLC | 0 | −100,00 | 0 | |||||
| 2025-08-13 | 13F | BlackDiamond Wealth Management Inc. | 10 952 | −1,32 | 170 | 4,94 | ||||
| 2025-07-24 | 13F | IFP Advisors, Inc | 342 112 | 14 748,61 | 5 316 | 17 048,39 | ||||
| 2025-09-04 | 13F/A | Advisor Group Holdings, Inc. | 569 857 | 6 008,45 | 8 855 | 6 927,78 | ||||
| 2025-07-11 | 13F | Pinnacle Bancorp, Inc. | 104 | 0,00 | 2 | 0,00 | ||||
| 2025-07-16 | 13F | Owen LaRue, LLC | 151 421 | −61,65 | 2 353 | −56,08 | ||||
| 2025-08-04 | 13F | Atria Investments Llc | 414 962 | 3 906,97 | 6 449 | 4 505,71 | ||||
| 2025-07-31 | 13F | Hobart Private Capital, LLC | 154 669 | 11,65 | 2 404 | 27,89 | ||||
| 2025-08-13 | 13F | Jones Financial Companies Lllp | 71 719 | 940,46 | 1 110 | 1 080,85 | ||||
| 2025-07-21 | 13F | J2 Capital Management Inc | 41 716 | 648 | ||||||
| 2025-07-14 | 13F | GAMMA Investing LLC | 2 775 | 0,00 | 43 | 16,22 | ||||
| 2025-08-14 | 13F | UBS Group AG | 1 154 637 | 81,04 | 17 943 | 107,34 | ||||
| 2025-08-12 | 13F | LPL Financial LLC | 749 713 | 58,93 | 11 651 | 82,00 | ||||
| 2025-07-28 | 13F | BRYN MAWR TRUST Co | 4 300 | 67 | ||||||
| 2025-07-30 | 13F | BlueChip Wealth Advisors LLC | 63 436 | −5,08 | 986 | 8,72 | ||||
| 2025-08-18 | 13F/A | National Bank Of Canada /fi/ | 1 200 | 71,43 | 19 | 100,00 | ||||
| 2025-07-28 | 13F | Harbour Investments, Inc. | 155 443 | −4,72 | 2 416 | 9,13 | ||||
| 2025-07-08 | 13F | Next Level Private LLC | 163 272 | 0,71 | 2 537 | 15,32 | ||||
| 2025-08-07 | 13F | Kestra Private Wealth Services, Llc | 75 227 | −2,28 | 1 169 | 11,97 | ||||
| 2025-08-14 | 13F | Comerica Bank | 46 757 | −6,70 | 727 | 6,76 | ||||
| 2025-07-29 | 13F | Stephens Inc /ar/ | 35 758 | −0,56 | 556 | 13,96 | ||||
| 2025-08-13 | 13F | Twin Peaks Wealth Advisors, LLC | 4 216 | 68 | ||||||
| 2025-08-14 | 13F | Integrated Wealth Concepts LLC | 94 796 | 4,38 | 1 473 | 19,56 | ||||
| 2025-05-15 | 13F | Hrt Financial Lp | 0 | −100,00 | 0 | |||||
| 2025-08-14 | 13F | Mml Investors Services, Llc | 109 515 | 886,62 | 2 | |||||
| 2025-08-05 | 13F | Intellectus Partners, LLC | 632 650 | 2,76 | 9 831 | 17,68 | ||||
| 2025-08-15 | 13F | Fsb Premier Wealth Management, Inc. | 11 116 | 0,22 | 173 | 14,67 | ||||
| 2025-08-13 | 13F | Gateway Wealth Partners, LLC | 28 588 | 29,94 | 444 | 48,99 | ||||
| 2025-07-31 | 13F | Oppenheimer & Co Inc | 10 000 | 155 | ||||||
| 2025-08-15 | 13F | Kestra Advisory Services, LLC | 57 099 | 167,89 | 887 | 206,92 | ||||
| 2025-07-23 | 13F | Tcfg Wealth Management, Llc | 103 350 | −0,42 | 1 606 | 14,06 | ||||
| 2025-08-01 | 13F | Envestnet Asset Management Inc | 255 278 | 57,84 | 3 967 | 80,81 | ||||
| 2025-07-16 | 13F | ORG Partners LLC | 28 500 | 466 | ||||||
| 2025-08-08 | 13F | Pnc Financial Services Group, Inc. | 3 793 | −15,20 | 59 | −3,33 | ||||
| 2025-07-22 | 13F | Belpointe Asset Management LLC | 22 905 | 356 | ||||||
| 2025-08-14 | 13F | Colony Group, LLC | 39 343 | −12,56 | 611 | 0,16 | ||||
| 2025-08-14 | 13F | Ameriprise Financial Inc | 650 174 | 53,73 | 10 081 | 75,66 | ||||
| 2025-08-14 | 13F | Harwood Advisory Group, LLC | 2 157 | −5,48 | 34 | 32,00 | ||||
| 2025-08-19 | 13F | Advisory Services Network, LLC | 15 493 | 237 | ||||||
| 2025-07-09 | 13F | Murphy, Middleton, Hinkle & Parker, Inc. | 107 446 | 0,00 | 1 458 | 0,00 | ||||
| 2025-08-15 | 13F | Tower Research Capital LLC (TRC) | 0 | −100,00 | 0 | |||||
| 2025-07-11 | 13F | Farther Finance Advisors, LLC | 1 792 | 3,76 | 28 | 17,39 | ||||
| 2025-08-13 | 13F | Baird Financial Group, Inc. | 20 153 | 56,80 | 313 | 79,89 | ||||
| 2025-08-05 | 13F | Prosperity Wealth Management, Inc. | 14 600 | 227 | ||||||
| 2025-08-12 | 13F | Steward Partners Investment Advisory, Llc | 164 659 | 3 531,65 | 2 559 | 4 093,44 | ||||
| 2025-08-14 | 13F | GWM Advisors LLC | 14 105 | 219 | ||||||
| 2025-08-19 | 13F | Newbridge Financial Services Group, Inc. | 13 879 | 216 | ||||||
| 2025-07-16 | 13F | Register Financial Advisors LLC | 12 719 | 198 | ||||||
| 2025-08-08 | 13F | MTM Investment Management, LLC | 1 500 | 23 | ||||||
| 2025-08-14 | 13F | Fmr Llc | 5 716 | 89 | ||||||
| 2025-07-29 | 13F | ODonnell Financial Services, LLC | 747 517 | 11 616 | ||||||
| 2025-08-14 | 13F | Royal Bank Of Canada | 110 349 | 333,95 | 1 715 | 395,66 | ||||
| 2025-05-15 | 13F | Citadel Advisors Llc | Put | 0 | −100,00 | 0 | −100,00 | |||
| 2025-08-14 | 13F | Atomi Financial Group, Inc. | 13 879 | 216 | ||||||
| 2025-05-08 | 13F | Armis Advisers, LLC | 0 | −100,00 | 0 | |||||
| 2025-07-11 | 13F | SILVER OAK SECURITIES, Inc | 20 056 | 25,37 | 312 | 42,66 | ||||
| 2025-08-07 | 13F | Private Advisory Group LLC | 92 110 | 1 431 | ||||||
| 2025-07-21 | 13F | Ameritas Advisory Services, LLC | 209 | 3 | ||||||
| 2025-07-17 | 13F | Raleigh Capital Management Inc. | 783 | 1,42 | 12 | 20,00 | ||||
| 2025-08-14 | 13F | Jane Street Group, Llc | 400 000 | 161,23 | 6 216 | 199,28 | ||||
| 2025-08-14 | 13F | Bank Of America Corp /de/ | 273 362 | −16,36 | 4 248 | −4,22 | ||||
| 2025-08-12 | 13F | Global Retirement Partners, LLC | 5 843 | 1 603,50 | 91 | 2 900,00 | ||||
| 2025-07-23 | 13F | Foresight Capital Management Advisors, Inc. | 195 185 | 3 033 | ||||||
| 2025-07-31 | 13F | Cambridge Investment Research Advisors, Inc. | 60 260 | 10,88 | 1 | |||||
| 2025-07-10 | 13F | Wealth Enhancement Advisory Services, Llc | 24 946 | 389 | ||||||
| 2025-07-29 | 13F | Manchester Financial Inc | 1 382 182 | 21 479 | ||||||
| 2025-07-29 | 13F | Cottonwood Capital Advisors, Llc | 33 170 | −0,18 | 515 | 14,44 | ||||
| 2025-08-14 | 13F | Citadel Advisors Llc | Call | 0 | −100,00 | 0 | ||||
| 2025-04-30 | 13F | Allworth Financial LP | 0 | −100,00 | 0 | |||||
| 2025-08-01 | 13F | Liberty Wealth Management Llc | 14 770 | 1,29 | 230 | 16,24 | ||||
| 2025-08-12 | 13F | Jaffetilchin Investment Partners, LLC | 0 | −100,00 | 0 | |||||
| 2025-07-22 | 13F | Berger Financial Group, Inc | 16 543 | 4,21 | 257 | 19,53 | ||||
| 2025-08-12 | 13F | Wisconsin Wealth Advisors, LLC | 52 722 | 819 | ||||||
| 2025-08-12 | 13F | Jpmorgan Chase & Co | 1 772 | 28 | ||||||
| 2025-08-14 | 13F | Snowden Capital Advisors LLC | 30 012 | 52,64 | 466 | 75,19 | ||||
| 2025-08-14 | 13F | Citadel Advisors Llc | 50 089 | 109,35 | 778 | 140,12 | ||||
| 2025-08-15 | 13F | Morgan Stanley | 2 689 945 | 28,45 | 41 802 | 47,10 | ||||
| 2025-08-04 | 13F | Flagship Harbor Advisors, Llc | 198 437 | 3 084 | ||||||
| 2025-06-30 | NP | SMILX - SMI 50/40/10 Fund | 114 510 | 1 641 | ||||||
| 2025-07-17 | 13F | Lee Johnson Capital Management, Llc | 22 640 | 352 | ||||||
| 2025-07-25 | 13F | Concurrent Investment Advisors, LLC | 28 514 | 97,62 | 443 | 127,18 | ||||
| 2025-08-15 | 13F | Equitable Holdings, Inc. | 181 155 | 47,82 | 2 815 | 69,27 | ||||
| 2025-08-05 | 13F | Sigma Planning Corp | 17 416 | 2,65 | 271 | 17,39 | ||||
| 2025-08-14 | 13F | Stifel Financial Corp | 40 752 | 27,75 | 633 | 46,53 | ||||
| 2025-08-12 | 13F | MAI Capital Management | 120 | 0,00 | 2 | 0,00 | ||||
| 2025-07-15 | 13F | Elevated Capital Advisors, LLC | 49 419 | 0,00 | 671 | 0,00 | ||||
| 2025-07-23 | 13F | Bellevue Asset Management, Llc | 1 202 | 0,59 | 19 | 12,50 | ||||
| 2025-08-20 | 13F/A | Coppell Advisory Solutions LLC | 26 069 | 96,29 | 404 | 110,42 |
Other Listings
| US:FDD | USD 16,04 |