Grunnleggende statistikk
| Institusjonelle eiere | 74 total, 68 long only, 1 short only, 5 long/short - change of 2,78% MRQ |
| Aksjekurs | 7,45 |
| Gjennomsnittlig porteføljeallokering | 0.2319 % - change of −6,23% MRQ |
| Institusjonelle aksjer (Long) | 16 572 407 (ex 13D/G) - change of 1,05MM shares 6,76% MRQ |
| Institusjonell verdi (Long) | $ 180 590 USD ($1000) |
Institusjonelt eierskap og aksjonærer
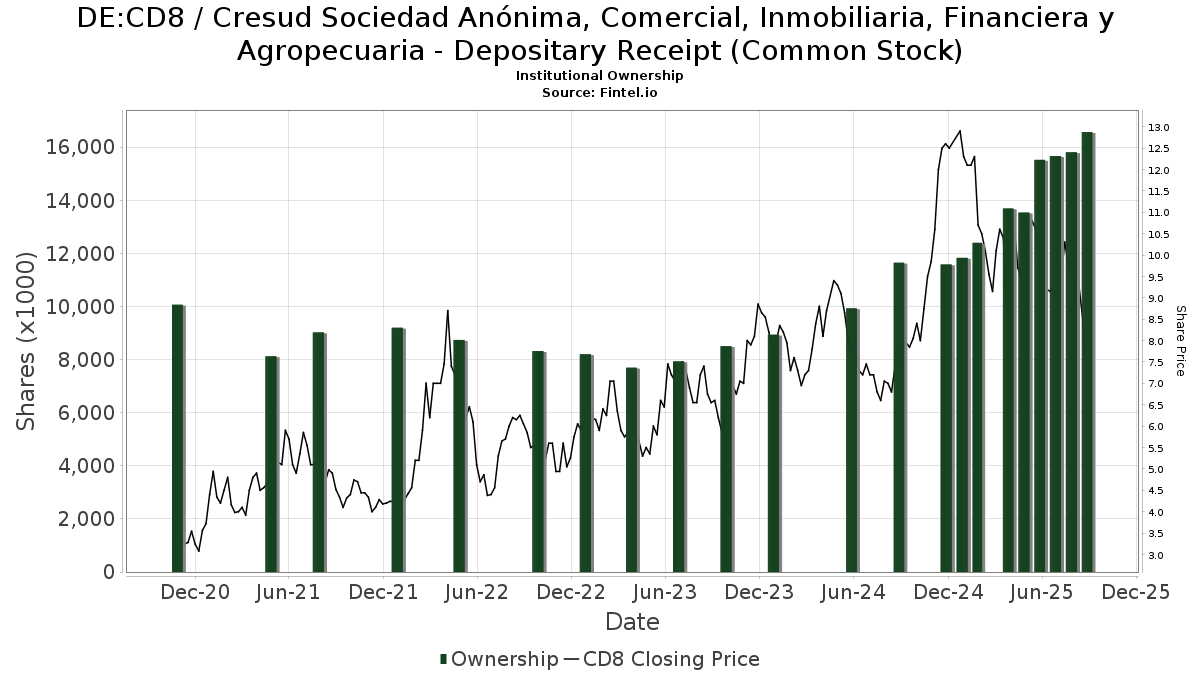
Cresud Sociedad Anónima, Comercial, Inmobiliaria, Financiera y Agropecuaria - Depositary Receipt (Common Stock) (DE:CD8) har 74 institusjonelle eiere og aksjonærer som har sendt inn 13D/G- eller 13F-skjemaer til Securities Exchange Commission (SEC). Disse institusjonene eier til sammen 16,573,351 aksjer. De største aksjonærene inkluderer Kopernik Global Investors, LLC, Macquarie Group Ltd, DEMAX - Delaware Emerging Markets Fund Class A, Gmt Capital Corp, ARGT - Global X MSCI Argentina ETF, MIRAE ASSET GLOBAL ETFS HOLDINGS Ltd., KGGAX - KOPERNIK GLOBAL ALL-CAP FUND CLASS A SHARES, 683 Capital Management, LLC, Hosking Partners LLP, and VR Advisory Services Ltd .
Cresud Sociedad Anónima, Comercial, Inmobiliaria, Financiera y Agropecuaria - Depositary Receipt (Common Stock) (DB:CD8) institusjonell eierstruktur viser nåværende posisjoner i selskapet fordelt på institusjoner og fond, samt de siste endringene i posisjonsstørrelse. De største aksjonærene kan være individuelle investorer, verdipapirfond, hedgefond eller institusjoner. Schedule 13D indikerer at investoren eier (eller har eid) mer enn 5 % av selskapet og har til hensikt (eller hadde til hensikt) å aktivt forfølge en endring i forretningsstrategien. Schedule 13G indikerer en passiv investering på over 5 %.
The share price as of September 12, 2025 is 7,45 / share. Previously, on September 13, 2024, the share price was 8,05 / share. This represents a decline of 7,45% over that period.
Fondssentiment-score
Fondssentiment Score (også kjent som akkumulering av eierskap poengsum) viser hvilke aksjer som er mest kjøpt av fond. Den er resultatet av en sofistikert, kvantitativ flerfaktormodell som identifiserer selskaper med de høyeste nivåene av institusjonell akkumulering. Beregningsmodellen for poeng bruker en kombinasjon av den totale økningen i antall offentliggjorte eiere, endringer i porteføljeallokeringen til disse eierne og andre beregninger. Tallet går fra 0 til 100, der høyere tall indikerer en høyere grad av akkumulering i forhold til sammenlignbare selskaper, der 50 er gjennomsnittet.
Oppdateringsfrekvens: Daglig
Sjekk ut Ownership Explorer, som inneholder en liste over de høyest rangerte selskapene.
13F- og NPORT-arkiveringer
Detaljer om 13F-arkiveringer er gratis. Detaljer om NP-arkiveringer krever et premium-medlemskap. Grønne rader indikerer nye posisjoner. Røde rader indikerer lukkede posisjoner. Klikk på lenke ikonet for å se hele transaksjonshistorikken.
Oppgrader
for å låse opp premiedata og eksportere til Excel. ![]() .
.
| Fildato | Kilde | Investor | Type | Gjennomsnittlig pris (estimert) |
Aksjer | Δ Aksjer (%) |
Rapportert verdi ($1000) | Verdi (%) | Portallokering (%) | |
|---|---|---|---|---|---|---|---|---|---|---|
| 2025-08-14 | 13F | Point72 Asset Management, L.P. | 92 900 | 359,90 | 1 000 | 347,98 | ||||
| 2025-08-14 | 13F | Raymond James Financial Inc | 2 346 | 25 | ||||||
| 2025-06-18 | NP | RMYAX - Multi-Strategy Income Fund Class A | 2 144 | 0,00 | 24 | −14,81 | ||||
| 2025-07-21 | 13F | Ping Capital Management, Inc. | 160 800 | 0,19 | 1 730 | −2,43 | ||||
| 2025-08-14 | 13F | Gmt Capital Corp | 1 569 608 | 52,92 | 16 889 | 48,91 | ||||
| 2025-08-14 | 13F | Royal Bank Of Canada | 605 | 0,00 | 7 | 0,00 | ||||
| 2025-08-11 | 13F | Brown Brothers Harriman & Co | 0 | −100,00 | 0 | |||||
| 2025-08-13 | 13F | Invesco Ltd. | 50 258 | −2,46 | 541 | −5,10 | ||||
| 2025-07-30 | NP | APIE - ActivePassive International Equity ETF | 5 592 | 67 | ||||||
| 2025-07-09 | 13F | Crocodile Capital Partners GmbH | 142 563 | 78,20 | 1 534 | 73,42 | ||||
| 2025-07-24 | NP | FNCMX - Fidelity Nasdaq Composite Index Fund This fund is a listed as child fund of Fmr Llc and if that institution has disclosed ownership in this security, then these positions will not be double counted when calculating total shares and total value | 33 826 | 0,00 | 405 | 12,53 | ||||
| 2025-07-30 | 13F | Financial Perspectives, Inc | 110 | 0,00 | 1 | 0,00 | ||||
| 2025-08-14 | 13F | Wells Fargo & Company/mn | 1 | 0,00 | 0 | |||||
| 2025-08-13 | 13F | Jones Financial Companies Lllp | 456 | 0,00 | 5 | −20,00 | ||||
| 2025-09-04 | 13F/A | Advisor Group Holdings, Inc. | 2 256 | 115,68 | 24 | 118,18 | ||||
| 2025-08-12 | 13F | BlackRock, Inc. | 82 327 | −5,44 | 886 | −8,00 | ||||
| 2025-08-14 | 13F | Citadel Advisors Llc | 58 335 | 628 | ||||||
| 2025-08-14 | 13F | Citadel Advisors Llc | Call | 44 700 | −20,46 | 481 | −22,71 | |||
| 2025-08-14 | 13F | Citadel Advisors Llc | Put | 20 800 | −59,06 | 224 | −60,25 | |||
| 2025-07-18 | 13F | Truist Financial Corp | 26 240 | 0,00 | 282 | −2,42 | ||||
| 2025-08-14 | 13F | Jane Street Group, Llc | Put | 15 300 | 165 | |||||
| 2025-08-14 | 13F | Sei Investments Co | 99 116 | 13,97 | 1 066 | 11,04 | ||||
| 2025-08-14 | 13F | Group One Trading, L.p. | 30 968 | −16,30 | 333 | −18,38 | ||||
| 2025-08-13 | 13F/A | StoneX Group Inc. | 0 | −100,00 | 0 | −100,00 | ||||
| 2025-08-14 | 13F | Jane Street Group, Llc | 40 444 | 435 | ||||||
| 2025-08-14 | 13F | MIRAE ASSET GLOBAL ETFS HOLDINGS Ltd. | 1 024 749 | −1,31 | 11 026 | −3,90 | ||||
| 2025-06-27 | NP | ARGT - Global X MSCI Argentina ETF This fund is a listed as child fund of Mirae Asset Global Investments Co., Ltd. and if that institution has disclosed ownership in this security, then these positions will not be double counted when calculating total shares and total value | 1 031 753 | −6,16 | 11 339 | −19,68 | ||||
| 2025-08-07 | 13F | Hosking Partners LLP | 641 352 | −2,39 | 6 901 | −4,96 | ||||
| 2025-08-14 | 13F | Cubist Systematic Strategies, LLC | 40 265 | 33,52 | 433 | 30,03 | ||||
| 2025-08-14 | 13F | Ubs Asset Management Americas Inc | 130 000 | 0,00 | 1 399 | −2,65 | ||||
| 2025-08-14 | 13F | Group One Trading, L.p. | Call | 3 200 | 0,00 | 34 | −2,86 | |||
| 2025-07-09 | 13F | Systrade AG | 280 063 | 60,12 | 3 013 | 55,95 | ||||
| 2025-08-14 | 13F | Group One Trading, L.p. | Put | 29 300 | −50,84 | 315 | −52,13 | |||
| 2025-08-26 | NP | Delaware Vip Trust - Delaware Vip Emerging Markets Series Standard Class | 294 024 | 0,00 | 3 164 | −2,62 | ||||
| 2025-08-13 | 13F | Russell Investments Group, Ltd. | 83 514 | −22,17 | 899 | −24,22 | ||||
| 2025-08-04 | 13F | Deuterium Capital Management, LLC | 0 | −100,00 | 0 | |||||
| 2025-08-13 | 13F | Mirabella Financial Services Llp | 15 903 | −64,66 | 171 | −65,59 | ||||
| 2025-08-13 | 13F | Centiva Capital, LP | 0 | −100,00 | 0 | |||||
| 2025-08-14 | 13F | Two Sigma Investments, Lp | 50 210 | 540 | ||||||
| 2025-07-14 | 13F | Ridgewood Investments LLC | 5 100 | 0,00 | 55 | −3,57 | ||||
| 2025-08-14 | 13F | Bnp Paribas Arbitrage, Sa | 26 714 | −84,18 | 287 | −84,62 | ||||
| 2025-06-18 | NP | RAZAX - Multi-Asset Growth Strategy Fund Class A | 9 463 | 70,69 | 104 | 45,07 | ||||
| 2025-08-14 | 13F | Millennium Management Llc | 56 328 | 606 | ||||||
| 2025-08-14 | 13F | Federation des caisses Desjardins du Quebec | 1 032 | 0,00 | 11 | 0,00 | ||||
| 2025-08-12 | 13F | Jpmorgan Chase & Co | 4 091 | −7,25 | 44 | −8,33 | ||||
| 2025-08-14 | 13F/A | Barclays Plc | 3 866 | 0,00 | 0 | |||||
| 2025-07-25 | NP | DEMAX - Delaware Emerging Markets Fund Class A | 1 676 544 | 0,00 | 20 068 | 12,72 | ||||
| 2025-08-14 | 13F | Banque Transatlantique SA | 0 | −100,00 | 0 | |||||
| 2025-05-15 | 13F | Marshall Wace, Llp | 0 | −100,00 | 0 | −100,00 | ||||
| 2025-05-13 | 13F | Arbiter Partners Capital Management LLC | 0 | −100,00 | 0 | |||||
| 2025-08-12 | 13F | O'shaughnessy Asset Management, Llc | 28 311 | −3,61 | 305 | −6,17 | ||||
| 2025-08-05 | 13F | Meixler Investment Management, Ltd. | 53 647 | 9,04 | 577 | 6,26 | ||||
| 2025-08-05 | 13F | Gould Asset Management Llc /ca/ | 22 351 | −3,66 | 240 | −6,25 | ||||
| 2025-05-15 | 13F | Tower Research Capital LLC (TRC) | 0 | −100,00 | 0 | |||||
| 2025-08-14 | 13F | Glenorchy Capital Ltd | 342 366 | −2,17 | 3 684 | −4,76 | ||||
| 2025-08-14 | 13F | Macquarie Group Ltd | 2 218 377 | −0,15 | 23 870 | −2,77 | ||||
| 2025-08-14 | 13F | Susquehanna International Group, Llp | Call | 97 400 | 151,68 | 1 048 | 145,43 | |||
| 2025-08-14 | 13F | Susquehanna International Group, Llp | Put | 86 400 | 37,80 | 930 | 34,25 | |||
| 2025-08-14 | 13F | Kopernik Global Investors, LLC | 2 392 876 | 19,88 | 25 747 | 16,73 | ||||
| 2025-07-11 | 13F | Farther Finance Advisors, LLC | 62 | 0,00 | 1 | |||||
| 2025-08-08 | 13F | SBI Securities Co., Ltd. | 2 235 | 347,00 | 24 | 380,00 | ||||
| 2025-08-11 | 13F | Private Advisor Group, LLC | 10 006 | 108 | ||||||
| 2025-06-25 | NP | IEMGX - Voya Multi-Manager Emerging Markets Equity Fund Class I | 14 458 | −11,62 | 159 | −24,76 | ||||
| 2025-08-25 | NP | EITEX - Parametric Tax-Managed Emerging Markets Fund Institutional Class | 6 765 | 0,00 | 73 | −2,70 | ||||
| 2025-06-26 | NP | KGGAX - KOPERNIK GLOBAL ALL-CAP FUND CLASS A SHARES | 921 628 | 29,21 | 10 129 | 10,59 | ||||
| 2025-08-08 | 13F | Geode Capital Management, Llc | 33 965 | 0,41 | 365 | −2,14 | ||||
| 2025-08-14 | 13F | Bank Of America Corp /de/ | 8 192 | −7,51 | 88 | −9,28 | ||||
| 2025-05-09 | 13F | R Squared Ltd | 0 | −100,00 | 0 | |||||
| 2025-08-08 | 13F | Helikon Investments Ltd | 395 181 | 21,27 | 4 252 | 18,11 | ||||
| 2025-08-04 | 13F | Spire Wealth Management | 129 | 0,00 | 1 | 0,00 | ||||
| 2025-07-24 | 13F | Comprehensive Money Management Services LLC | 84 066 | 1,36 | 905 | −1,31 | ||||
| 2025-06-23 | NP | Global Macro Capital Opportunities Portfolio - Global Macro Capital Opportunities Portfolio | 47 824 | 2,14 | 526 | −12,65 | ||||
| 2025-08-14 | 13F | Highland Capital Management Fund Advisors, L.p. | 169 419 | 0,00 | 1 823 | −2,67 | ||||
| 2025-05-05 | 13F | Pictet Asset Management Holding SA | 0 | −100,00 | 0 | |||||
| 2025-08-01 | 13F | Y-Intercept (Hong Kong) Ltd | 11 524 | 124 | ||||||
| 2025-08-14 | 13F | UBS Group AG | 251 217 | −45,05 | 2 703 | −46,49 | ||||
| 2025-08-05 | 13F | Simplex Trading, Llc | Put | 36 600 | 4,57 | 0 | ||||
| 2025-08-05 | 13F | Simplex Trading, Llc | 18 303 | −3,31 | 0 | |||||
| 2025-06-27 | NP | EAEMX - Parametric Emerging Markets Fund Investor Class | 4 131 | 0,00 | 45 | −15,09 | ||||
| 2025-08-05 | 13F | Simplex Trading, Llc | Call | 17 300 | −11,28 | 0 | ||||
| 2025-08-26 | NP | MCTOX - Modern Capital Tactical Opportunities Fund Class A Shares | 173 365 | −3,84 | 1 865 | −6,38 | ||||
| 2025-08-14 | 13F | Susquehanna International Group, Llp | 0 | −100,00 | 0 | |||||
| 2025-08-11 | 13F | Citigroup Inc | 55 848 | −3,20 | 601 | −5,81 | ||||
| 2025-08-14 | 13F | 683 Capital Management, LLC | 889 000 | 7,11 | 9 566 | 4,30 | ||||
| 2025-07-28 | 13F | Ritholtz Wealth Management | 22 906 | −3,87 | 246 | −6,46 | ||||
| 2025-07-28 | 13F | Harbour Investments, Inc. | 1 289 | 0,00 | 14 | −7,14 | ||||
| 2025-08-12 | 13F | Proequities, Inc. | Put | 0 | 0 | |||||
| 2025-08-12 | 13F | Proequities, Inc. | Call | 0 | 0 | |||||
| 2025-07-14 | 13F | GAMMA Investing LLC | 6 904 | 13,40 | 74 | 10,45 | ||||
| 2025-08-12 | 13F | Proequities, Inc. | 0 | 0 | ||||||
| 2025-08-15 | 13F | Morgan Stanley | 148 330 | 10,91 | 1 596 | 8,06 | ||||
| 2025-08-14 | 13F | VR Advisory Services Ltd | 416 109 | 0,00 | 4 477 | −2,63 | ||||
| 2025-08-19 | 13F | National Asset Management, Inc. | 0 | −100,00 | 0 | |||||
| 2025-07-28 | 13F | Allianz Asset Management GmbH | 0 | −100,00 | 0 | |||||
| 2025-08-08 | 13F | Pnc Financial Services Group, Inc. | 5 | −66,67 | 0 | |||||
| 2025-08-27 | NP | TIFF INVESTMENT PROGRAM - TIFF Multi-Asset Fund | Short | −944 | 74,81 | −10 | 100,00 | |||
| 2025-08-19 | 13F | State of Wyoming | 0 | −100,00 | 0 | |||||
| 2025-05-15 | 13F | Manufacturers Life Insurance Company, The | 0 | −100,00 | 0 | |||||
| 2025-08-14 | 13F | Verition Fund Management LLC | 30 144 | 99,43 | 324 | 131,43 | ||||
| 2025-08-14 | 13F | Goldman Sachs Group Inc | 15 608 | 168 |
Other Listings
| US:CRESY | USD 8,52 |