27F0 - KALA BIO, Inc. Aksjer - aksjekurs, institusjonelt eierskap, aksjonærer (DB).

KALA BIO, Inc.
DE ˙ DB ˙ US4831192020
€ 14,74 ↑0,99 (7,20%)
2025-09-12
AKSJEKURSEN
Grunnleggende statistikk
Institusjonelle eiere 35 total, 35 long only, 0 short only, 0 long/short - change of 0,00% MRQ
Aksjekurs 14,74
Gjennomsnittlig porteføljeallokering 0.0434 % - change of −32,66% MRQ
Utestående aksjer shares (source: Capital IQ)
Institusjonelle aksjer (Long) 3 688 664 - 52,54% (ex 13D/G) - change of −0,21MM shares −5,37% MRQ
Institusjonell verdi (Long) $ 17 489 USD ($1000)
Institusjonelt eierskap og aksjonærer

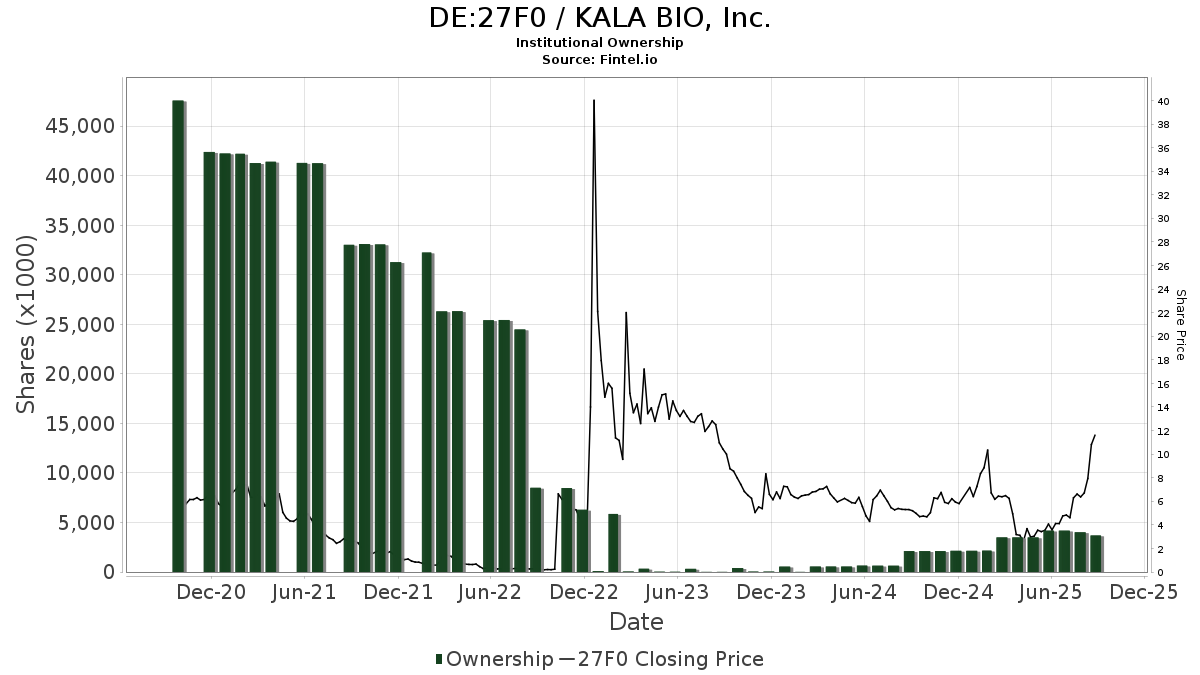
KALA BIO, Inc. (DE:27F0) har 35 institusjonelle eiere og aksjonærer som har sendt inn 13D/G- eller 13F-skjemaer til Securities Exchange Commission (SEC). Disse institusjonene eier til sammen 3,688,664 aksjer. De største aksjonærene inkluderer Baker Bros. Advisors Lp, Cormorant Asset Management, LP, Sr One Capital Management, Lp, Woodline Partners LP, AIGH Capital Management LLC, Vanguard Group Inc, ADAR1 Capital Management, LLC, Ubs Oconnor Llc, VTSMX - Vanguard Total Stock Market Index Fund Investor Shares, and Geode Capital Management, Llc .

KALA BIO, Inc. (DB:27F0) institusjonell eierstruktur viser nåværende posisjoner i selskapet fordelt på institusjoner og fond, samt de siste endringene i posisjonsstørrelse. De største aksjonærene kan være individuelle investorer, verdipapirfond, hedgefond eller institusjoner. Schedule 13D indikerer at investoren eier (eller har eid) mer enn 5 % av selskapet og har til hensikt (eller hadde til hensikt) å aktivt forfølge en endring i forretningsstrategien. Schedule 13G indikerer en passiv investering på over 5 %.

The share price as of September 12, 2025 is 14,74 / share. Previously, on September 13, 2024, the share price was 5,43 / share. This represents an increase of 171,45% over that period.

DE:27F0 / KALA BIO, Inc. Institutional Ownership
Fondssentiment-score

Fondssentiment Score (også kjent som akkumulering av eierskap poengsum) viser hvilke aksjer som er mest kjøpt av fond. Den er resultatet av en sofistikert, kvantitativ flerfaktormodell som identifiserer selskaper med de høyeste nivåene av institusjonell akkumulering. Beregningsmodellen for poeng bruker en kombinasjon av den totale økningen i antall offentliggjorte eiere, endringer i porteføljeallokeringen til disse eierne og andre beregninger. Tallet går fra 0 til 100, der høyere tall indikerer en høyere grad av akkumulering i forhold til sammenlignbare selskaper, der 50 er gjennomsnittet.

Oppdateringsfrekvens: Daglig

Sjekk ut Ownership Explorer, som inneholder en liste over de høyest rangerte selskapene.

13F- og NPORT-arkiveringer

Detaljer om 13F-arkiveringer er gratis. Detaljer om NP-arkiveringer krever et premium-medlemskap. Grønne rader indikerer nye posisjoner. Røde rader indikerer lukkede posisjoner. Klikk på lenke ikonet for å se hele transaksjonshistorikken.

Oppgrader for å låse opp premiedata og eksportere til Excel. .

Fildato Kilde Investor Type Gjennomsnittlig pris
(estimert)
Aksjer Δ Aksjer
(%)
Rapportert verdi ($1000) Verdi (%) Portallokering (%)
2025-08-13 13F Renaissance Technologies Llc 17 400 83
2025-08-14 13F Woodline Partners LP 300 149 15,99 1 429 −3,64
2025-05-14 13F Group One Trading, L.p. 0 −100,00 0
2025-08-11 13F Vanguard Group Inc 170 375 11,52 811 −7,43
2025-05-15 13F/A Clear Street Llc 0 −100,00 0 −100,00
2025-09-04 13F/A Advisor Group Holdings, Inc. 100 0
2025-04-16 13F Compagnie Lombard Odier SCmA 0 −100,00 0 −100,00
2025-05-15 13F Two Sigma Investments, Lp 0 −100,00 0
2025-05-15 13F Royal Bank Of Canada 0 −100,00 0
2025-08-06 13F Legacy Wealth Managment, LLC/ID 25 0,00 0
2025-07-29 13F AIGH Capital Management LLC 300 000 52,79 1 428 26,93
2025-08-27 NP VTSMX - Vanguard Total Stock Market Index Fund Investor Shares This fund is a listed as child fund of Vanguard Group Inc and if that institution has disclosed ownership in this security, then these positions will not be double counted when calculating total shares and total value 115 442 0,00 550 −16,94
2025-08-14 13F Cormorant Asset Management, LP 603 027 0,00 2 870 −16,93
2025-08-14 13F Baker Bros. Advisors Lp 1 201 894 0,00 5 721 −16,92
2025-08-06 13F Legacy Investment Solutions, LLC 25 150,00 0
2025-08-12 13F Proequities, Inc. 0 0
2025-07-31 13F Curio Wealth, Llc 0 −100,00 0
2025-08-07 13F Readystate Asset Management Lp 0 −100,00 0
2025-08-12 13F Jpmorgan Chase & Co 237 295,00 1
2025-05-15 13F Millennium Management Llc 0 −100,00 0 −100,00
2025-05-12 13F Citigroup Inc 0 −100,00 0 −100,00
2025-08-27 NP VEXMX - Vanguard Extended Market Index Fund Investor Shares This fund is a listed as child fund of Vanguard Group Inc and if that institution has disclosed ownership in this security, then these positions will not be double counted when calculating total shares and total value 54 101 48,22 258 22,97
2025-08-13 13F Northern Trust Corp 10 399 0,00 49 −16,95
2025-08-12 13F XTX Topco Ltd 12 990 62
2025-08-14 13F Raymond James Financial Inc 7 0
2025-08-14 13F Sr One Capital Management, Lp 598 940 0,00 2 851 −16,93
2025-07-29 NP Guggenheim Active Allocation Fund 6 0,00 0
2025-08-15 13F Morgan Stanley 972 0,00 5 −20,00
2025-07-24 NP FSMAX - Fidelity Extended Market Index Fund This fund is a listed as child fund of Fmr Llc and if that institution has disclosed ownership in this security, then these positions will not be double counted when calculating total shares and total value 28 178 40,27 105 −25,18
2025-05-15 13F Board of Trustees of The Leland Stanford Junior University 0 −100,00 0 −100,00
2025-08-08 13F Geode Capital Management, Llc 56 367 2,80 268 −14,65
2025-08-14 13F UBS Group AG 34 −99,00 0 −100,00
2025-08-12 13F Steward Partners Investment Advisory, Llc 120 0,00 1
2025-08-14 13F Bank Of America Corp /de/ 98 100,00 0
2025-08-08 13F SBI Securities Co., Ltd. 8 0,00 0
2025-08-14 13F Perceptive Advisors Llc 55 227 −80,11 263 −83,52
2025-07-24 NP FSKAX - Fidelity Total Market Index Fund This fund is a listed as child fund of Fmr Llc and if that institution has disclosed ownership in this security, then these positions will not be double counted when calculating total shares and total value 11 901 42,90 44 −22,81
2025-07-24 NP FNCMX - Fidelity Nasdaq Composite Index Fund This fund is a listed as child fund of Fmr Llc and if that institution has disclosed ownership in this security, then these positions will not be double counted when calculating total shares and total value 692 −53,31 3 −80,00
2025-08-11 13F Covestor Ltd 1 138 −0,18 0
2025-08-12 13F MAI Capital Management 300 0,00 1 0,00
2025-08-12 13F BlackRock, Inc. 21 356 0,00 102 −17,21
2025-08-15 13F Tower Research Capital LLC (TRC) 1 143 417,19 5 400,00
2025-08-14 13F ADAR1 Capital Management, LLC 149 830 −49,88 713 −58,38
2025-07-24 NP FCFMX - Fidelity Series Total Market Index Fund This fund is a listed as child fund of Fmr Llc and if that institution has disclosed ownership in this security, then these positions will not be double counted when calculating total shares and total value 7 072 41,52 26 −23,53
2025-08-14 13F Silverarc Capital Management, Llc 0 −100,00 0
2025-08-15 13F Binnacle Investments Inc 0 −100,00 0
2025-08-14 13F Bnp Paribas Arbitrage, Sa 98 0,00 0
2025-05-01 13F Cwm, Llc 0 −100,00 0
2025-08-14 13F Ubs Oconnor Llc 138 556 −18,93 660 −32,69
Other Listings
GB:0JQ2
US:KALA USD 18,65
Fintel data has been cited in the following publications:
Daily Mail Fox Business Business Insider Wall Street Journal The Washington Post Bloomberg Financial Times Globe and Mail
NASDAQ.com Reuters The Guardian Associated Press FactCheck.org Snopes Politifact
Federal Register The Intercept Forbes Fortune Magazine TheStreet Time Magazine Canadian Broadcasting Corporation International Business Times
Cambridge University Press Investopedia MarketWatch NY Daily News Entrepreneur Newsweek Barron's El Economista