Grunnleggende statistikk
| Institusjonelle aksjer (Long) | 2 172 596 - 0,75% (ex 13D/G) - change of 0,19MM shares 9,79% MRQ |
| Institusjonell verdi (Long) | $ 19 691 USD ($1000) |
Institusjonelt eierskap og aksjonærer
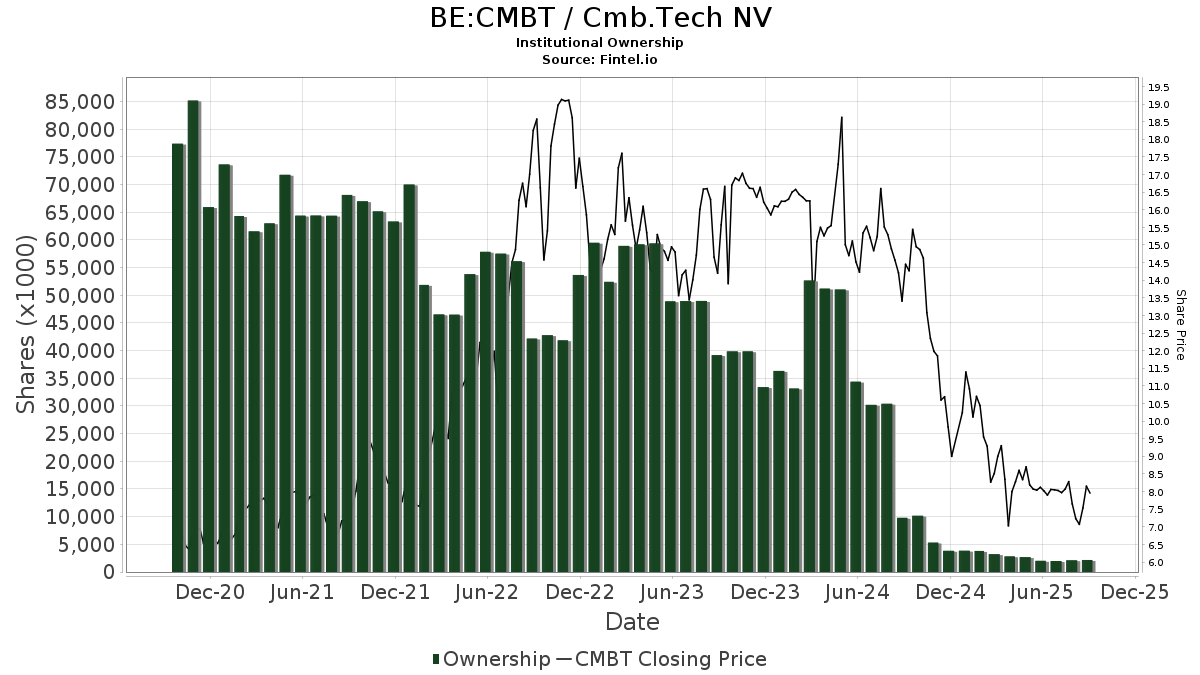
Cmb.Tech NV (BE:CMBT) har 55 institusjonelle eiere og aksjonærer som har sendt inn 13D/G- eller 13F-skjemaer til Securities Exchange Commission (SEC). Disse institusjonene eier til sammen 2,172,596 aksjer. De største aksjonærene inkluderer Uniplan Investment Counsel, Inc., Norges Bank, UBS Group AG, Susquehanna International Group, Llp, DFAI - Dimensional International Core Equity Market ETF, Vanguard Group Inc, Mariner, LLC, DRISX - Foundry Partners Fundamental Small Cap Value Fund Institutional Class, DFAX - Dimensional World ex U.S. Core Equity 2 ETF, and DFIC - Dimensional International Core Equity 2 ETF .
Cmb.Tech NV (ENXTBR:CMBT) institusjonell eierstruktur viser nåværende posisjoner i selskapet fordelt på institusjoner og fond, samt de siste endringene i posisjonsstørrelse. De største aksjonærene kan være individuelle investorer, verdipapirfond, hedgefond eller institusjoner. Schedule 13D indikerer at investoren eier (eller har eid) mer enn 5 % av selskapet og har til hensikt (eller hadde til hensikt) å aktivt forfølge en endring i forretningsstrategien. Schedule 13G indikerer en passiv investering på over 5 %.
The share price as of September 9, 2025 is 8,48 / share. Previously, on September 10, 2024, the share price was 13,53 / share. This represents a decline of 37,32% over that period.
Fondssentiment-score
Fondssentiment Score (også kjent som akkumulering av eierskap poengsum) viser hvilke aksjer som er mest kjøpt av fond. Den er resultatet av en sofistikert, kvantitativ flerfaktormodell som identifiserer selskaper med de høyeste nivåene av institusjonell akkumulering. Beregningsmodellen for poeng bruker en kombinasjon av den totale økningen i antall offentliggjorte eiere, endringer i porteføljeallokeringen til disse eierne og andre beregninger. Tallet går fra 0 til 100, der høyere tall indikerer en høyere grad av akkumulering i forhold til sammenlignbare selskaper, der 50 er gjennomsnittet.
Oppdateringsfrekvens: Daglig
Sjekk ut Ownership Explorer, som inneholder en liste over de høyest rangerte selskapene.
13F- og NPORT-arkiveringer
Detaljer om 13F-arkiveringer er gratis. Detaljer om NP-arkiveringer krever et premium-medlemskap. Grønne rader indikerer nye posisjoner. Røde rader indikerer lukkede posisjoner. Klikk på lenke ikonet for å se hele transaksjonshistorikken.
Oppgrader
for å låse opp premiedata og eksportere til Excel. ![]() .
.
| Fildato | Kilde | Investor | Type | Gjennomsnittlig pris (estimert) |
Aksjer | Δ Aksjer (%) |
Rapportert verdi ($1000) | Verdi (%) | Portallokering (%) | |
|---|---|---|---|---|---|---|---|---|---|---|
| 2025-08-12 | 13F | XTX Topco Ltd | 0 | −100,00 | 0 | |||||
| 2025-06-26 | NP | DFIS - Dimensional International Small Cap ETF | 41 222 | −32,45 | 392 | −40,43 | ||||
| 2025-07-24 | 13F | Us Bancorp \de\ | 0 | −100,00 | 0 | |||||
| 2025-06-26 | NP | DFAI - Dimensional International Core Equity Market ETF | 135 357 | −8,14 | 1 287 | −19,01 | ||||
| 2025-08-13 | 13F | Norges Bank | 312 596 | 2 847 | ||||||
| 2025-08-14 | 13F | Group One Trading, L.p. | 38 593 | 60,61 | 348 | 59,63 | ||||
| 2025-07-24 | 13F/A | Mraz, Amerine & Associates, Inc. | 0 | −100,00 | 0 | −100,00 | ||||
| 2025-08-14 | 13F | RBF Capital, LLC | 15 955 | 0,00 | 144 | −0,69 | ||||
| 2025-03-31 | NP | DRISX - Foundry Partners Fundamental Small Cap Value Fund Institutional Class | 108 869 | −57,49 | 1 175 | −67,04 | ||||
| 2025-06-26 | NP | DFAX - Dimensional World ex U.S. Core Equity 2 ETF | 91 996 | 0,00 | 875 | −11,90 | ||||
| 2025-07-24 | 13F | Lester Murray Antman dba SimplyRich | 34 206 | −0,61 | 0 | |||||
| 2025-06-30 | NP | PDN - Invesco FTSE RAFI Developed Markets ex-U.S. Small-Mid ETF This fund is a listed as child fund of Invesco Ltd. and if that institution has disclosed ownership in this security, then these positions will not be double counted when calculating total shares and total value | 0 | −100,00 | 0 | −100,00 | ||||
| 2025-08-14 | 13F | Wells Fargo & Company/mn | 590 | −17,13 | 5 | −16,67 | ||||
| 2025-05-12 | 13F | Townsquare Capital Llc | 0 | −100,00 | 0 | −100,00 | ||||
| 2025-08-14 | 13F | Css Llc/il | 0 | −100,00 | 0 | |||||
| 2025-08-14 | 13F | Qube Research & Technologies Ltd | 0 | −100,00 | 0 | −100,00 | ||||
| 2025-08-14 | 13F | Css Llc/il | Put | 0 | −100,00 | 0 | ||||
| 2025-08-11 | 13F | Vanguard Group Inc | 135 033 | 1 232 | ||||||
| 2025-08-12 | 13F | MAI Capital Management | 90 | 0,00 | 1 | |||||
| 2025-08-14 | 13F | Ubs Asset Management Americas Inc | 5 788 | 4 187,41 | 52 | 5 100,00 | ||||
| 2025-08-14 | 13F | Vident Advisory, LLC | 44 961 | −35,62 | 406 | −36,12 | ||||
| 2025-04-23 | 13F | Chapin Davis, Inc. | 0 | −100,00 | 0 | −100,00 | ||||
| 2025-06-26 | NP | DFIC - Dimensional International Core Equity 2 ETF | 70 999 | 0,00 | 675 | −11,88 | ||||
| 2025-05-05 | 13F | Foundry Partners, LLC | 0 | −100,00 | 0 | −100,00 | ||||
| 2025-08-14 | 13F | Headlands Technologies LLC | 1 448 | 34,57 | 13 | 44,44 | ||||
| 2025-08-27 | NP | ALLIANZ VARIABLE INSURANCE PRODUCTS TRUST - AZL DFA International Core Equity Fund | 1 031 | 0,00 | 9 | 0,00 | ||||
| 2025-09-04 | 13F/A | Advisor Group Holdings, Inc. | 2 864 | 39,98 | 26 | 38,89 | ||||
| 2025-05-14 | 13F | Credit Agricole S A | 456 | 0,00 | 4 | 0,00 | ||||
| 2025-07-17 | 13F | Sound Income Strategies, LLC | 997 | 0,00 | 9 | −11,11 | ||||
| 2025-08-08 | 13F | Itau Unibanco Holding S.A. | 0 | −100,00 | 0 | |||||
| 2025-08-27 | 13F/A | Brinker Capital Investments, LLC | 10 899 | 98 | ||||||
| 2025-05-05 | 13F | IFP Advisors, Inc | 0 | −100,00 | 0 | |||||
| 2025-08-14 | 13F | FourWorld Capital Management LLC | 0 | −100,00 | 0 | −100,00 | ||||
| 2025-08-12 | 13F | Proequities, Inc. | 0 | 0 | ||||||
| 2025-05-14 | 13F | State of Wyoming | 0 | −100,00 | 0 | |||||
| 2025-08-04 | 13F | Mesirow Financial Investment Management, Inc. | 11 336 | −17,08 | 102 | −17,74 | ||||
| 2025-08-14 | 13F | Bank Of America Corp /de/ | 20 767 | −62,03 | 187 | −62,30 | ||||
| 2025-07-28 | 13F | BRYN MAWR TRUST Co | 168 | 0,00 | 2 | 0,00 | ||||
| 2025-08-14 | 13F | Royal Bank Of Canada | 3 945 | 9,58 | 36 | 9,09 | ||||
| 2025-06-26 | NP | DISV - Dimensional International Small Cap Value ETF | 29 234 | 0,00 | 278 | −11,75 | ||||
| 2025-08-01 | 13F | Envestnet Asset Management Inc | 65 624 | −9,22 | 592 | −9,91 | ||||
| 2025-08-13 | 13F | Barclays Plc | 0 | −100,00 | 0 | |||||
| 2025-08-18 | 13F/A | National Bank Of Canada /fi/ | 700 | 0,00 | 6 | 0,00 | ||||
| 2025-08-12 | 13F | Jpmorgan Chase & Co | 30 752 | 3 978,51 | 277 | 4 516,67 | ||||
| 2025-08-14 | 13F | Goldman Sachs Group Inc | 69 911 | −71,81 | 631 | −72,01 | ||||
| 2025-08-14 | 13F | Susquehanna International Group, Llp | Call | 176 900 | 1 596 | |||||
| 2025-05-14 | 13F | Northwestern Mutual Wealth Management Co | 0 | −100,00 | 0 | |||||
| 2025-05-14 | 13F | JustInvest LLC | 0 | −100,00 | 0 | |||||
| 2025-05-15 | 13F | Citadel Advisors Llc | Put | 0 | −100,00 | 0 | −100,00 | |||
| 2025-07-31 | 13F | City State Bank | 100 | 0,00 | 1 | |||||
| 2025-08-13 | 13F | EverSource Wealth Advisors, LLC | 1 889 | −40,11 | 17 | −39,29 | ||||
| 2025-07-24 | 13F | Ronald Blue Trust, Inc. | 5 059 | −21,75 | 46 | −22,41 | ||||
| 2025-08-08 | 13F | Larson Financial Group LLC | 260 | 2 | ||||||
| 2025-08-12 | 13F | Steward Partners Investment Advisory, Llc | 5 873 | 8,86 | 53 | 8,33 | ||||
| 2025-07-24 | 13F | Ramirez Asset Management, Inc. | 0 | −100,00 | 0 | |||||
| 2025-08-14 | 13F | Citadel Advisors Llc | 37 577 | 339 | ||||||
| 2025-08-14 | 13F | Uniplan Investment Counsel, Inc. | 372 643 | −10,00 | 3 361 | −10,59 | ||||
| 2025-04-08 | 13F | Pacifica Partners Inc. | 0 | −100,00 | 0 | |||||
| 2025-07-15 | 13F | Fifth Third Bancorp | 9 760 | 0,05 | 88 | 0,00 | ||||
| 2025-08-01 | 13F | Rossby Financial, LCC | 290 | 0,00 | 3 | 0,00 | ||||
| 2025-08-14 | 13F | UBS Group AG | 247 715 | −11,16 | 2 234 | −11,73 | ||||
| 2025-05-15 | 13F | Millennium Management Llc | 0 | −100,00 | 0 | −100,00 | ||||
| 2025-06-30 | 13F/A | Deutsche Bank Ag\ | 0 | −100,00 | 0 | |||||
| 2025-08-14 | 13F | Citadel Advisors Llc | Call | 14 000 | 126 | |||||
| 2025-08-08 | 13F | SBI Securities Co., Ltd. | 7 158 | 3,23 | 65 | 3,23 | ||||
| 2025-08-11 | 13F | Citigroup Inc | 2 395 | 22 | ||||||
| 2025-08-14 | 13F | Css Llc/il | Call | 0 | −100,00 | 0 | ||||
| 2025-08-14 | 13F | Mariner, LLC | 113 496 | 138,86 | 1 024 | 137,35 | ||||
| 2025-08-12 | 13F | Legal & General Group Plc | 6 529 | 221,31 | 59 | 227,78 | ||||
| 2025-08-15 | 13F | Tower Research Capital LLC (TRC) | 426 | 14 100,00 | 4 | |||||
| 2025-08-14 | 13F | Raymond James Financial Inc | 2 953 | 27 | ||||||
| 2025-08-15 | 13F | Morgan Stanley | 11 902 | −82,25 | 107 | −82,40 | ||||
| 2025-08-14 | 13F | Boston Private Wealth Llc | 0 | −100,00 | 0 | |||||
| 2025-08-04 | 13F | Wolverine Asset Management Llc | 900 | 8 | ||||||
| 2025-07-15 | 13F | Td Private Client Wealth Llc | 250 | 0,00 | 2 | 0,00 | ||||
| 2025-08-07 | 13F | Mitsubishi UFJ Kokusai Asset Management Co., Ltd. | 0 | −100,00 | 0 | |||||
| 2025-08-11 | 13F | Hexagon Capital Partners LLC | 0 | −100,00 | 0 | |||||
| 2025-08-11 | 13F | TD Waterhouse Canada Inc. | 152 | 0,00 | 1 | 0,00 | ||||
| 2025-08-13 | 13F | Jones Financial Companies Lllp | 55 | 0,00 | 1 | |||||
| 2025-07-22 | 13F | Highland Capital Management, Llc | 42 100 | −2,77 | 380 | −3,56 | ||||
| 2025-08-12 | 13F | Coldstream Capital Management Inc | 0 | −100,00 | 0 | |||||
| 2025-08-12 | 13F | BlackRock, Inc. | 2 846 | 314,26 | 26 | 316,67 | ||||
| 2025-07-18 | 13F/A | MJT & Associates Financial Advisory Group, Inc. | 100 | 0,00 | 1 | |||||
| 2025-05-14 | 13F | Orion Portfolio Solutions, LLC | 13 781 | 0,00 | 137 | 0,00 | ||||
| 2025-05-13 | 13F | Caitong International Asset Management Co., Ltd | 0 | −100,00 | 0 |