MWG - Mobile World Investment Corporation Aksjer - aksjekurs, institusjonelt eierskap, aksjonærer (HOSE).

Mobile World Investment Corporation
VN ˙ HOSE ˙ VN000000MWG0
Grunnleggende statistikk
Institusjonelle eiere 24 total, 24 long only, 0 short only, 0 long/short - change of 14,29% MRQ
Gjennomsnittlig porteføljeallokering 1.0993 % - change of −11,97% MRQ
Utestående aksjer shares (source: Capital IQ)
Institusjonelle aksjer (Long) 35 442 302 - 2,40% (ex 13D/G) - change of −0,75MM shares −2,07% MRQ
Institusjonell verdi (Long) $ 86 571 USD ($1000)
Institusjonelt eierskap og aksjonærer

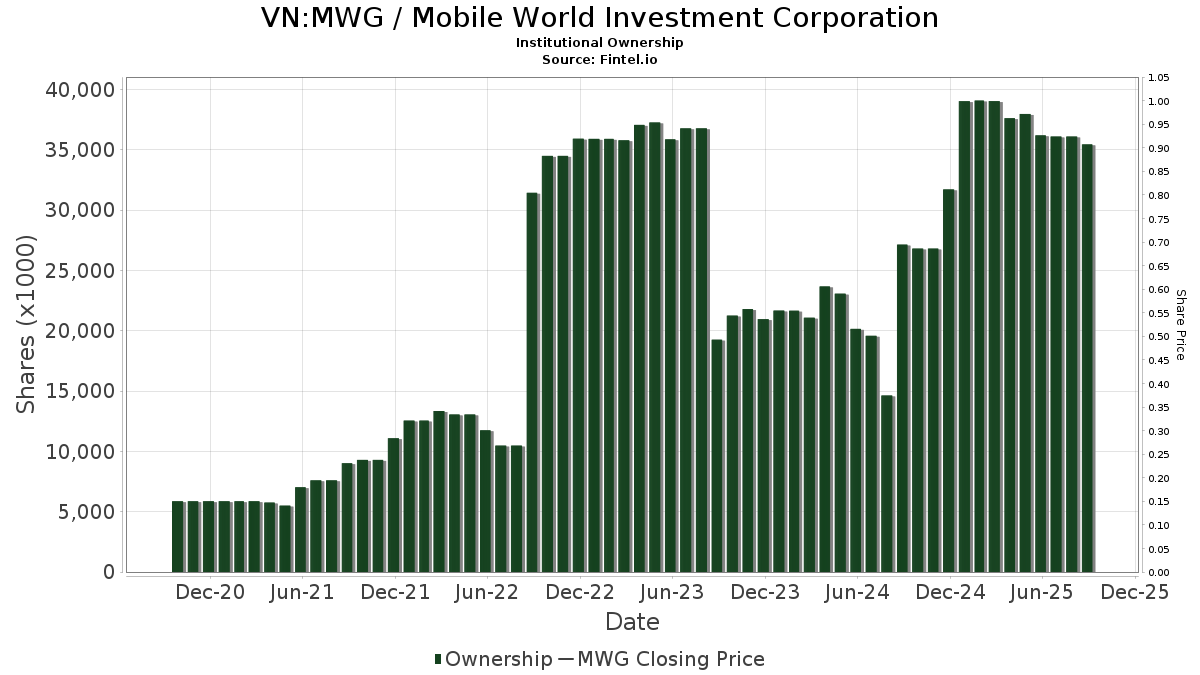
Mobile World Investment Corporation (VN:MWG) har 24 institusjonelle eiere og aksjonærer som har sendt inn 13D/G- eller 13F-skjemaer til Securities Exchange Commission (SEC). Disse institusjonene eier til sammen 35,442,302 aksjer. De største aksjonærene inkluderer BGEHX - Baillie Gifford Emerging Markets Equities Fund Class 2, TEMMX - Templeton Emerging Markets Small Cap Fund Class A, HLEMX - Harding Loevner Emerging Markets Portfolio Advisor, Global Macro Capital Opportunities Portfolio - Global Macro Capital Opportunities Portfolio, HLMEX - Harding Loevner Institutional Emerging Markets Portfolio Institutional, MSMLX - MATTHEWS ASIA SMALL COMPANIES FUND Investor Class Shares, Global Macro Absolute Return Advantage Portfolio - Global Macro Absolute Return Advantage Portfolio, HLFMX - Harding Loevner Frontier Emerging Markets Portfolio Institutional Class I, VMMSX - Vanguard Emerging Markets Select Stock Fund Investor Shares, and Global Macro Portfolio - Global Macro Portfolio .

Mobile World Investment Corporation (HOSE:MWG) institusjonell eierstruktur viser nåværende posisjoner i selskapet fordelt på institusjoner og fond, samt de siste endringene i posisjonsstørrelse. De største aksjonærene kan være individuelle investorer, verdipapirfond, hedgefond eller institusjoner. Schedule 13D indikerer at investoren eier (eller har eid) mer enn 5 % av selskapet og har til hensikt (eller hadde til hensikt) å aktivt forfølge en endring i forretningsstrategien. Schedule 13G indikerer en passiv investering på over 5 %.

VN:MWG / Mobile World Investment Corporation Institutional Ownership
Fondssentiment-score

Fondssentiment Score (også kjent som akkumulering av eierskap poengsum) viser hvilke aksjer som er mest kjøpt av fond. Den er resultatet av en sofistikert, kvantitativ flerfaktormodell som identifiserer selskaper med de høyeste nivåene av institusjonell akkumulering. Beregningsmodellen for poeng bruker en kombinasjon av den totale økningen i antall offentliggjorte eiere, endringer i porteføljeallokeringen til disse eierne og andre beregninger. Tallet går fra 0 til 100, der høyere tall indikerer en høyere grad av akkumulering i forhold til sammenlignbare selskaper, der 50 er gjennomsnittet.

Oppdateringsfrekvens: Daglig

Sjekk ut Ownership Explorer, som inneholder en liste over de høyest rangerte selskapene.

13F- og NPORT-arkiveringer

Detaljer om 13F-arkiveringer er gratis. Detaljer om NP-arkiveringer krever et premium-medlemskap. Grønne rader indikerer nye posisjoner. Røde rader indikerer lukkede posisjoner. Klikk på lenke ikonet for å se hele transaksjonshistorikken.

Oppgrader for å låse opp premiedata og eksportere til Excel. .

Fildato Kilde Investor Type Gjennomsnittlig pris
(estimert)
Aksjer Δ Aksjer
(%)
Rapportert verdi ($1000) Verdi (%) Portallokering (%)
2025-08-25 NP MSMLX - MATTHEWS ASIA SMALL COMPANIES FUND Investor Class Shares 2 353 714 −26,75 5 908 −20,43
2025-06-30 NP VMMSX - Vanguard Emerging Markets Select Stock Fund Investor Shares This fund is a listed as child fund of Vanguard Group Inc and if that institution has disclosed ownership in this security, then these positions will not be double counted when calculating total shares and total value 810 000 −3,94 1 906 −5,13
2025-08-26 NP POLCX - Polar Capital Emerging Market Ex-China Stars Fund 6 878 0,00 17 13,33
2025-08-27 NP PCEM - Polen Capital Emerging Markets ex-China Growth ETF 27 900 0,00 70 7,81
2025-08-26 NP POLEX - Polar Capital Emerging Market Stars Fund Institutional Class Shares 697 375 3,11 1 750 12,04
2025-06-26 NP EFEAX - Ashmore Emerging Markets Frontier Equity Fund Class A 457 700 −34,00 1 073 −35,21
2025-08-25 NP MEMS - Matthews Emerging Markets Discovery Active ETF 74 700 48,51 187 61,21
2025-06-26 NP HLFMX - Harding Loevner Frontier Emerging Markets Portfolio Institutional Class I 999 900 −3,56 2 345 −5,37
2025-08-26 NP BGEHX - Baillie Gifford Emerging Markets Equities Fund Class 2 15 165 600 −3,98 38 065 4,30
2025-06-23 NP Global Macro Capital Opportunities Portfolio - Global Macro Capital Opportunities Portfolio 2 681 100 31,32 6 309 29,74
2025-07-29 13F Stanley-Laman Group, Ltd. 600 000 0,00 1 505 8,59
2025-06-25 NP RPGAX - T. Rowe Price Global Allocation Fund, Inc. This fund is a listed as child fund of Price T Rowe Associates Inc /md/ and if that institution has disclosed ownership in this security, then these positions will not be double counted when calculating total shares and total value 64 600 34,30 152 33,33
2025-08-22 NP MFMIX - Frontier Markets Portfolio Class I 253 488 0,00 636 8,72
2025-06-26 NP HLEMX - Harding Loevner Emerging Markets Portfolio Advisor 2 751 500 −3,65 6 452 −5,44
2025-06-25 NP PGEIX - Polen Global Emerging Markets Growth Fund Institutional Class 113 700 −15,96 268 −17,08
2025-08-27 NP IEMSX - ABS Insights Emerging Markets Fund Super Institutional Class Shares 109 600 275
2025-08-21 NP MEMSX - Mercer Emerging Markets Equity Fund Class I 522 000 1 310
2025-08-26 NP BGEZX - Baillie Gifford Emerging Markets ex China Fund Class K 2 400 0,00 6 20,00
2025-08-25 NP MEMX - Matthews Emerging Markets ex China Active ETF 137 700 12,50 345 1,77
2025-07-25 NP TEMMX - Templeton Emerging Markets Small Cap Fund Class A 3 248 849 0,00 7 739 4,05
2025-06-23 NP Global Macro Absolute Return Advantage Portfolio - Global Macro Absolute Return Advantage Portfolio 1 146 200 40,04 2 697 38,38
2025-08-26 NP BCHI - GMO Beyond China ETF 107 300 24,91 269 35,86
2025-06-26 NP HLMEX - Harding Loevner Institutional Emerging Markets Portfolio Institutional 2 406 500 −21,28 5 643 −22,73
2025-06-23 NP Global Macro Portfolio - Global Macro Portfolio 703 598 0,00 1 656 −1,19
Fintel data has been cited in the following publications:
Daily Mail Fox Business Business Insider Wall Street Journal The Washington Post Bloomberg Financial Times Globe and Mail
NASDAQ.com Reuters The Guardian Associated Press FactCheck.org Snopes Politifact
Federal Register The Intercept Forbes Fortune Magazine TheStreet Time Magazine Canadian Broadcasting Corporation International Business Times
Cambridge University Press Investopedia MarketWatch NY Daily News Entrepreneur Newsweek Barron's El Economista