TPCS - TechPrecision Corporation Aksjer - aksjekurs, institusjonelt eierskap, aksjonærer (NasdaqCM).

TechPrecision Corporation
US ˙ NasdaqCM ˙ US8787392005

Grunnleggende statistikk
Institusjonelle eiere 35 total, 35 long only, 0 short only, 0 long/short - change of 12,90% MRQ
Gjennomsnittlig porteføljeallokering 0.0488 % - change of 13,67% MRQ
Utestående aksjer shares (source: Capital IQ)
Institusjonelle aksjer (Long) 1 613 227 - 16,21% (ex 13D/G) - change of 0,09MM shares 5,65% MRQ
Institusjonell verdi (Long) $ 5 967 USD ($1000)
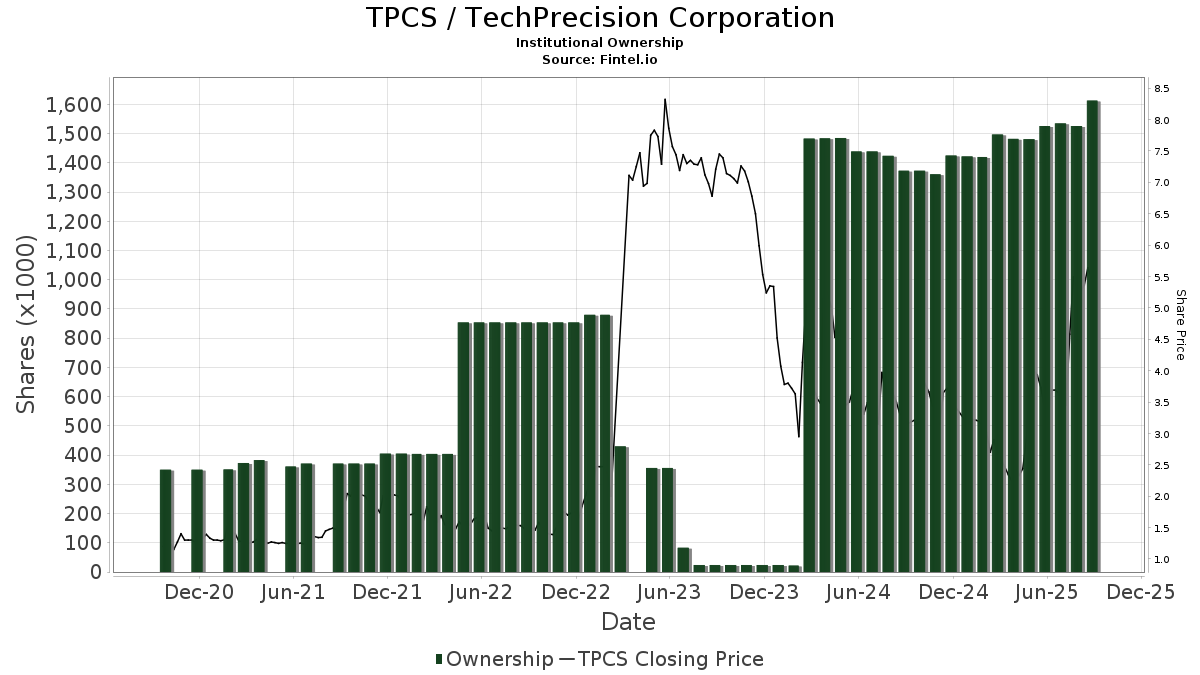
Institusjonelt eierskap og aksjonærer

TechPrecision Corporation (US:TPCS) har 35 institusjonelle eiere og aksjonærer som har sendt inn 13D/G- eller 13F-skjemaer til Securities Exchange Commission (SEC). Disse institusjonene eier til sammen 1,613,227 aksjer. De største aksjonærene inkluderer Wynnefield Capital Inc, ARS Investment Partners, LLC, Vanguard Group Inc, VTSMX - Vanguard Total Stock Market Index Fund Investor Shares, VEXMX - Vanguard Extended Market Index Fund Investor Shares, Geode Capital Management, Llc, Perritt Capital Management Inc, Commons Capital, Llc, PRCGX - Perritt MicroCap Opportunities Fund Investor Class, and FSMAX - Fidelity Extended Market Index Fund .

TechPrecision Corporation (NasdaqCM:TPCS) institusjonell eierstruktur viser nåværende posisjoner i selskapet fordelt på institusjoner og fond, samt de siste endringene i posisjonsstørrelse. De største aksjonærene kan være individuelle investorer, verdipapirfond, hedgefond eller institusjoner. Schedule 13D indikerer at investoren eier (eller har eid) mer enn 5 % av selskapet og har til hensikt (eller hadde til hensikt) å aktivt forfølge en endring i forretningsstrategien. Schedule 13G indikerer en passiv investering på over 5 %.

The share price as of September 9, 2025 is 5,42 / share. Previously, on September 10, 2024, the share price was 3,25 / share. This represents an increase of 66,77% over that period.

TPCS / TechPrecision Corporation Institutional Ownership
Fondssentiment-score

Fondssentiment Score (også kjent som akkumulering av eierskap poengsum) viser hvilke aksjer som er mest kjøpt av fond. Den er resultatet av en sofistikert, kvantitativ flerfaktormodell som identifiserer selskaper med de høyeste nivåene av institusjonell akkumulering. Beregningsmodellen for poeng bruker en kombinasjon av den totale økningen i antall offentliggjorte eiere, endringer i porteføljeallokeringen til disse eierne og andre beregninger. Tallet går fra 0 til 100, der høyere tall indikerer en høyere grad av akkumulering i forhold til sammenlignbare selskaper, der 50 er gjennomsnittet.

Oppdateringsfrekvens: Daglig

Sjekk ut Ownership Explorer, som inneholder en liste over de høyest rangerte selskapene.

Institusjonell Put/Call-forhold

I tillegg til å rapportere standard aksje- og gjeldsemisjoner må institusjoner med mer enn 100 millioner kroner i forvaltningskapital også oppgi beholdningen av put- og callopsjoner. Siden put-opsjoner generelt indikerer et negativt sentiment, og call-opsjoner indikerer et positivt sentiment, kan vi få et inntrykk av det generelle institusjonelle sentimentet ved å plotte forholdet mellom put- og call-opsjoner. Diagrammet til høyre viser det historiske forholdet mellom put- og call-opsjoner for dette instrumentet.

Ved å bruke Put/Call-forholdet som en indikator på investorsentimentet kan man overvinne en av de viktigste svakhetene ved å bruke totalt institusjonelt eierskap, nemlig at en betydelig andel av forvaltningskapitalen investeres passivt for å følge indekser. Passivt forvaltede fond kjøper vanligvis ikke opsjoner, slik at indikatoren for put/call-forhold i større grad gjenspeiler stemningen i aktivt forvaltede fond.

TPCS / TechPrecision Corporation Historical Put/Call Ratio
13F- og NPORT-arkiveringer

Detaljer om 13F-arkiveringer er gratis. Detaljer om NP-arkiveringer krever et premium-medlemskap. Grønne rader indikerer nye posisjoner. Røde rader indikerer lukkede posisjoner. Klikk på lenke ikonet for å se hele transaksjonshistorikken.

Oppgrader for å låse opp premiedata og eksportere til Excel. .

Fildato Kilde Investor Type Gjennomsnittlig pris
(estimert)
Aksjer Δ Aksjer
(%)
Rapportert verdi ($1000) Verdi (%) Portallokering (%)
2025-08-27 NP VTSMX - Vanguard Total Stock Market Index Fund Investor Shares This fund is a listed as child fund of Vanguard Group Inc and if that institution has disclosed ownership in this security, then these positions will not be double counted when calculating total shares and total value 135 185 75,85 504 186,36
2025-07-15 13F North Star Investment Management Corp. 3 0,00 0
2025-08-12 13F Proequities, Inc. 0 0
2025-06-26 NP DFSU - Dimensional US Sustainability Core 1 ETF 2 743 7
2025-06-26 NP DFA INVESTMENT DIMENSIONS GROUP INC - U.S. Sustainability Core 1 Portfolio Shares This fund is a listed as child fund of Dimensional Fund Advisors Lp and if that institution has disclosed ownership in this security, then these positions will not be double counted when calculating total shares and total value 3 904 10
2025-08-11 13F Vanguard Group Inc 263 466 28,42 983 108,49
2025-06-26 NP DFAC - Dimensional U.S. Core Equity 2 ETF 1 539 4
2025-06-03 NP PRCGX - Perritt MicroCap Opportunities Fund Investor Class 60 500 0,00 148 −22,22
2025-06-24 NP SWTSX - Schwab Total Stock Market Index Fund This fund is a listed as child fund of Charles Schwab Investment Management Inc and if that institution has disclosed ownership in this security, then these positions will not be double counted when calculating total shares and total value 4 478 0,00 11 −28,57
2025-08-14 13F Susquehanna International Group, Llp 20 216 21,33 75 97,37
2025-08-28 NP IWC - iShares Micro-Cap ETF This fund is a listed as child fund of BlackRock Inc. and if that institution has disclosed ownership in this security, then these positions will not be double counted when calculating total shares and total value 1 490 −91,04 6 −86,84
2025-07-28 13F Jag Capital Management, Llc 12 621 −46,57 47 −12,96
2025-07-24 NP FSKAX - Fidelity Total Market Index Fund This fund is a listed as child fund of Fmr Llc and if that institution has disclosed ownership in this security, then these positions will not be double counted when calculating total shares and total value 16 249 0,00 61 32,61
2025-08-14 13F State Street Corp 47 400 0,00 177 61,47
2025-07-24 NP FCFMX - Fidelity Series Total Market Index Fund This fund is a listed as child fund of Fmr Llc and if that institution has disclosed ownership in this security, then these positions will not be double counted when calculating total shares and total value 12 425 11,15 47 43,75
2025-08-08 13F Geode Capital Management, Llc 90 613 −0,04 338 62,50
2025-08-13 13F Northwestern Mutual Wealth Management Co 0 −100,00 0
2025-08-14 13F/A Perritt Capital Management Inc 77 522 0,00 290 62,36
2025-05-13 13F Northern Trust Corp 0 −100,00 0
2025-08-14 13F Citadel Advisors Llc 15 374 57
2025-08-12 13F Jpmorgan Chase & Co 0 −100,00 0
2025-08-12 13F BlackRock, Inc. 20 727 −45,83 78 −12,50
2025-07-24 NP FSMAX - Fidelity Extended Market Index Fund This fund is a listed as child fund of Fmr Llc and if that institution has disclosed ownership in this security, then these positions will not be double counted when calculating total shares and total value 47 668 4,60 180 38,46
2025-08-14 13F UBS Group AG 331 −97,45 1 −96,55
2025-08-14 13F GWM Advisors LLC 17 000 −28,14 64 16,67
2025-07-11 13F Caldwell Securities, Inc 750 0,00 3 100,00
2025-08-27 NP VEXMX - Vanguard Extended Market Index Fund Investor Shares This fund is a listed as child fund of Vanguard Group Inc and if that institution has disclosed ownership in this security, then these positions will not be double counted when calculating total shares and total value 125 690 0,00 469 61,94
2025-06-26 NP DCOR - Dimensional US Core Equity 1 ETF 3 842 9
2025-07-23 13F West Paces Advisors Inc. 0 −100,00 0 −100,00
2025-08-04 13F HBK Sorce Advisory LLC 27 000 0,00 101 61,29
2025-08-12 13F Dimensional Fund Advisors Lp 15 695 −7,82 59 48,72
2025-07-15 13F Wynnefield Capital Inc 433 605 0,00 1 622 62,59
2025-08-08 13F Kingsview Wealth Management, LLC 11 300 42
2025-08-14 13F Diversify Advisory Services, LLC 25 142 140
2025-07-29 13F Commons Capital, Llc 69 413 0,00 260 62,89
2025-08-15 13F Tower Research Capital LLC (TRC) 1 214 −50,49 5 −20,00
2025-08-26 NP EQ ADVISORS TRUST - 1290 VT Micro Cap Portfolio Class IB 174 −80,90 1 −100,00
2025-08-11 13F ARS Investment Partners, LLC 312 608 9,95 1 169 12,73
2025-08-14 13F Bank Of America Corp /de/ 119 58,67 0
2025-06-26 NP DFA INVESTMENT DIMENSIONS GROUP INC - U.S. Social Core Equity 2 Portfolio Shares This fund is a listed as child fund of Dimensional Fund Advisors Lp and if that institution has disclosed ownership in this security, then these positions will not be double counted when calculating total shares and total value 1 825 4
Fintel data has been cited in the following publications:
Daily Mail Fox Business Business Insider Wall Street Journal The Washington Post Bloomberg Financial Times Globe and Mail
NASDAQ.com Reuters The Guardian Associated Press FactCheck.org Snopes Politifact
Federal Register The Intercept Forbes Fortune Magazine TheStreet Time Magazine Canadian Broadcasting Corporation International Business Times
Cambridge University Press Investopedia MarketWatch NY Daily News Entrepreneur Newsweek Barron's El Economista