Grunnleggende statistikk
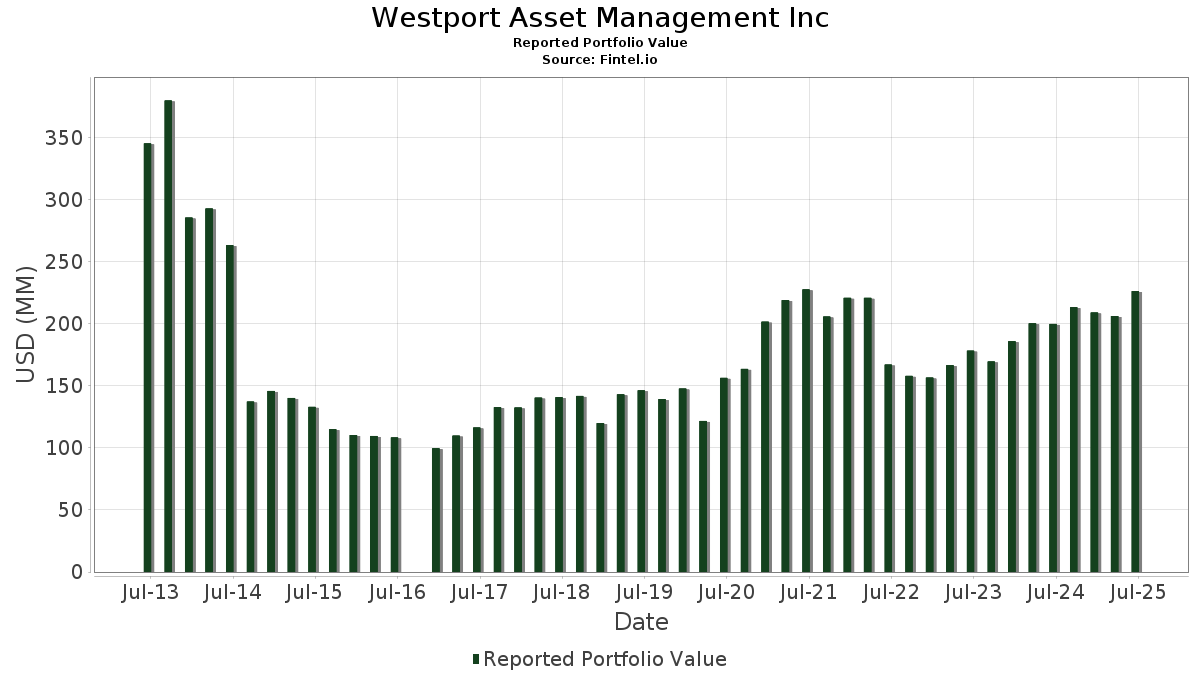
| Porteføljeverdi | $ 226 253 045 |
| Nåværende posisjoner | 76 |
Siste beholdninger, prestasjoner, forvaltet kapital (fra 13F, 13D)
Westport Asset Management Inc har oppgitt 76 totale beholdninger i sine siste SEC-arkiveringer. Siste porteføljeverdi er beregnet til 226 253 045 USD. Faktisk forvaltet kapital (AUM) er denne verdien pluss kontanter (som ikke er oppgitt). Westport Asset Management Incs største beholdninger er Synopsys, Inc. (US:SNPS) , Willis Towers Watson Public Limited Company (US:WTW) , Adtalem Global Education Inc. (US:ATGE) , MGIC Investment Corporation (US:MTG) , and Universal Health Services, Inc. (US:UHS) . Westport Asset Management Incs nye posisjoner inkluderer Adtalem Global Education Inc. (US:ATGE) , Coherent Corp. (US:COHR) , Elanco Animal Health Incorporated (DE:5EA) , Lee Enterprises, Incorporated (US:LEE) , and .
De største økningene dette kvartalet
Vi bruker endringen i porteføljeallokeringen fordi dette er det mest meningsfulle målet. Endringer kan skyldes handler eller endringer i aksjekursene.
| Verdipapirer | Aksjer (MM) |
Verdi (MM$) |
Portefølje % | ΔPortefølje % |
|---|---|---|---|---|
| 0,04 | 8,31 | 3,6720 | 1,0952 | |
| 0,05 | 26,15 | 11,5564 | 0,9484 | |
| 0,06 | 5,84 | 2,5805 | 0,3691 | |
| 0,01 | 6,03 | 2,6639 | 0,2322 | |
| 0,01 | 2,99 | 1,3213 | 0,1934 | |
| 0,01 | 1,03 | 0,4540 | 0,1739 | |
| 0,01 | 2,38 | 1,0535 | 0,1637 | |
| 0,44 | 12,22 | 5,4020 | 0,1256 | |
| 0,01 | 0,90 | 0,3991 | 0,1119 | |
| 0,00 | 0,25 | 0,1091 | 0,1091 |
De største reduksjonene dette kvartalet
Vi bruker endringen i porteføljeallokeringen fordi dette er det mest meningsfulle målet. Endringer kan skyldes handler eller endringer i aksjekurser.
| Verdipapirer | Aksjer (MM) |
Verdi (MM$) |
Portefølje % | ΔPortefølje % |
|---|---|---|---|---|
| 0,07 | 21,22 | 9,3790 | −1,9693 | |
| 0,07 | 11,79 | 5,2090 | −0,7202 | |
| 0,03 | 7,15 | 3,1586 | −0,4120 | |
| 0,04 | 4,65 | 2,0559 | −0,3630 | |
| 0,01 | 4,22 | 1,8663 | −0,1663 | |
| 0,04 | 7,63 | 3,3719 | −0,1550 | |
| 0,01 | 1,62 | 0,7146 | −0,1465 | |
| 0,01 | 3,70 | 1,6350 | −0,1268 | |
| 0,01 | 2,02 | 0,8949 | −0,1134 | |
| 0,00 | 1,11 | 0,4919 | −0,0959 |
13F- og Fondsarkiveringer
Dette skjemaet ble sendt inn den 2025-08-12 for rapporteringsperioden 2025-06-30. Klikk på lenkeikonet for å se hele transaksjonshistorikken.
Oppgradere for å låse opp premiedata og eksportere til Excel![]() .
.
| Verdipapirer | Type | Gjennomsnittlig aksjekurs | Aksjer (MM) |
ΔAksjer (%) |
ΔAksjer (%) |
Verdi ($MM) |
Portefølje (%) |
ΔPortefølje (%) |
|
|---|---|---|---|---|---|---|---|---|---|
| SNPS / Synopsys, Inc. | 0,05 | 0,00 | 26,15 | 19,55 | 11,5564 | 0,9484 | |||
| WTW / Willis Towers Watson Public Limited Company | 0,07 | 0,00 | 21,22 | −9,30 | 9,3790 | −1,9693 | |||
| ATGE / Adtalem Global Education Inc. | 0,13 | 16,00 | 0,0000 | ||||||
| MTG / MGIC Investment Corporation | 0,44 | 0,00 | 12,22 | 12,36 | 5,4020 | 0,1256 | |||
| UHS / Universal Health Services, Inc. | 0,07 | 0,00 | 11,79 | −3,59 | 5,2090 | −0,7202 | |||
| ZBRA / Zebra Technologies Corporation | 0,03 | 0,00 | 10,59 | 9,13 | 4,6795 | −0,0260 | |||
| ORCL / Oracle Corporation | 0,04 | 0,00 | 8,31 | 56,38 | 3,6720 | 1,0952 | |||
| DRI / Darden Restaurants, Inc. | 0,04 | 0,00 | 7,63 | 4,91 | 3,3719 | −0,1550 | |||
| CHKP / Check Point Software Technologies Ltd. | 0,03 | 0,00 | 7,15 | −2,92 | 3,1586 | −0,4120 | |||
| URI / United Rentals, Inc. | 0,01 | 0,00 | 6,03 | 20,23 | 2,6639 | 0,2322 | |||
| UBER / Uber Technologies, Inc. | 0,06 | 0,00 | 5,84 | 28,05 | 2,5805 | 0,3691 | |||
| PTC / PTC Inc. | 0,03 | 0,00 | 5,36 | 11,23 | 2,3689 | 0,0316 | |||
| IPGP / IPG Photonics Corporation | 0,08 | 0,00 | 5,32 | 8,73 | 2,3515 | −0,0219 | |||
| DVYA / iShares, Inc. - iShares Asia/Pacific Dividend ETF | 0,10 | 0,00 | 4,82 | 10,39 | 2,1321 | 0,0126 | |||
| RDN / Radian Group Inc. | 0,13 | 0,00 | 4,70 | 8,91 | 2,0755 | −0,0156 | |||
| EOG / EOG Resources, Inc. | 0,04 | 0,00 | 4,65 | −6,74 | 2,0559 | −0,3630 | |||
| GOOG / Alphabet Inc. | 0,02 | 0,00 | 4,26 | 13,55 | 1,8817 | 0,0631 | |||
| LIN / Linde plc | 0,01 | 0,00 | 4,22 | 0,76 | 1,8663 | −0,1663 | |||
| CARR / Carrier Global Corporation | 0,05 | 0,00 | 3,84 | 15,44 | 1,6951 | 0,0838 | |||
| RSG / Republic Services, Inc. | 0,01 | 0,00 | 3,70 | 1,84 | 1,6350 | −0,1268 | |||
| CHTR / Charter Communications, Inc. | 0,01 | 0,00 | 3,09 | 10,95 | 1,3658 | 0,0147 | |||
| ROK / Rockwell Automation, Inc. | 0,01 | 0,00 | 2,99 | 28,56 | 1,3213 | 0,1934 | |||
| IBM / International Business Machines Corporation | 0,01 | 0,00 | 2,95 | 18,54 | 1,3029 | 0,0968 | |||
| TSBK / Timberland Bancorp, Inc. | 0,08 | 0,00 | 2,52 | 3,49 | 1,1157 | −0,0674 | |||
| RHP / Ryman Hospitality Properties, Inc. | 0,03 | 0,00 | 2,47 | 7,87 | 1,0903 | −0,0185 | |||
| CACI / CACI International Inc | 0,01 | 0,00 | 2,38 | 29,93 | 1,0535 | 0,1637 | |||
| ROST / Ross Stores, Inc. | 0,02 | 0,00 | 2,17 | −0,18 | 0,9586 | −0,0951 | |||
| UNP / Union Pacific Corporation | 0,01 | 0,00 | 2,02 | −2,60 | 0,8949 | −0,1134 | |||
| AKAM / Akamai Technologies, Inc. | 0,03 | 0,80 | 2,01 | −0,15 | 0,8884 | −0,0877 | |||
| AMZN / Amazon.com, Inc. | 0,01 | 0,00 | 1,91 | 15,31 | 0,8455 | 0,0409 | |||
| EXP / Eagle Materials Inc. | 0,01 | 0,00 | 1,62 | −8,96 | 0,7146 | −0,1465 | |||
| NSC / Norfolk Southern Corporation | 0,01 | 0,00 | 1,54 | 8,02 | 0,6788 | −0,0105 | |||
| ROG / Rogers Corporation | 0,02 | 0,00 | 1,40 | 1,38 | 0,6191 | −0,0509 | |||
| TXN / Texas Instruments Incorporated | 0,01 | 0,00 | 1,25 | 15,62 | 0,5530 | 0,0278 | |||
| CVS / CVS Health Corporation | 0,02 | 0,00 | 1,23 | 1,74 | 0,5418 | −0,0422 | |||
| COHR / Coherent Corp. | 0,01 | 1,20 | 0,0000 | ||||||
| VRTX / Vertex Pharmaceuticals Incorporated | 0,00 | 0,00 | 1,11 | −8,17 | 0,4919 | −0,0959 | |||
| GILD / Gilead Sciences, Inc. | 0,01 | 0,00 | 1,11 | −1,07 | 0,4900 | −0,0534 | |||
| WBD / Warner Bros. Discovery, Inc. | 0,10 | 0,00 | 1,10 | 6,82 | 0,4852 | −0,0133 | |||
| AZN / AstraZeneca PLC - Depositary Receipt (Common Stock) | 0,01 | 0,00 | 1,05 | −4,90 | 0,4633 | −0,0714 | |||
| VRT / Vertiv Holdings Co | 0,01 | 0,00 | 1,03 | 77,99 | 0,4540 | 0,1739 | |||
| SKX / Skechers U.S.A., Inc. | 0,01 | 0,00 | 0,95 | 11,16 | 0,4183 | 0,0052 | |||
| T / AT&T Inc. | 0,03 | 0,00 | 0,92 | 2,33 | 0,4083 | −0,0295 | |||
| LITE / Lumentum Holdings Inc. | 0,01 | 0,00 | 0,90 | 52,53 | 0,3991 | 0,1119 | |||
| BIO / Bio-Rad Laboratories, Inc. | 0,00 | 0,00 | 0,72 | −0,96 | 0,3200 | −0,0344 | |||
| APD / Air Products and Chemicals, Inc. | 0,00 | 0,00 | 0,71 | −4,34 | 0,3117 | −0,0459 | |||
| ANSS / ANSYS, Inc. | 0,00 | 0,00 | 0,70 | 10,90 | 0,3105 | 0,0034 | |||
| NTR / Nutrien Ltd. | 0,01 | 0,00 | 0,65 | 17,36 | 0,2870 | 0,0184 | |||
| EA / Electronic Arts Inc. | 0,00 | 0,00 | 0,64 | 10,38 | 0,2823 | 0,0020 | |||
| FMC / FMC Corporation | 0,01 | 0,00 | 0,63 | −0,95 | 0,2768 | −0,0302 | |||
| RTX / RTX Corporation | 0,00 | 0,00 | 0,60 | 10,26 | 0,2664 | 0,0012 | |||
| MDU / MDU Resources Group, Inc. | 0,04 | 0,00 | 0,58 | −1,35 | 0,2579 | −0,0292 | |||
| ABT / Abbott Laboratories | 0,00 | 0,00 | 0,54 | 2,64 | 0,2405 | −0,0169 | |||
| FCPT / Four Corners Property Trust, Inc. | 0,02 | 0,00 | 0,54 | −6,11 | 0,2379 | −0,0405 | |||
| CRWD / CrowdStrike Holdings, Inc. | 0,00 | 0,00 | 0,51 | 44,60 | 0,2251 | 0,0541 | |||
| VRNT / Verint Systems Inc. | 0,02 | 0,00 | 0,44 | 10,22 | 0,1956 | 0,0008 | |||
| CGNT / Cognyte Software Ltd. | 0,04 | 0,00 | 0,42 | 18,23 | 0,1838 | 0,0135 | |||
| ADM / Archer-Daniels-Midland Company | 0,01 | 0,00 | 0,40 | 9,72 | 0,1750 | 0,0003 | |||
| AVGO / Broadcom Inc. | 0,00 | 0,00 | 0,36 | 64,84 | 0,1598 | 0,0533 | |||
| IPG / The Interpublic Group of Companies, Inc. | 0,01 | 0,00 | 0,34 | −10,00 | 0,1515 | −0,0329 | |||
| OXY / Occidental Petroleum Corporation | 0,01 | 0,00 | 0,34 | −14,96 | 0,1510 | −0,0437 | |||
| NEM / Newmont Corporation | 0,01 | 0,00 | 0,32 | 20,75 | 0,1418 | 0,0128 | |||
| ZTS / Zoetis Inc. | 0,00 | 0,00 | 0,31 | −5,47 | 0,1379 | −0,0219 | |||
| APH / Amphenol Corporation | 0,00 | 0,25 | 0,1091 | 0,1091 | |||||
| ECG / Everus Construction Group, Inc. | 0,00 | 0,00 | 0,24 | 71,22 | 0,1053 | 0,0378 | |||
| Canadian Pacific Railway Ltd / (13645T100) | 0,00 | 0,23 | 0,0000 | ||||||
| S / SentinelOne, Inc. | 0,01 | 0,00 | 0,23 | 0,44 | 0,1010 | −0,0092 | |||
| THC / Tenet Healthcare Corporation | 0,00 | 0,00 | 0,18 | 31,34 | 0,0778 | 0,0126 | |||
| TDC / Teradata Corporation | 0,01 | 0,00 | 0,17 | −0,60 | 0,0740 | −0,0078 | |||
| 5EA / Elanco Animal Health Incorporated | 0,01 | 0,14 | 0,0631 | 0,0631 | |||||
| GHC / Graham Holdings Company | 0,00 | 0,00 | 0,14 | −2,08 | 0,0627 | −0,0072 | |||
| VOD / Vodafone Group Public Limited Company - Depositary Receipt (Common Stock) | 0,01 | 0,00 | 0,10 | 13,10 | 0,0424 | 0,0015 | |||
| HAL / Halliburton Company | 0,00 | 0,00 | 0,07 | −19,54 | 0,0310 | −0,0114 | |||
| VZ / Verizon Communications Inc. | 0,00 | 0,00 | 0,04 | −5,13 | 0,0165 | −0,0025 | |||
| CABO / Cable One, Inc. | 0,00 | 0,00 | 0,02 | −48,72 | 0,0090 | −0,0103 | |||
| LEE / Lee Enterprises, Incorporated | 0,00 | 0,00 | 0,0000 |