Grunnleggende statistikk
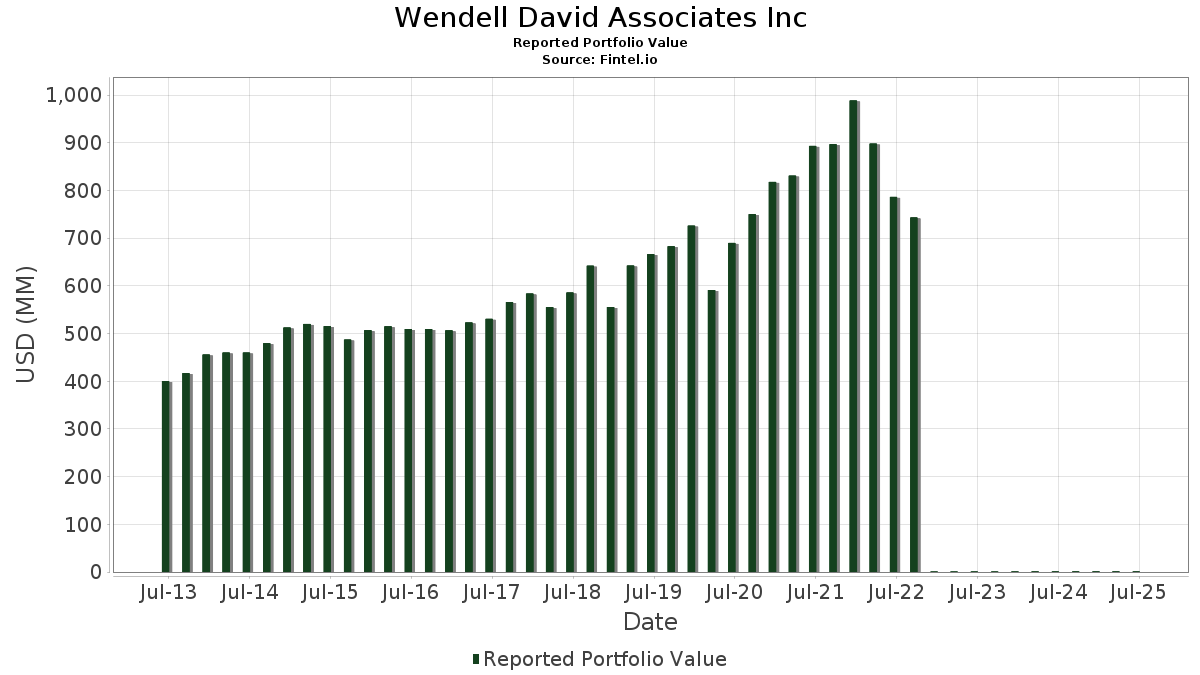
| Porteføljeverdi | $ 994 303 |
| Nåværende posisjoner | 146 |
Siste beholdninger, prestasjoner, forvaltet kapital (fra 13F, 13D)
Wendell David Associates Inc har oppgitt 146 totale beholdninger i sine siste SEC-arkiveringer. Siste porteføljeverdi er beregnet til 994 303 USD. Faktisk forvaltet kapital (AUM) er denne verdien pluss kontanter (som ikke er oppgitt). Wendell David Associates Incs største beholdninger er Microsoft Corporation (US:MSFT) , Mastercard Incorporated (US:MA) , Apple Inc. (US:AAPL) , Automatic Data Processing, Inc. (US:ADP) , and The TJX Companies, Inc. (US:TJX) .
De største økningene dette kvartalet
Vi bruker endringen i porteføljeallokeringen fordi dette er det mest meningsfulle målet. Endringer kan skyldes handler eller endringer i aksjekursene.
| Verdipapirer | Aksjer (MM) |
Verdi (MM$) |
Portefølje % | ΔPortefølje % |
|---|---|---|---|---|
| 0,13 | 0,07 | 6,6933 | 1,6356 | |
| 0,04 | 0,03 | 3,1620 | 0,7095 | |
| 0,12 | 0,02 | 2,0825 | 0,2866 | |
| 0,11 | 0,04 | 4,5203 | 0,1961 | |
| 0,08 | 0,01 | 1,2799 | 0,1672 | |
| 0,01 | 0,01 | 0,7094 | 0,1575 | |
| 0,04 | 0,00 | 0,4098 | 0,1560 | |
| 0,02 | 0,01 | 0,5616 | 0,1486 | |
| 0,01 | 0,00 | 0,4063 | 0,1035 | |
| 0,04 | 0,01 | 0,8609 | 0,0980 |
De største reduksjonene dette kvartalet
Vi bruker endringen i porteføljeallokeringen fordi dette er det mest meningsfulle målet. Endringer kan skyldes handler eller endringer i aksjekurser.
| Verdipapirer | Aksjer (MM) |
Verdi (MM$) |
Portefølje % | ΔPortefølje % |
|---|---|---|---|---|
| 0,27 | 0,06 | 5,5831 | −0,9031 | |
| 0,13 | 0,02 | 2,2976 | −0,6575 | |
| 0,16 | 0,02 | 1,5583 | −0,2824 | |
| 0,04 | 0,03 | 3,2657 | −0,2716 | |
| 0,10 | 0,02 | 1,8624 | −0,2672 | |
| 0,05 | 0,01 | 1,0298 | −0,2475 | |
| 0,03 | 0,01 | 1,4245 | −0,2029 | |
| 0,08 | 0,01 | 1,0363 | −0,1808 | |
| 0,10 | 0,00 | 0,2738 | −0,1727 | |
| 0,16 | 0,01 | 1,2113 | −0,1498 |
13F- og Fondsarkiveringer
Dette skjemaet ble sendt inn den 2025-07-29 for rapporteringsperioden 2025-06-30. Klikk på lenkeikonet for å se hele transaksjonshistorikken.
Oppgradere for å låse opp premiedata og eksportere til Excel![]() .
.
| Verdipapirer | Type | Gjennomsnittlig aksjekurs | Aksjer (MM) |
ΔAksjer (%) |
ΔAksjer (%) |
Verdi ($MM) |
Portefølje (%) |
ΔPortefølje (%) |
|
|---|---|---|---|---|---|---|---|---|---|
| MSFT / Microsoft Corporation | 0,13 | −0,92 | 0,07 | 32,00 | 6,6933 | 1,6356 | |||
| MA / Mastercard Incorporated | 0,12 | −2,31 | 0,06 | 0,00 | 6,5000 | 0,0611 | |||
| AAPL / Apple Inc. | 0,27 | −7,55 | 0,06 | −15,38 | 5,5831 | −0,9031 | |||
| ADP / Automatic Data Processing, Inc. | 0,18 | −0,83 | 0,06 | 0,00 | 5,5817 | 0,0500 | |||
| TJX / The TJX Companies, Inc. | 0,38 | −1,96 | 0,05 | 0,00 | 4,7269 | 0,0093 | |||
| SYK / Stryker Corporation | 0,11 | −2,42 | 0,04 | 2,33 | 4,5203 | 0,1961 | |||
| LLY / Eli Lilly and Company | 0,04 | −2,96 | 0,03 | −8,57 | 3,2657 | −0,2716 | |||
| INTU / Intuit Inc. | 0,04 | −0,29 | 0,03 | 29,17 | 3,1620 | 0,7095 | |||
| ABT / Abbott Laboratories | 0,22 | −1,13 | 0,03 | 0,00 | 2,9796 | 0,0636 | |||
| BR / Broadridge Financial Solutions, Inc. | 0,10 | −1,45 | 0,02 | 0,00 | 2,4670 | −0,0106 | |||
| FI / Fiserv, Inc. | 0,13 | −1,20 | 0,02 | −24,14 | 2,2976 | −0,6575 | |||
| MCD / McDonald's Corporation | 0,07 | −0,57 | 0,02 | −8,70 | 2,1818 | −0,1458 | |||
| GOOG.L / Alphabet Inc. | 0,12 | 0,95 | 0,02 | 17,65 | 2,0825 | 0,2866 | |||
| ECL / Ecolab Inc. | 0,07 | −2,74 | 0,02 | 5,56 | 1,9209 | 0,0772 | |||
| ABBV / AbbVie Inc. | 0,10 | −2,07 | 0,02 | −14,29 | 1,8624 | −0,2672 | |||
| NEE / NextEra Energy, Inc. | 0,25 | −2,06 | 0,02 | 0,00 | 1,7333 | −0,0596 | |||
| COST / Costco Wholesale Corporation | 0,02 | −6,02 | 0,02 | 0,00 | 1,6808 | −0,0143 | |||
| JNJ / Johnson & Johnson | 0,10 | −1,43 | 0,02 | −11,76 | 1,5951 | −0,1479 | |||
| CHD / Church & Dwight Co., Inc. | 0,16 | −3,80 | 0,02 | −16,67 | 1,5583 | −0,2824 | |||
| PGCL / The Procter & Gamble Company | 0,09 | 0,03 | 0,01 | −6,67 | 1,4800 | −0,0901 | |||
| WSO / Watsco, Inc. | 0,03 | −0,05 | 0,01 | −12,50 | 1,4245 | −0,2029 | |||
| MPC / Marathon Petroleum Corporation | 0,08 | 0,09 | 0,01 | 9,09 | 1,2799 | 0,1672 | |||
| KO / The Coca-Cola Company | 0,17 | −1,68 | 0,01 | 0,00 | 1,2309 | −0,0264 | |||
| MKC / McCormick & Company, Incorporated | 0,16 | −4,15 | 0,01 | −7,69 | 1,2113 | −0,1498 | |||
| FDS / FactSet Research Systems Inc. | 0,02 | −5,01 | 0,01 | −9,09 | 1,1011 | −0,0678 | |||
| PEP / PepsiCo, Inc. | 0,08 | −4,07 | 0,01 | −16,67 | 1,0363 | −0,1808 | |||
| DHR / Danaher Corporation | 0,05 | −16,99 | 0,01 | −16,67 | 1,0298 | −0,2475 | |||
| XOM / Exxon Mobil Corporation | 0,09 | −4,08 | 0,01 | −9,09 | 1,0193 | −0,1438 | |||
| NKE / NIKE, Inc. | 0,14 | −7,32 | 0,01 | 0,00 | 0,9859 | 0,0428 | |||
| HD / The Home Depot, Inc. | 0,03 | −6,92 | 0,01 | −10,00 | 0,9601 | −0,0628 | |||
| AMZN / Amazon.com, Inc. | 0,04 | −2,91 | 0,01 | 14,29 | 0,8609 | 0,0980 | |||
| ACN / Accenture plc | 0,03 | −0,09 | 0,01 | 0,00 | 0,8290 | −0,0304 | |||
| WMT / Walmart Inc. | 0,08 | −6,16 | 0,01 | 14,29 | 0,8240 | 0,0418 | |||
| SHW / The Sherwin-Williams Company | 0,02 | 0,00 | 0,01 | −12,50 | 0,7997 | −0,0071 | |||
| AMT / American Tower Corporation | 0,04 | −1,35 | 0,01 | 0,00 | 0,7895 | 0,0078 | |||
| CL / Colgate-Palmolive Company | 0,08 | −1,57 | 0,01 | 0,00 | 0,7111 | −0,0277 | |||
| IDXX / IDEXX Laboratories, Inc. | 0,01 | −0,15 | 0,01 | 40,00 | 0,7094 | 0,1575 | |||
| V / Visa Inc. | 0,02 | −0,38 | 0,01 | 0,00 | 0,7019 | 0,0119 | |||
| BRK.B / Berkshire Hathaway Inc. | 0,01 | 3,51 | 0,01 | −14,29 | 0,6979 | −0,0355 | |||
| RTX / RTX Corporation | 0,05 | 0,00 | 0,01 | 20,00 | 0,6630 | 0,0663 | |||
| VEEV / Veeva Systems Inc. | 0,02 | 8,52 | 0,01 | 25,00 | 0,5616 | 0,1486 | |||
| QCOM / QUALCOMM Incorporated | 0,03 | −0,25 | 0,01 | 0,00 | 0,5566 | 0,0227 | |||
| ORLY / O'Reilly Automotive, Inc. | 0,06 | 1 390,19 | 0,01 | 0,00 | 0,5161 | −0,0300 | |||
| AJG / Arthur J. Gallagher & Co. | 0,02 | 6,39 | 0,01 | 0,00 | 0,5129 | −0,0029 | |||
| NVO / Novo Nordisk A/S - Depositary Receipt (Common Stock) | 0,07 | −5,18 | 0,01 | 0,00 | 0,5054 | −0,0265 | |||
| SYY / Sysco Corporation | 0,06 | −0,37 | 0,00 | 0,00 | 0,4623 | 0,0062 | |||
| GWW / W.W. Grainger, Inc. | 0,00 | 0,00 | 0,00 | 0,00 | 0,4514 | 0,0262 | |||
| APCD / Air Products and Chemicals, Inc. | 0,02 | −0,64 | 0,00 | 0,00 | 0,4477 | −0,0197 | |||
| EMR / Emerson Electric Co. | 0,03 | 0,51 | 0,00 | 33,33 | 0,4472 | 0,0842 | |||
| LOW / Lowe's Companies, Inc. | 0,02 | 0,00 | 0,00 | 0,00 | 0,4378 | −0,0188 | |||
| MRKCL / Merck & Co., Inc. | 0,05 | 0,00 | 0,00 | 0,00 | 0,4372 | −0,0546 | |||
| APH / Amphenol Corporation | 0,04 | 6,42 | 0,00 | 100,00 | 0,4098 | 0,1560 | |||
| DE / Deere & Company | 0,01 | 22,87 | 0,00 | 33,33 | 0,4063 | 0,1035 | |||
| PAYX / Paychex, Inc. | 0,03 | −9,94 | 0,00 | −25,00 | 0,3995 | −0,0672 | |||
| IUI1 / Intuitive Surgical, Inc. | 0,01 | 0,00 | 0,00 | 0,00 | 0,3976 | 0,0381 | |||
| ITW / Illinois Tool Works Inc. | 0,01 | −0,71 | 0,00 | 0,00 | 0,3662 | −0,0008 | |||
| 1CASY / Casey's General Stores, Inc. | 0,01 | 1,75 | 0,00 | 50,00 | 0,3579 | 0,0611 | |||
| EQIX / Equinix, Inc. | 0,00 | 1,02 | 0,00 | 0,00 | 0,3501 | −0,0023 | |||
| LMT / Lockheed Martin Corporation | 0,01 | −0,57 | 0,00 | 0,00 | 0,3413 | 0,0128 | |||
| ADI / Analog Devices, Inc. | 0,01 | 0,00 | 0,00 | 50,00 | 0,3315 | 0,0529 | |||
| FAS / Fastenal Company | 0,08 | 100,00 | 0,00 | 0,00 | 0,3312 | 0,0279 | |||
| HON / Honeywell International Inc. | 0,01 | −4,14 | 0,00 | 0,00 | 0,3284 | 0,0194 | |||
| CSCO / Cisco Systems, Inc. | 0,05 | −10,07 | 0,00 | 0,00 | 0,3238 | 0,0061 | |||
| AMGN / Amgen Inc. | 0,01 | −0,19 | 0,00 | 0,00 | 0,3050 | −0,0333 | |||
| BCPC / Balchem Corporation | 0,02 | 0,00 | 0,00 | 0,00 | 0,2743 | −0,0094 | |||
| BFB / Brown-Forman Corp. - Class B | 0,10 | −23,28 | 0,00 | −50,00 | 0,2738 | −0,1727 | |||
| IBM / International Business Machines Corporation | 0,01 | 0,00 | 0,00 | 0,00 | 0,2448 | 0,0400 | |||
| UNP / Union Pacific Corporation | 0,01 | −1,40 | 0,00 | 0,00 | 0,2440 | −0,0081 | |||
| BDX / Becton, Dickinson and Company | 0,01 | −3,36 | 0,00 | −33,33 | 0,2364 | −0,0863 | |||
| NVDA / NVIDIA Corporation | 0,01 | −4,53 | 0,00 | 100,00 | 0,2275 | 0,0654 | |||
| PMI / Philip Morris International Inc. | 0,01 | 0,00 | 0,00 | 100,00 | 0,2044 | 0,0277 | |||
| PFF / iShares Trust - iShares Preferred and Income Securities ETF | 0,06 | 0,00 | 0,00 | 0,00 | 0,1951 | 0,0012 | |||
| DKS / DICK'S Sporting Goods, Inc. | 0,01 | 1,99 | 0,00 | 0,00 | 0,1732 | 0,0016 | |||
| HEI / HEICO Corporation | 0,01 | −0,29 | 0,00 | 0,00 | 0,1725 | 0,0327 | |||
| VZ / Verizon Communications Inc. | 0,04 | −2,63 | 0,00 | 0,00 | 0,1679 | −0,0114 | |||
| GILD / Gilead Sciences, Inc. | 0,01 | 0,00 | 0,00 | 0,00 | 0,1499 | −0,0004 | |||
| PPG / PPG Industries, Inc. | 0,01 | 0,00 | 0,00 | 0,00 | 0,1425 | 0,0066 | |||
| PFECL / Pfizer Inc. | 0,06 | −3,09 | 0,00 | 0,00 | 0,1391 | −0,0097 | |||
| JKHY / Jack Henry & Associates, Inc. | 0,01 | 0,00 | 0,00 | 0,00 | 0,1345 | −0,0007 | |||
| MMMCL / 3M Company | 0,01 | 0,00 | 0,00 | 0,00 | 0,1307 | 0,0056 | |||
| CARR / Carrier Global Corporation | 0,02 | −0,58 | 0,00 | 0,00 | 0,1259 | 0,0171 | |||
| VLTO / Veralto Corporation | 0,01 | −0,88 | 0,00 | 0,00 | 0,1195 | 0,0040 | |||
| SBUX / Starbucks Corporation | 0,01 | −5,52 | 0,00 | 0,00 | 0,1182 | −0,0147 | |||
| COP / ConocoPhillips | 0,01 | 0,77 | 0,00 | 0,00 | 0,1177 | −0,0179 | |||
| JPM / JPMorgan Chase & Co. | 0,00 | 0,00 | 0,00 | 0,1167 | 0,0188 | ||||
| K / Kellanova | 0,01 | 0,00 | 0,00 | 0,00 | 0,1127 | −0,0033 | |||
| CVXCL / Chevron Corporation | 0,01 | 0,00 | 0,00 | 0,00 | 0,1119 | −0,0178 | |||
| TMO / Thermo Fisher Scientific Inc. | 0,00 | −9,40 | 0,00 | 0,00 | 0,1093 | −0,0375 | |||
| EXPD / Expeditors International of Washington, Inc. | 0,01 | 2,11 | 0,00 | 0,00 | 0,1038 | −0,0024 | |||
| NSC / Norfolk Southern Corporation | 0,00 | 0,00 | 0,00 | 0,1036 | 0,0085 | ||||
| NOC / Northrop Grumman Corporation | 0,00 | 0,00 | 0,00 | −100,00 | 0,0992 | −0,0015 | |||
| DIS / The Walt Disney Company | 0,01 | −0,89 | 0,00 | 0,0975 | 0,0198 | ||||
| BAC / Bank of America Corporation | 0,02 | 0,00 | 0,00 | 0,0971 | 0,0121 | ||||
| ORCLCL / Oracle Corporation | 0,00 | 0,00 | 0,00 | 0,0970 | 0,0354 | ||||
| ULTA / Ulta Beauty, Inc. | 0,00 | 0,00 | 0,00 | 0,0967 | 0,0215 | ||||
| ZTS / Zoetis Inc. | 0,01 | −3,43 | 0,00 | 0,0905 | −0,0077 | ||||
| HSY / The Hershey Company | 0,01 | 0,00 | 0,00 | 0,0867 | −0,0020 | ||||
| BMY / Bristol-Myers Squibb Company | 0,02 | −5,16 | 0,00 | −100,00 | 0,0867 | −0,0328 | |||
| EW / Edwards Lifesciences Corporation | 0,01 | −40,65 | 0,00 | −100,00 | 0,0836 | −0,0458 | |||
| CI / The Cigna Group | 0,00 | 24,44 | 0,00 | 0,0770 | 0,0159 | ||||
| SNPS / Synopsys, Inc. | 0,00 | 32,68 | 0,00 | 0,0764 | 0,0286 | ||||
| PANW / Palo Alto Networks, Inc. | 0,00 | −2,31 | 0,00 | 0,0740 | 0,0114 | ||||
| BRK.A / Berkshire Hathaway Inc. | 0,00 | 0,00 | 0,00 | 0,0733 | −0,0063 | ||||
| HPQ / HP Inc. | 0,03 | 0,00 | 0,00 | 0,0682 | −0,0083 | ||||
| 1TRMB / Trimble Inc. | 0,01 | −0,88 | 0,00 | 0,0665 | 0,0090 | ||||
| ROST / Ross Stores, Inc. | 0,01 | 0,00 | 0,00 | 0,0656 | 0,0004 | ||||
| GE / General Electric Company | 0,00 | 0,00 | 0,00 | 0,0644 | 0,0147 | ||||
| T / AT&T Inc. | 0,02 | 0,00 | 0,00 | 0,0636 | 0,0019 | ||||
| GOOGL / Alphabet Inc. | 0,00 | 2,70 | 0,00 | 0,0591 | 0,0088 | ||||
| ALCO / Alico, Inc. | 0,02 | 0,00 | 0,00 | 0,0587 | 0,0056 | ||||
| WSM / Williams-Sonoma, Inc. | 0,00 | 0,00 | 0,00 | 0,0575 | 0,0024 | ||||
| CAT / Caterpillar Inc. | 0,00 | 0,00 | 0,00 | 0,0563 | 0,0088 | ||||
| DRI / Darden Restaurants, Inc. | 0,00 | 0,00 | 0,00 | 0,0548 | 0,0030 | ||||
| OTIS / Otis Worldwide Corporation | 0,01 | −0,91 | 0,00 | 0,0542 | −0,0024 | ||||
| FBIN / Fortune Brands Innovations, Inc. | 0,01 | 0,00 | 0,00 | 0,0536 | −0,0093 | ||||
| FLO / Flowers Foods, Inc. | 0,03 | 0,00 | 0,00 | 0,0535 | −0,0097 | ||||
| 1TSCO / Tractor Supply Company | 0,01 | −1,25 | 0,00 | 0,0526 | −0,0026 | ||||
| LIN / Linde plc | 0,00 | −1,82 | 0,00 | 0,0508 | −0,0001 | ||||
| RBC / RBC Bearings Incorporated | 0,00 | 0,00 | 0,00 | 0,0499 | 0,0085 | ||||
| RHHBY / Roche Holding AG - Depositary Receipt (Common Stock) | 0,01 | 0,00 | 0,00 | 0,0496 | −0,0001 | ||||
| MDLZ / Mondelez International, Inc. | 0,01 | 0,00 | 0,00 | 0,0478 | 0,0001 | ||||
| DUK / Duke Energy Corporation | 0,00 | 1,87 | 0,00 | 0,0460 | −0,0003 | ||||
| CTAS / Cintas Corporation | 0,00 | 3,81 | 0,00 | 0,0458 | 0,0055 | ||||
| CSX / CSX Corporation | 0,01 | −0,79 | 0,00 | 0,0438 | 0,0042 | ||||
| EOG / EOG Resources, Inc. | 0,00 | −25,79 | 0,00 | 0,0415 | −0,0180 | ||||
| INGR / Ingredion Incorporated | 0,00 | 0,00 | 0,00 | 0,0409 | 0,0004 | ||||
| ALL / The Allstate Corporation | 0,00 | 0,00 | 0,00 | 0,0405 | −0,0008 | ||||
| GPC / Genuine Parts Company | 0,00 | 1,54 | 0,00 | 0,0403 | 0,0016 | ||||
| LHX / L3Harris Technologies, Inc. | 0,00 | 0,00 | 0,00 | 0,0402 | 0,0069 | ||||
| TMUS / T-Mobile US, Inc. | 0,00 | 0,00 | 0,00 | 0,0396 | −0,0044 | ||||
| HPE / Hewlett Packard Enterprise Company | 0,02 | 0,00 | 0,00 | 0,0395 | 0,0100 | ||||
| MO / Altria Group, Inc. | 0,01 | 0,00 | 0,00 | 0,0382 | −0,0006 | ||||
| AME / AMETEK, Inc. | 0,00 | −1,98 | 0,00 | 0,0377 | 0,0014 | ||||
| AVGO / Broadcom Inc. | 0,00 | 0,00 | 0,00 | 0,0370 | 0,0147 | ||||
| GEV / GE Vernova Inc. | 0,00 | 0,00 | 0,0354 | 0,0354 | |||||
| TXN / Texas Instruments Incorporated | 0,00 | 0,00 | 0,00 | 0,0353 | 0,0050 | ||||
| RSG / Republic Services, Inc. | 0,00 | 0,00 | 0,00 | 0,0336 | 0,0009 | ||||
| ETN / Eaton Corporation plc | 0,00 | 0,00 | 0,00 | 0,0336 | 0,0081 | ||||
| WM / Waste Management, Inc. | 0,00 | 0,00 | 0,00 | 0,0317 | −0,0001 | ||||
| 2KD / Kinder Morgan, Inc. | 0,01 | 0,00 | 0,00 | 0,0296 | 0,0011 | ||||
| TT / Trane Technologies plc | 0,00 | −5,68 | 0,00 | 0,0255 | 0,0049 | ||||
| META / Meta Platforms, Inc. | 0,00 | 0,00 | 0,0239 | 0,0239 | |||||
| UNH / UnitedHealth Group Incorporated | 0,00 | −4,07 | 0,00 | 0,0237 | −0,0174 | ||||
| GIS / General Mills, Inc. | 0,00 | 0,00 | 0,00 | 0,0210 | −0,0030 | ||||
| GD / General Dynamics Corporation | 0,00 | −5,02 | 0,00 | 0,0205 | 0,0005 | ||||
| KMB / Kimberly-Clark Corporation | 0,00 | 0,00 | 0,00 | 0,0204 | −0,0019 | ||||
| EFX / Equifax Inc. | 0,00 | −100,00 | 0,00 | 0,0000 | |||||
| TECH / Bio-Techne Corporation | 0,00 | −100,00 | 0,00 | 0,0000 | |||||
| HSIC / Henry Schein, Inc. | 0,00 | −100,00 | 0,00 | 0,0000 | |||||
| CMI / Cummins Inc. | 0,00 | −100,00 | 0,00 | 0,0000 | |||||
| BSTK / Brite-Strike Tactical Illumination Products, Inc. | 0,05 | 0,00 | 0,00 | 0,0000 | −0,0001 | ||||
| DD / DuPont de Nemours, Inc. | 0,00 | −100,00 | 0,00 | 0,0000 | |||||
| FTV / Fortive Corporation | 0,00 | −100,00 | 0,00 | 0,0000 |