Grunnleggende statistikk
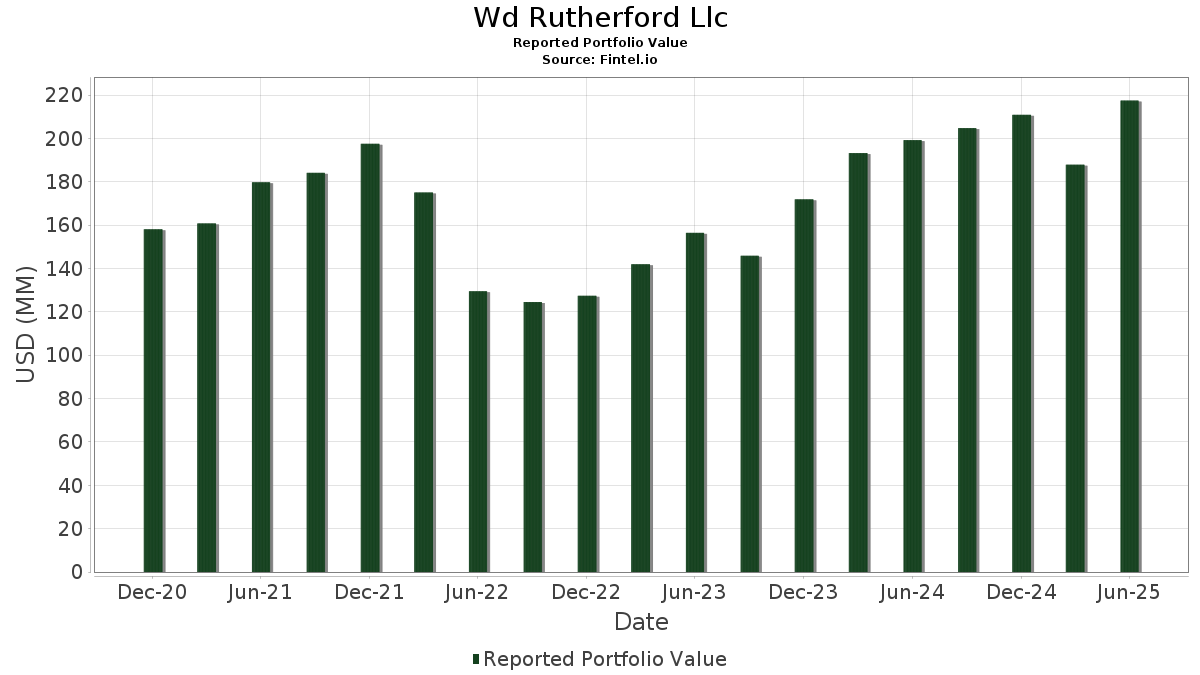
| Porteføljeverdi | $ 217 440 896 |
| Nåværende posisjoner | 96 |
Siste beholdninger, prestasjoner, forvaltet kapital (fra 13F, 13D)
Wd Rutherford Llc har oppgitt 96 totale beholdninger i sine siste SEC-arkiveringer. Siste porteføljeverdi er beregnet til 217 440 896 USD. Faktisk forvaltet kapital (AUM) er denne verdien pluss kontanter (som ikke er oppgitt). Wd Rutherford Llcs største beholdninger er NVIDIA Corporation (US:NVDA) , Microsoft Corporation (US:MSFT) , CrowdStrike Holdings, Inc. (US:CRWD) , JPMorgan Chase & Co. (US:JPM) , and Netflix, Inc. (US:NFLX) . Wd Rutherford Llcs nye posisjoner inkluderer Lam Research Corporation (US:LRCX) , Vertiv Holdings Co (US:VRT) , Sempra (US:SRE) , Hims & Hers Health, Inc. (US:HIMS) , and Carvana Co. (US:CVNA) .
De største økningene dette kvartalet
Vi bruker endringen i porteføljeallokeringen fordi dette er det mest meningsfulle målet. Endringer kan skyldes handler eller endringer i aksjekursene.
| Verdipapirer | Aksjer (MM) |
Verdi (MM$) |
Portefølje % | ΔPortefølje % |
|---|---|---|---|---|
| 0,11 | 17,50 | 8,0505 | 0,9338 | |
| 0,00 | 2,84 | 1,3055 | 0,8832 | |
| 0,03 | 2,49 | 1,1445 | 0,7085 | |
| 0,06 | 5,71 | 2,6259 | 0,3910 | |
| 0,01 | 4,49 | 2,0659 | 0,3569 | |
| 0,02 | 5,22 | 2,3996 | 0,3485 | |
| 0,02 | 1,77 | 0,8118 | 0,3481 | |
| 0,01 | 2,82 | 1,2964 | 0,3410 | |
| 0,03 | 2,65 | 1,2201 | 0,3276 | |
| 0,00 | 6,28 | 2,8884 | 0,2931 |
De største reduksjonene dette kvartalet
Vi bruker endringen i porteføljeallokeringen fordi dette er det mest meningsfulle målet. Endringer kan skyldes handler eller endringer i aksjekurser.
| Verdipapirer | Aksjer (MM) |
Verdi (MM$) |
Portefølje % | ΔPortefølje % |
|---|---|---|---|---|
| 0,00 | 0,55 | 0,2525 | −1,3934 | |
| 0,02 | 4,88 | 2,2422 | −0,7387 | |
| 0,03 | 5,98 | 2,7503 | −0,6123 | |
| 0,01 | 5,68 | 2,6142 | −0,4592 | |
| 0,03 | 3,18 | 1,4618 | −0,4299 | |
| 0,02 | 5,33 | 2,4496 | −0,3209 | |
| 0,01 | 4,39 | 2,0205 | −0,2914 | |
| 0,00 | 0,01 | 0,0030 | −0,2336 | |
| 0,01 | 4,71 | 2,1680 | −0,2292 | |
| 0,01 | 4,13 | 1,8980 | −0,2273 |
13F- og Fondsarkiveringer
Dette skjemaet ble sendt inn den 2025-07-17 for rapporteringsperioden 2025-06-30. Klikk på lenkeikonet for å se hele transaksjonshistorikken.
Oppgradere for å låse opp premiedata og eksportere til Excel![]() .
.
| Verdipapirer | Type | Gjennomsnittlig aksjekurs | Aksjer (MM) |
ΔAksjer (%) |
ΔAksjer (%) |
Verdi ($MM) |
Portefølje (%) |
ΔPortefølje (%) |
|
|---|---|---|---|---|---|---|---|---|---|
| NVDA / NVIDIA Corporation | 0,11 | −7,01 | 17,50 | 30,93 | 8,0505 | 0,9338 | |||
| MSFT / Microsoft Corporation | 0,02 | −6,20 | 7,89 | 20,96 | 3,6283 | 0,1564 | |||
| CRWD / CrowdStrike Holdings, Inc. | 0,01 | −3,13 | 7,34 | 25,62 | 3,3738 | 0,2646 | |||
| JPM / JPMorgan Chase & Co. | 0,02 | −3,28 | 6,42 | 20,28 | 2,9511 | 0,1112 | |||
| NFLX / Netflix, Inc. | 0,00 | −6,09 | 6,28 | 28,82 | 2,8884 | 0,2931 | |||
| AMZN / Amazon.com, Inc. | 0,03 | −2,16 | 6,25 | 19,52 | 2,8725 | 0,0906 | |||
| AAPL / Apple Inc. | 0,03 | −6,73 | 5,98 | −5,32 | 2,7503 | −0,6123 | |||
| ANET / Arista Networks Inc | 0,06 | −2,70 | 5,71 | 35,99 | 2,6259 | 0,3910 | |||
| COST / Costco Wholesale Corporation | 0,01 | −2,84 | 5,68 | −1,54 | 2,6142 | −0,4592 | |||
| V / Visa Inc. | 0,02 | −3,21 | 5,33 | 2,34 | 2,4496 | −0,3209 | |||
| GOOGL / Alphabet Inc. | 0,03 | −2,76 | 5,32 | 9,63 | 2,4446 | −0,1363 | |||
| PANW / Palo Alto Networks, Inc. | 0,03 | 4,62 | 5,26 | 23,36 | 2,4186 | 0,1493 | |||
| GE / General Electric Company | 0,02 | −2,32 | 5,22 | 35,40 | 2,3996 | 0,3485 | |||
| NOW / ServiceNow, Inc. | 0,01 | −2,36 | 5,19 | 22,93 | 2,3867 | 0,1397 | |||
| TMUS / T-Mobile US, Inc. | 0,02 | −2,54 | 4,88 | −12,93 | 2,2422 | −0,7387 | |||
| MA / Mastercard Incorporated | 0,01 | −3,62 | 4,71 | 4,69 | 2,1680 | −0,2292 | |||
| META / Meta Platforms, Inc. | 0,01 | −1,14 | 4,49 | 39,94 | 2,0659 | 0,3569 | |||
| ISRG / Intuitive Surgical, Inc. | 0,01 | −3,10 | 4,41 | 7,85 | 2,0293 | −0,1488 | |||
| HD / The Home Depot, Inc. | 0,01 | −2,30 | 4,39 | 1,15 | 2,0205 | −0,2914 | |||
| HON / Honeywell International Inc. | 0,02 | −0,19 | 4,29 | 16,91 | 1,9751 | 0,0197 | |||
| SYK / Stryker Corporation | 0,01 | −2,63 | 4,18 | 11,08 | 1,9234 | −0,0809 | |||
| CASY / Casey's General Stores, Inc. | 0,01 | −5,92 | 4,13 | 3,38 | 1,8980 | −0,2273 | |||
| MCK / McKesson Corporation | 0,01 | −2,06 | 4,01 | 3,60 | 1,8421 | −0,2163 | |||
| AMD / Advanced Micro Devices, Inc. | 0,03 | −7,93 | 3,91 | 37,12 | 1,7995 | 0,2804 | |||
| CVX / Chevron Corporation | 0,03 | −2,02 | 3,86 | 4,27 | 1,7750 | −0,1951 | |||
| CRM / Salesforce, Inc. | 0,01 | −2,17 | 3,74 | 4,64 | 1,7204 | −0,1826 | |||
| USB / U.S. Bancorp | 0,08 | −9,67 | 3,44 | 5,81 | 1,5830 | −0,1487 | |||
| CMI / Cummins Inc. | 0,01 | −3,46 | 3,25 | 10,03 | 1,4929 | −0,0776 | |||
| TJX / The TJX Companies, Inc. | 0,03 | 6,37 | 3,19 | 2,21 | 1,4653 | −0,1939 | |||
| CHD / Church & Dwight Co., Inc. | 0,03 | −2,22 | 3,18 | −10,55 | 1,4618 | −0,4299 | |||
| SPGI / S&P Global Inc. | 0,01 | −5,12 | 3,16 | 6,28 | 1,4555 | −0,1296 | |||
| ADBE / Adobe Inc. | 0,01 | −1,94 | 3,11 | 8,28 | 1,4319 | −0,0988 | |||
| CDNS / Cadence Design Systems, Inc. | 0,01 | 3,17 | 2,86 | 20,31 | 1,3131 | 0,0496 | |||
| GS / The Goldman Sachs Group, Inc. | 0,00 | 156,79 | 2,84 | 257,88 | 1,3055 | 0,8832 | |||
| SNOW / Snowflake Inc. | 0,01 | 2,86 | 2,82 | 57,08 | 1,2964 | 0,3410 | |||
| URI / United Rentals, Inc. | 0,00 | −4,56 | 2,66 | 20,44 | 1,2248 | 0,0474 | |||
| MRVL / Marvell Technology, Inc. | 0,03 | 9,00 | 2,65 | 58,29 | 1,2201 | 0,3276 | |||
| HOOD / Robinhood Markets, Inc. | 0,03 | 43,04 | 2,49 | 203,79 | 1,1445 | 0,7085 | |||
| CMG / Chipotle Mexican Grill, Inc. | 0,04 | 0,00 | 2,40 | 15,10 | 1,1042 | −0,0066 | |||
| NEE / NextEra Energy, Inc. | 0,03 | 9,44 | 2,22 | 12,32 | 1,0192 | −0,0314 | |||
| GEV / GE Vernova Inc. | 0,00 | −3,16 | 2,21 | 56,04 | 1,0155 | 0,2619 | |||
| CAT / Caterpillar Inc. | 0,01 | −1,63 | 2,17 | 30,10 | 1,0002 | 0,1106 | |||
| FTNT / Fortinet, Inc. | 0,02 | −0,51 | 1,89 | 6,01 | 0,8681 | −0,0795 | |||
| BSX / Boston Scientific Corporation | 0,02 | 77,77 | 1,77 | 102,64 | 0,8118 | 0,3481 | |||
| PSA / Public Storage | 0,01 | −2,32 | 1,74 | −0,80 | 0,8003 | −0,1335 | |||
| GEHC / GE HealthCare Technologies Inc. | 0,02 | 1,75 | 1,68 | 19,44 | 0,7715 | 0,0239 | |||
| TSM / Taiwan Semiconductor Manufacturing Company Limited - Depositary Receipt (Common Stock) | 0,01 | −0,35 | 1,60 | 43,40 | 0,7343 | 0,1418 | |||
| WM / Waste Management, Inc. | 0,01 | 2,41 | 1,43 | 1,20 | 0,6575 | −0,0943 | |||
| ORLY / O'Reilly Automotive, Inc. | 0,01 | 1 400,00 | 1,25 | −3,32 | 0,5770 | −0,1136 | |||
| Cooper Companies / (216648402) | 0,02 | 1,13 | 0,0000 | ||||||
| WMT / Walmart Inc. | 0,01 | 63,63 | 0,99 | 70,33 | 0,4571 | 0,1464 | |||
| APP / AppLovin Corporation | 0,00 | 4,92 | 0,95 | 49,76 | 0,4361 | 0,0988 | |||
| MCD / McDonald's Corporation | 0,00 | 0,00 | 0,94 | −6,45 | 0,4337 | −0,1032 | |||
| AVGO / Broadcom Inc. | 0,00 | −2,16 | 0,94 | 50,81 | 0,4301 | 0,0998 | |||
| GOOGL / Alphabet Inc. | 0,01 | −3,10 | 0,92 | 8,41 | 0,4209 | −0,0288 | |||
| SNPS / Synopsys, Inc. | 0,00 | −0,29 | 0,87 | 20,11 | 0,3985 | 0,0144 | |||
| AMAT / Applied Materials, Inc. | 0,00 | 11,91 | 0,79 | 41,00 | 0,3640 | 0,0649 | |||
| SHOP / Shopify Inc. | 0,01 | −4,33 | 0,79 | 31,50 | 0,3631 | 0,0435 | |||
| LRCX / Lam Research Corporation | 0,01 | 0,72 | 0,0000 | ||||||
| ORCL / Oracle Corporation | 0,00 | −1,51 | 0,57 | 60,56 | 0,2625 | 0,0735 | |||
| TMO / Thermo Fisher Scientific Inc. | 0,00 | −80,69 | 0,55 | −82,27 | 0,2525 | −1,3934 | |||
| IDXX / IDEXX Laboratories, Inc. | 0,00 | −8,19 | 0,52 | 21,93 | 0,2378 | 0,0120 | |||
| AMT / American Tower Corporation | 0,00 | 0,00 | 0,47 | 1,30 | 0,2156 | −0,0306 | |||
| RDDT / Reddit, Inc. | 0,00 | 14,35 | 0,37 | 78,37 | 0,1710 | 0,0601 | |||
| AZO / AutoZone, Inc. | 0,00 | −4,55 | 0,31 | −2,51 | 0,1434 | −0,0267 | |||
| EW / Edwards Lifesciences Corporation | 0,00 | −30,83 | 0,26 | −23,67 | 0,1191 | −0,0612 | |||
| TSCO / Tractor Supply Company | 0,00 | −17,50 | 0,24 | −14,55 | 0,1081 | −0,0385 | |||
| ARHS / Arhaus, Inc. | 0,03 | 0,00 | 0,23 | 14,71 | 0,1079 | −0,0010 | |||
| ABT / Abbott Laboratories | 0,00 | 0,00 | 0,23 | 7,94 | 0,1063 | −0,0079 | |||
| STE / STERIS plc | 0,00 | 0,00 | 0,22 | 8,82 | 0,1022 | −0,0066 | |||
| CMCSA / Comcast Corporation | 0,01 | −61,26 | 0,20 | −59,80 | 0,0925 | −0,1739 | |||
| RTX / RTX Corporation | 0,00 | 0,20 | 0,0920 | 0,0920 | |||||
| MS / Morgan Stanley | 0,00 | 0,20 | 0,0897 | 0,0897 | |||||
| DE / Deere & Company | 0,00 | 0,17 | 0,0790 | 0,0790 | |||||
| VRT / Vertiv Holdings Co | 0,00 | 0,17 | 0,0772 | 0,0772 | |||||
| XYZ / Block, Inc. | 0,00 | 0,16 | 0,0740 | 0,0740 | |||||
| SRE / Sempra | 0,00 | 0,16 | 0,0720 | 0,0720 | |||||
| ESTC / Elastic N.V. | 0,00 | 0,11 | 0,0508 | 0,0508 | |||||
| LLY / Eli Lilly and Company | 0,00 | 0,09 | 0,0394 | 0,0394 | |||||
| PEP / PepsiCo, Inc. | 0,00 | 0,08 | 0,0382 | 0,0382 | |||||
| ANSS / ANSYS, Inc. | 0,00 | 0,07 | 0,0342 | 0,0342 | |||||
| FND / Floor & Decor Holdings, Inc. | 0,00 | 0,07 | 0,0336 | 0,0336 | |||||
| ONON / On Holding AG | 0,00 | 0,07 | 0,0336 | 0,0336 | |||||
| SCHW / The Charles Schwab Corporation | 0,00 | 0,05 | 0,0243 | 0,0243 | |||||
| GPC / Genuine Parts Company | 0,00 | 0,05 | 0,0230 | 0,0230 | |||||
| MUSA / Murphy USA Inc. | 0,00 | 0,05 | 0,0226 | 0,0226 | |||||
| ODD / Oddity Tech Ltd. | 0,00 | 0,05 | 0,0220 | 0,0220 | |||||
| HIMS / Hims & Hers Health, Inc. | 0,00 | 0,02 | 0,0097 | 0,0097 | |||||
| CVNA / Carvana Co. | 0,00 | 0,02 | 0,0091 | 0,0091 | |||||
| RIVN / Rivian Automotive, Inc. | 0,00 | 0,02 | 0,0090 | 0,0090 | |||||
| WING / Wingstop Inc. | 0,00 | 0,02 | 0,0081 | 0,0081 | |||||
| MDT / Medtronic plc | 0,00 | 0,01 | 0,0046 | 0,0046 | |||||
| SG / Sweetgreen, Inc. | 0,00 | 0,01 | 0,0039 | 0,0039 | |||||
| COHR / Coherent Corp. | 0,00 | 0,01 | 0,0037 | 0,0037 | |||||
| ALGN / Align Technology, Inc. | 0,00 | 0,01 | 0,0031 | 0,0031 | |||||
| STZ / Constellation Brands, Inc. | 0,00 | −98,35 | 0,01 | −98,65 | 0,0030 | −0,2336 | |||
| UNP / Union Pacific Corporation | 0,00 | −100,00 | 0,00 | 0,0000 |