Grunnleggende statistikk
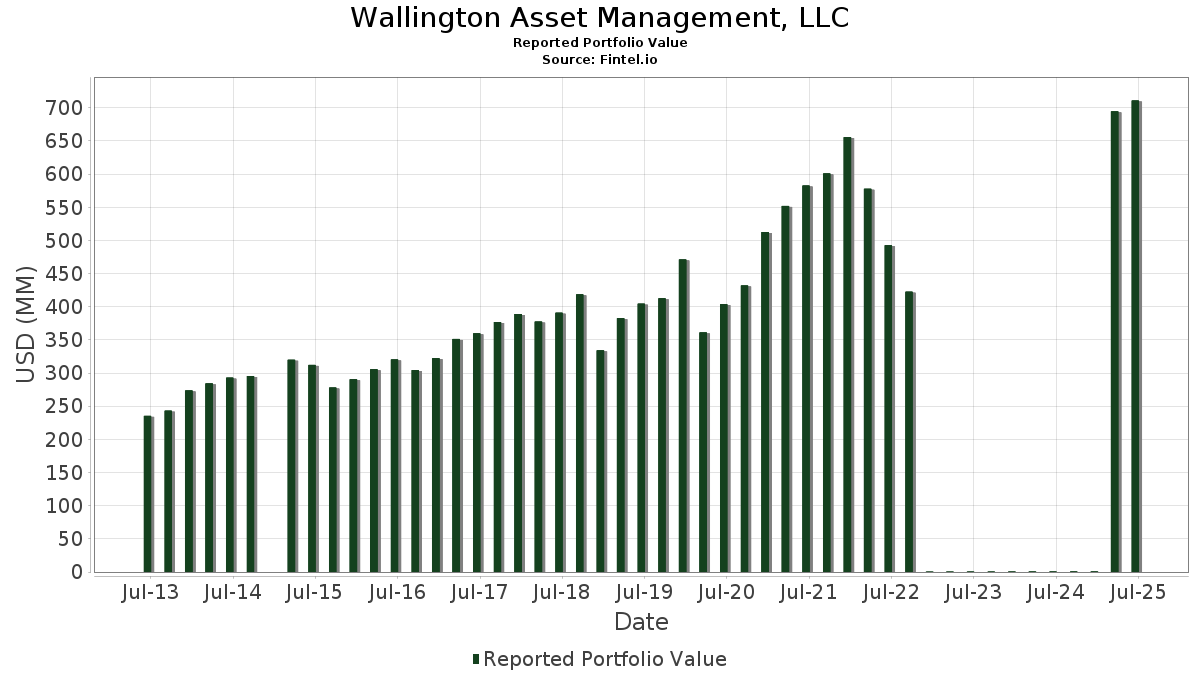
| Porteføljeverdi | $ 710 826 331 |
| Nåværende posisjoner | 71 |
Siste beholdninger, prestasjoner, forvaltet kapital (fra 13F, 13D)
Wallington Asset Management, LLC har oppgitt 71 totale beholdninger i sine siste SEC-arkiveringer. Siste porteføljeverdi er beregnet til 710 826 331 USD. Faktisk forvaltet kapital (AUM) er denne verdien pluss kontanter (som ikke er oppgitt). Wallington Asset Management, LLCs største beholdninger er Vanguard Tax-Managed Funds - Vanguard FTSE Developed Markets ETF (US:VEA) , Microsoft Corporation (US:MSFT) , Linde plc (US:LIN) , iShares Trust - iShares Core S&P Small-Cap ETF (US:IJR) , and W. R. Berkley Corporation (US:WRB) . Wallington Asset Management, LLCs nye posisjoner inkluderer iShares, Inc. - iShares MSCI Eurozone ETF (US:EZU) , Philip Morris International Inc. (US:PM) , .
De største økningene dette kvartalet
Vi bruker endringen i porteføljeallokeringen fordi dette er det mest meningsfulle målet. Endringer kan skyldes handler eller endringer i aksjekursene.
| Verdipapirer | Aksjer (MM) |
Verdi (MM$) |
Portefølje % | ΔPortefølje % |
|---|---|---|---|---|
| 1,26 | 71,79 | 10,0989 | 3,2643 | |
| 0,23 | 13,79 | 1,9402 | 1,9402 | |
| 0,14 | 9,97 | 1,4032 | 1,4032 | |
| 0,09 | 42,44 | 5,9709 | 1,3876 | |
| 0,16 | 7,91 | 1,1125 | 1,1125 | |
| 0,03 | 25,03 | 3,5213 | 0,7733 | |
| 0,03 | 21,17 | 2,9784 | 0,6398 | |
| 0,08 | 17,30 | 2,4337 | 0,4086 | |
| 0,09 | 20,82 | 2,9292 | 0,3759 | |
| 0,09 | 20,22 | 2,8453 | 0,2484 |
De største reduksjonene dette kvartalet
Vi bruker endringen i porteføljeallokeringen fordi dette er det mest meningsfulle målet. Endringer kan skyldes handler eller endringer i aksjekurser.
| Verdipapirer | Aksjer (MM) |
Verdi (MM$) |
Portefølje % | ΔPortefølje % |
|---|---|---|---|---|
| 0,22 | 27,68 | 3,8940 | −0,8963 | |
| 0,07 | 24,20 | 3,4040 | −0,7589 | |
| 0,13 | 7,90 | 1,1109 | −0,6961 | |
| 0,13 | 27,19 | 3,8251 | −0,3976 | |
| 0,04 | 11,83 | 1,6647 | −0,2182 | |
| 0,10 | 10,36 | 1,4578 | −0,1975 | |
| 0,09 | 13,75 | 1,9341 | −0,1915 | |
| 0,26 | 7,68 | 1,0802 | −0,1567 | |
| 0,05 | 14,48 | 2,0370 | −0,1482 | |
| 0,13 | 15,96 | 2,2455 | −0,1323 |
13F- og Fondsarkiveringer
Dette skjemaet ble sendt inn den 2025-07-21 for rapporteringsperioden 2025-06-30. Klikk på lenkeikonet for å se hele transaksjonshistorikken.
Oppgradere for å låse opp premiedata og eksportere til Excel![]() .
.
| Verdipapirer | Type | Gjennomsnittlig aksjekurs | Aksjer (MM) |
ΔAksjer (%) |
ΔAksjer (%) |
Verdi ($MM) |
Portefølje (%) |
ΔPortefølje (%) |
|
|---|---|---|---|---|---|---|---|---|---|
| VEA / Vanguard Tax-Managed Funds - Vanguard FTSE Developed Markets ETF | 1,26 | 34,84 | 71,79 | 51,24 | 10,0989 | 3,2643 | |||
| MSFT / Microsoft Corporation | 0,09 | 0,63 | 42,44 | 33,34 | 5,9709 | 1,3876 | |||
| LIN / Linde plc | 0,07 | 1,38 | 34,24 | 2,15 | 4,8174 | −0,0094 | |||
| IJR / iShares Trust - iShares Core S&P Small-Cap ETF | 0,27 | 1,00 | 29,94 | 5,55 | 4,2117 | 0,1277 | |||
| WRB / W. R. Berkley Corporation | 0,41 | 1,00 | 29,89 | 4,27 | 4,2045 | 0,0775 | |||
| TJX / The TJX Companies, Inc. | 0,22 | −17,94 | 27,68 | −16,80 | 3,8940 | −0,8963 | |||
| AAPL / Apple Inc. | 0,13 | 0,38 | 27,19 | −7,28 | 3,8251 | −0,3976 | |||
| META / Meta Platforms, Inc. | 0,03 | 2,42 | 25,03 | 31,16 | 3,5213 | 0,7733 | |||
| V / Visa Inc. | 0,07 | −17,39 | 24,20 | −16,31 | 3,4040 | −0,7589 | |||
| GSCE / GS Connect S&P GSCI Enhanced Commodity Total Return ETN | 0,03 | 0,62 | 21,17 | 30,35 | 2,9784 | 0,6398 | |||
| AMZN / Amazon.com, Inc. | 0,09 | 1,83 | 20,82 | 17,42 | 2,9292 | 0,3759 | |||
| HON / Honeywell International Inc. | 0,09 | 1,97 | 20,22 | 12,14 | 2,8453 | 0,2484 | |||
| UNP / Union Pacific Corporation | 0,08 | 0,27 | 18,23 | −2,35 | 2,5644 | −0,1234 | |||
| MDT / Medtronic plc | 0,20 | 1,57 | 17,43 | −1,47 | 2,4520 | −0,0951 | |||
| PANW / Palo Alto Networks, Inc. | 0,08 | 2,57 | 17,30 | 23,01 | 2,4337 | 0,4086 | |||
| IAU / iShares Gold Trust | 0,28 | 0,02 | 17,24 | 5,79 | 2,4255 | 0,0788 | |||
| PSX / Phillips 66 | 0,13 | 0,04 | 15,96 | −3,34 | 2,2455 | −0,1323 | |||
| AMT / American Tower Corporation | 0,07 | 1,21 | 15,89 | 2,81 | 2,2360 | 0,0098 | |||
| GOOG / Alphabet Inc. | 0,09 | 0,58 | 15,14 | 14,20 | 2,1301 | 0,2210 | |||
| GLD / SPDR Gold Trust | 0,05 | −9,81 | 14,48 | −4,59 | 2,0370 | −0,1482 | |||
| AVUV / American Century ETF Trust - Avantis U.S. Small Cap Value ETF | 0,15 | 1,17 | 14,01 | 5,73 | 1,9715 | 0,0630 | |||
| EZU / iShares, Inc. - iShares MSCI Eurozone ETF | 0,23 | 13,79 | 1,9402 | 1,9402 | |||||
| JNJ / Johnson & Johnson | 0,09 | 1,11 | 13,75 | −6,86 | 1,9341 | −0,1915 | |||
| DE / Deere & Company | 0,03 | 1,25 | 13,58 | 9,70 | 1,9110 | 0,1280 | |||
| AMGN / Amgen Inc. | 0,04 | 0,97 | 11,83 | −9,51 | 1,6647 | −0,2182 | |||
| CMI / Cummins Inc. | 0,03 | 1,08 | 11,37 | 5,61 | 1,5997 | 0,0494 | |||
| XOM / Exxon Mobil Corporation | 0,10 | −0,55 | 10,36 | −9,86 | 1,4578 | −0,1975 | |||
| CSCO / Cisco Systems, Inc. | 0,14 | 9,97 | 1,4032 | 1,4032 | |||||
| LOW / Lowe's Companies, Inc. | 0,04 | 0,73 | 9,87 | −4,18 | 1,3889 | −0,0947 | |||
| BAC / Bank of America Corporation | 0,18 | 0,86 | 8,62 | 14,38 | 1,2127 | 0,1275 | |||
| VWO / Vanguard International Equity Index Funds - Vanguard FTSE Emerging Markets ETF | 0,16 | 7,91 | 1,1125 | 1,1125 | |||||
| EMXC / iShares, Inc. - iShares MSCI Emerging Markets ex China ETF | 0,13 | −45,10 | 7,90 | −37,08 | 1,1109 | −0,6961 | |||
| BP / BP p.l.c. - Depositary Receipt (Common Stock) | 0,26 | 0,91 | 7,68 | −10,62 | 1,0802 | −0,1567 | |||
| CL / Colgate-Palmolive Company | 0,07 | 0,25 | 6,52 | −2,75 | 0,9166 | −0,0480 | |||
| DIS / The Walt Disney Company | 0,05 | 2,55 | 6,27 | 28,83 | 0,8815 | 0,1812 | |||
| AFL / Aflac Incorporated | 0,06 | −0,01 | 6,25 | −5,16 | 0,8790 | −0,0697 | |||
| HD / The Home Depot, Inc. | 0,02 | 0,95 | 6,08 | 0,98 | 0,8548 | −0,0115 | |||
| MU / Micron Technology, Inc. | 0,04 | 1,46 | 5,20 | 43,90 | 0,7319 | 0,2114 | |||
| PEP / PepsiCo, Inc. | 0,04 | −0,08 | 4,66 | −12,01 | 0,6554 | −0,1070 | |||
| KVUE / Kenvue Inc. | 0,19 | −0,08 | 4,00 | −12,78 | 0,5626 | −0,0976 | |||
| NVDA / NVIDIA Corporation | 0,02 | −12,28 | 3,56 | 27,88 | 0,5001 | 0,0998 | |||
| SPY / SPDR S&P 500 ETF | 0,01 | 8,44 | 3,49 | 19,76 | 0,4904 | 0,0713 | |||
| LLY / Eli Lilly and Company | 0,00 | −10,95 | 3,00 | −15,98 | 0,4217 | −0,0919 | |||
| RHHBY / Roche Holding AG - Depositary Receipt (Common Stock) | 0,05 | 0,00 | 1,84 | −0,97 | 0,2589 | −0,0086 | |||
| JPM / JPMorgan Chase & Co. | 0,00 | 1,30 | 1,45 | 19,72 | 0,2034 | 0,0295 | |||
| BA / The Boeing Company | 0,00 | 0,06 | 1,03 | 22,99 | 0,1445 | 0,0242 | |||
| AVGO / Broadcom Inc. | 0,00 | 3,00 | 0,97 | 69,60 | 0,1359 | 0,0539 | |||
| BRK.B / Berkshire Hathaway Inc. | 0,00 | 2,14 | 0,93 | −6,83 | 0,1305 | −0,0129 | |||
| IVW / iShares Trust - iShares S&P 500 Growth ETF | 0,01 | 0,00 | 0,83 | 18,60 | 0,1167 | 0,0160 | |||
| SPYG / SPDR Series Trust - SPDR Portfolio S&P 500 Growth ETF | 0,01 | −9,00 | 0,72 | 7,92 | 0,1016 | 0,0052 | |||
| SPYV / SPDR Series Trust - SPDR Portfolio S&P 500 Value ETF | 0,01 | −7,63 | 0,70 | −5,38 | 0,0990 | −0,0080 | |||
| GOOGL / Alphabet Inc. | 0,00 | 3,83 | 0,58 | 18,24 | 0,0813 | 0,0110 | |||
| VCSH / Vanguard Scottsdale Funds - Vanguard Short-Term Corporate Bond ETF | 0,01 | 1,83 | 0,58 | 2,49 | 0,0811 | 0,0002 | |||
| NFLX / Netflix, Inc. | 0,00 | 3,61 | 0,42 | 48,94 | 0,0595 | 0,0186 | |||
| CNQ / Canadian Natural Resources Limited | 0,01 | −4,80 | 0,39 | −2,99 | 0,0548 | −0,0030 | |||
| XLV / The Select Sector SPDR Trust - The Health Care Select Sector SPDR Fund | 0,00 | −4,28 | 0,36 | −11,74 | 0,0509 | −0,0081 | |||
| TSLA / Tesla, Inc. | 0,00 | 5,98 | 0,36 | 29,96 | 0,0507 | 0,0107 | |||
| KO / The Coca-Cola Company | 0,00 | 1,15 | 0,34 | −0,30 | 0,0472 | −0,0011 | |||
| KKR / KKR & Co. Inc. | 0,00 | 0,00 | 0,33 | 14,88 | 0,0468 | 0,0052 | |||
| MKC / McCormick & Company, Incorporated | 0,00 | 0,00 | 0,31 | −7,94 | 0,0441 | −0,0049 | |||
| ORCL / Oracle Corporation | 0,00 | 0,30 | 0,0416 | 0,0416 | |||||
| WMT / Walmart Inc. | 0,00 | 3,82 | 0,29 | 15,87 | 0,0411 | 0,0047 | |||
| MA / Mastercard Incorporated | 0,00 | 4,26 | 0,27 | 6,61 | 0,0387 | 0,0016 | |||
| ABBV / AbbVie Inc. | 0,00 | 3,00 | 0,27 | −8,87 | 0,0377 | −0,0046 | |||
| AXP / American Express Company | 0,00 | 2,37 | 0,26 | 21,30 | 0,0369 | 0,0058 | |||
| PG / The Procter & Gamble Company | 0,00 | 3,97 | 0,26 | −3,01 | 0,0364 | −0,0019 | |||
| IEX / IDEX Corporation | 0,00 | 0,00 | 0,25 | −3,16 | 0,0346 | −0,0019 | |||
| CQP / Cheniere Energy Partners, L.P. - Limited Partnership | 0,00 | 0,00 | 0,23 | −15,27 | 0,0328 | −0,0068 | |||
| DKS / DICK'S Sporting Goods, Inc. | 0,00 | −12,50 | 0,21 | −14,11 | 0,0292 | −0,0056 | |||
| PM / Philip Morris International Inc. | 0,00 | 0,21 | 0,0292 | 0,0292 | |||||
| XLK / The Select Sector SPDR Trust - The Technology Select Sector SPDR Fund | 0,00 | 0,20 | 0,0287 | 0,0287 | |||||
| JPMorgan Equity Income Fund I / ETF (4812C0498) | 0,00 | −100,00 | 0,00 | 0,0000 | |||||
| FCNTX / Fidelity Contrafund - Fidelity Contra Fund | 0,00 | −100,00 | 0,00 | 0,0000 | |||||
| FSEN / FS Energy and Power Fund | 0,00 | −100,00 | 0,00 | 0,0000 | |||||
| US00143M3319 / Invesco Comstock Fund, Class R6 | 0,00 | −100,00 | 0,00 | 0,0000 | |||||
| VINIX / Vanguard Institutional Index Funds - Vanguard Institutional Index Institutional Class | 0,00 | −100,00 | 0,00 | 0,0000 | |||||
| US9219098186 / Vanguard Total International Stock Market Index Fund Admiral Shares | 0,00 | −100,00 | 0,00 | 0,0000 | |||||
| VSMAX / Vanguard Index Funds - Vanguard Small Cap Index Fund Admiral | 0,00 | −100,00 | 0,00 | 0,0000 | |||||
| US7795463089 / TRP-DVD GROW-I | 0,00 | −100,00 | 0,00 | 0,0000 | |||||
| American Funds Europacific Gro / ETF (298706409) | 0,00 | −100,00 | 0,00 | 0,0000 | |||||
| US9229087104 / VANGUARD 500 INDEX FUND VANGUARD 500 INDEX ADM | 0,00 | −100,00 | 0,00 | 0,0000 | |||||
| US9220314069 / Vanguard Short-Term Investment Grade Fund | 0,00 | −100,00 | 0,00 | 0,0000 | |||||
| Invesco V.I. Comstock Fund VIT / ETF (00888X773) | 0,00 | −100,00 | 0,00 | 0,0000 | |||||
| JDMNX / Janus Investment Fund - Janus Henderson Enterprise Fund Class N | 0,00 | −100,00 | 0,00 | 0,0000 | |||||
| RPIBX / T Rowe Price International Funds Inc - T. Rowe Price International Bond Fund Investor Class | 0,00 | −100,00 | 0,00 | 0,0000 | |||||
| US46636U8760 / JPMorgan Equity Income Fund, Class R6 | 0,00 | −100,00 | 0,00 | 0,0000 | |||||
| Vanguard Short-Term Corporate / ETF (921925863) | 0,00 | −100,00 | 0,00 | 0,0000 | |||||
| Principal Large-Cap Growth Fun / ETF (74253J784) | 0,00 | −100,00 | 0,00 | 0,0000 | |||||
| SWPPX / Schwab Capital Trust - Schwab S&P 500 Index Fund | 0,00 | −100,00 | 0,00 | 0,0000 | |||||
| US2779072006 / EATON VANCE INC FD BOSTN- | 0,00 | −100,00 | 0,00 | 0,0000 | |||||
| Janus Henderson VIT Enterprise / ETF (471021204) | 0,00 | −100,00 | 0,00 | 0,0000 | |||||
| Invesco Developing Markets Fun / ETF (00143W875) | 0,00 | −100,00 | 0,00 | 0,0000 | |||||
| US77957Q3011 / T Rowe Price Small-Cap Value Fund Inc | 0,00 | −100,00 | 0,00 | 0,0000 | |||||
| US9220318367 / VANG-ST IN G-ADM | 0,00 | −100,00 | 0,00 | 0,0000 | |||||
| PRSVX / T. Rowe Price Group Inc - Small Cap Value Fund Investor Class | 0,00 | −100,00 | 0,00 | 0,0000 | |||||
| UNH / UnitedHealth Group Incorporated | 0,00 | −100,00 | 0,00 | 0,0000 | |||||
| MRK / Merck & Co., Inc. | 0,00 | −100,00 | 0,00 | 0,0000 | |||||
| iShares S&P 500 Index Fund K / ETF (066922204) | 0,00 | −100,00 | 0,00 | 0,0000 | |||||
| T. Rowe Price Blue Chip Growth / ETF (77954T878) | 0,00 | −100,00 | 0,00 | 0,0000 |