Grunnleggende statistikk
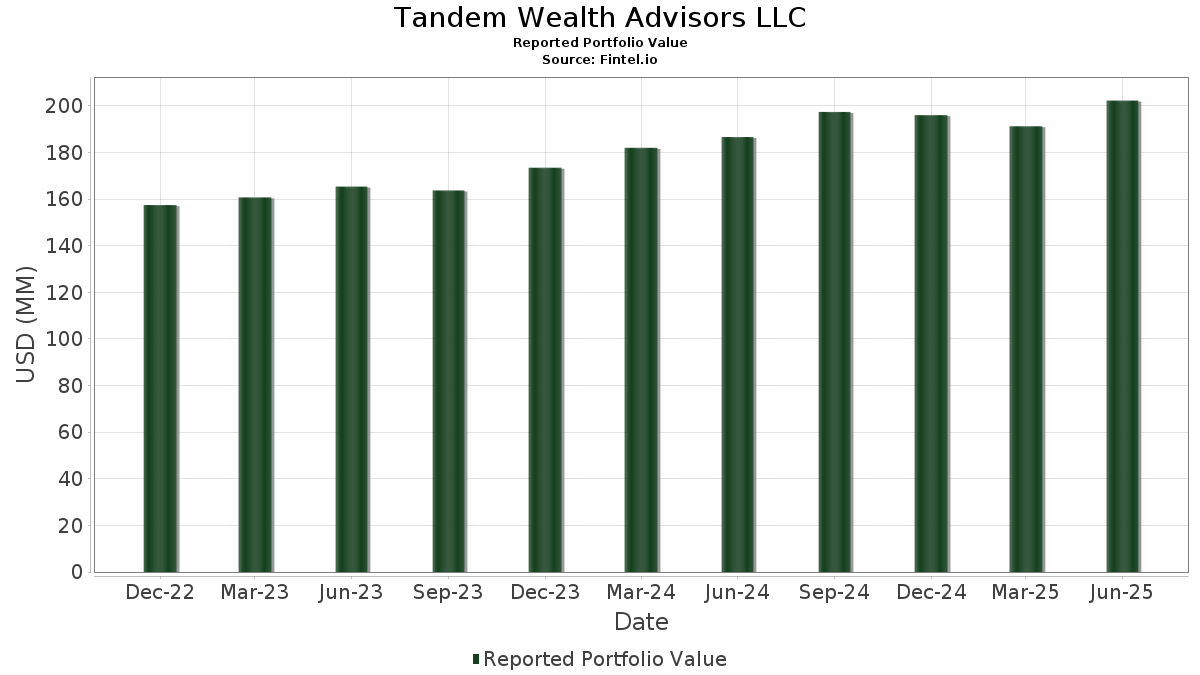
| Porteføljeverdi | $ 202 226 741 |
| Nåværende posisjoner | 49 |
Siste beholdninger, prestasjoner, forvaltet kapital (fra 13F, 13D)
Tandem Wealth Advisors LLC har oppgitt 49 totale beholdninger i sine siste SEC-arkiveringer. Siste porteføljeverdi er beregnet til 202 226 741 USD. Faktisk forvaltet kapital (AUM) er denne verdien pluss kontanter (som ikke er oppgitt). Tandem Wealth Advisors LLCs største beholdninger er iShares Trust - iShares Core U.S. Aggregate Bond ETF (US:AGG) , iShares Trust - iShares MSCI EAFE ETF (US:EFA) , SPDR S&P MidCap 400 ETF Trust (US:MDY) , SPDR S&P 500 ETF (US:SPY) , and iShares Trust - iShares Core Dividend Growth ETF (US:DGRO) . Tandem Wealth Advisors LLCs nye posisjoner inkluderer The Goldman Sachs Group, Inc. (US:GS) , .
De største økningene dette kvartalet
Vi bruker endringen i porteføljeallokeringen fordi dette er det mest meningsfulle målet. Endringer kan skyldes handler eller endringer i aksjekursene.
| Verdipapirer | Aksjer (MM) |
Verdi (MM$) |
Portefølje % | ΔPortefølje % |
|---|---|---|---|---|
| 0,27 | 23,72 | 11,7316 | 3,6049 | |
| 0,01 | 9,00 | 4,4481 | 3,1010 | |
| 0,03 | 5,02 | 2,4846 | 2,4846 | |
| 0,03 | 16,83 | 8,3219 | 1,5860 | |
| 0,24 | 15,27 | 7,5506 | 1,1147 | |
| 0,07 | 13,06 | 6,4583 | 0,9496 | |
| 0,03 | 18,03 | 8,9158 | 0,7572 | |
| 0,18 | 6,08 | 3,0075 | 0,6983 | |
| 0,00 | 1,00 | 0,4934 | 0,3005 | |
| 0,00 | 0,79 | 0,3912 | 0,2059 |
De største reduksjonene dette kvartalet
Vi bruker endringen i porteføljeallokeringen fordi dette er det mest meningsfulle målet. Endringer kan skyldes handler eller endringer i aksjekurser.
| Verdipapirer | Aksjer (MM) |
Verdi (MM$) |
Portefølje % | ΔPortefølje % |
|---|---|---|---|---|
| 0,37 | 37,13 | 18,3601 | −2,1068 | |
| 0,15 | 13,68 | 6,7628 | −0,7933 | |
| 0,16 | 12,81 | 6,3356 | −0,7361 | |
| 0,00 | 0,28 | 0,1407 | −0,1425 | |
| 0,00 | 0,74 | 0,3670 | −0,0581 | |
| 0,00 | 0,37 | 0,1835 | −0,0433 | |
| 0,00 | 0,27 | 0,1340 | −0,0395 | |
| 0,04 | 2,80 | 1,3856 | −0,0362 | |
| 0,01 | 4,17 | 2,0597 | −0,0313 | |
| 0,01 | 1,27 | 0,6286 | −0,0313 |
13F- og Fondsarkiveringer
Dette skjemaet ble sendt inn den 2025-08-14 for rapporteringsperioden 2025-06-30. Klikk på lenkeikonet for å se hele transaksjonshistorikken.
Oppgradere for å låse opp premiedata og eksportere til Excel![]() .
.
| Verdipapirer | Type | Gjennomsnittlig aksjekurs | Aksjer (MM) |
ΔAksjer (%) |
ΔAksjer (%) |
Verdi ($MM) |
Portefølje (%) |
ΔPortefølje (%) |
|
|---|---|---|---|---|---|---|---|---|---|
| AGG / iShares Trust - iShares Core U.S. Aggregate Bond ETF | 0,37 | −5,42 | 37,13 | −5,12 | 18,3601 | −2,1068 | |||
| EFA / iShares Trust - iShares MSCI EAFE ETF | 0,27 | 39,75 | 23,72 | 52,68 | 11,7316 | 3,6049 | |||
| MDY / SPDR S&P MidCap 400 ETF Trust | 0,03 | 8,81 | 18,03 | 15,58 | 8,9158 | 0,7572 | |||
| SPY / SPDR S&P 500 ETF | 0,03 | 18,16 | 16,83 | 30,67 | 8,3219 | 1,5860 | |||
| DGRO / iShares Trust - iShares Core Dividend Growth ETF | 0,24 | 19,67 | 15,27 | 24,09 | 7,5506 | 1,1147 | |||
| MBB / iShares Trust - iShares MBS ETF | 0,15 | −5,47 | 13,68 | −5,34 | 6,7628 | −0,7933 | |||
| RSP / Invesco Exchange-Traded Fund Trust - Invesco S&P 500 Equal Weight ETF | 0,07 | 18,02 | 13,06 | 24,00 | 6,4583 | 0,9496 | |||
| VCSH / Vanguard Scottsdale Funds - Vanguard Short-Term Corporate Bond ETF | 0,16 | −5,91 | 12,81 | −5,24 | 6,3356 | −0,7361 | |||
| VGT / Vanguard World Fund - Vanguard Information Technology ETF | 0,01 | 185,70 | 9,00 | 249,32 | 4,4481 | 3,1010 | |||
| AMID / EA Series Trust - Argent Mid Cap ETF | 0,18 | 30,31 | 6,08 | 37,73 | 3,0075 | 0,6983 | |||
| VPU / Vanguard World Fund - Vanguard Utilities ETF | 0,03 | 5,02 | 2,4846 | 2,4846 | |||||
| VTI / Vanguard Index Funds - Vanguard Total Stock Market ETF | 0,01 | −5,79 | 4,17 | 4,18 | 2,0597 | −0,0313 | |||
| VFH / Vanguard World Fund - Vanguard Financials ETF | 0,03 | 2,99 | 3,32 | 9,98 | 1,6398 | 0,0629 | |||
| BND / Vanguard Bond Index Funds - Vanguard Total Bond Market ETF | 0,04 | 2,82 | 2,80 | 3,05 | 1,3856 | −0,0362 | |||
| MSFT / Microsoft Corporation | 0,00 | 10,04 | 1,47 | 45,79 | 0,7276 | 0,1998 | |||
| AMZN / Amazon.com, Inc. | 0,01 | 17,97 | 1,29 | 36,08 | 0,6382 | 0,1420 | |||
| AAPL / Apple Inc. | 0,01 | 9,08 | 1,27 | 0,79 | 0,6286 | −0,0313 | |||
| META / Meta Platforms, Inc. | 0,00 | 3,40 | 1,15 | 32,37 | 0,5665 | 0,1140 | |||
| NVDA / NVIDIA Corporation | 0,01 | 19,41 | 1,05 | 74,01 | 0,5200 | 0,2040 | |||
| AVGO / Broadcom Inc. | 0,00 | 64,32 | 1,00 | 170,92 | 0,4934 | 0,3005 | |||
| GOOGL / Alphabet Inc. | 0,01 | 21,63 | 0,99 | 38,68 | 0,4876 | 0,1155 | |||
| KLAC / KLA Corporation | 0,00 | 1,56 | 0,93 | 33,81 | 0,4620 | 0,0968 | |||
| COST / Costco Wholesale Corporation | 0,00 | 23,59 | 0,93 | 29,40 | 0,4616 | 0,0842 | |||
| ETN / Eaton Corporation plc | 0,00 | 70,07 | 0,79 | 123,45 | 0,3912 | 0,2059 | |||
| LLY / Eli Lilly and Company | 0,00 | −3,25 | 0,74 | −8,62 | 0,3670 | −0,0581 | |||
| ICE / Intercontinental Exchange, Inc. | 0,00 | −5,79 | 0,68 | 0,15 | 0,3350 | −0,0186 | |||
| JPM / JPMorgan Chase & Co. | 0,00 | 5,93 | 0,65 | 25,38 | 0,3224 | 0,0500 | |||
| XLE / The Select Sector SPDR Trust - The Energy Select Sector SPDR Fund | 0,01 | 5,73 | 0,60 | −4,01 | 0,2957 | −0,0303 | |||
| PNC / The PNC Financial Services Group, Inc. | 0,00 | 0,00 | 0,56 | 6,04 | 0,2782 | 0,0008 | |||
| BAC / Bank of America Corporation | 0,01 | 16,73 | 0,54 | 32,52 | 0,2681 | 0,0539 | |||
| PANW / Palo Alto Networks, Inc. | 0,00 | 84,33 | 0,46 | 121,05 | 0,2285 | 0,1192 | |||
| LIN / Linde plc | 0,00 | −5,36 | 0,45 | −4,49 | 0,2211 | −0,0241 | |||
| XLU / The Select Sector SPDR Trust - The Utilities Select Sector SPDR Fund | 0,01 | −0,70 | 0,44 | 2,79 | 0,2189 | −0,0062 | |||
| CAT / Caterpillar Inc. | 0,00 | 27,16 | 0,43 | 49,65 | 0,2121 | 0,0622 | |||
| PH / Parker-Hannifin Corporation | 0,00 | 8,01 | 0,42 | 24,05 | 0,2097 | 0,0310 | |||
| CB / Chubb Limited | 0,00 | −10,79 | 0,37 | −14,32 | 0,1835 | −0,0433 | |||
| XLRE / The Select Sector SPDR Trust - The Real Estate Select Sector SPDR Fund | 0,01 | 0,53 | 0,37 | −0,54 | 0,1834 | −0,0116 | |||
| V / Visa Inc. | 0,00 | −6,24 | 0,37 | −4,91 | 0,1821 | −0,0207 | |||
| SHW / The Sherwin-Williams Company | 0,00 | 1,65 | 0,36 | 0,00 | 0,1778 | −0,0103 | |||
| BX / Blackstone Inc. | 0,00 | 30,59 | 0,35 | 39,84 | 0,1737 | 0,0422 | |||
| PG / The Procter & Gamble Company | 0,00 | −2,21 | 0,35 | −8,47 | 0,1712 | −0,0269 | |||
| TJX / The TJX Companies, Inc. | 0,00 | −7,54 | 0,33 | −6,20 | 0,1648 | −0,0211 | |||
| TMO / Thermo Fisher Scientific Inc. | 0,00 | 22,76 | 0,32 | 0,32 | 0,1568 | −0,0090 | |||
| HD / The Home Depot, Inc. | 0,00 | 10,67 | 0,32 | 10,53 | 0,1561 | 0,0070 | |||
| GS / The Goldman Sachs Group, Inc. | 0,00 | 0,29 | 0,1438 | 0,1438 | |||||
| UNH / UnitedHealth Group Incorporated | 0,00 | −11,80 | 0,28 | −47,50 | 0,1407 | −0,1425 | |||
| AZO / AutoZone, Inc. | 0,00 | −16,09 | 0,27 | −18,43 | 0,1340 | −0,0395 | |||
| NFLX / Netflix, Inc. | 0,00 | −24,80 | 0,25 | 7,73 | 0,1245 | 0,0026 | |||
| FTNT / Fortinet, Inc. | 0,00 | −7,75 | 0,23 | 1,35 | 0,1121 | −0,0049 | |||
| IVOO / Vanguard Admiral Funds - Vanguard S&P Mid-Cap 400 ETF | 0,00 | −100,00 | 0,00 | 0,0000 | |||||
| QQQ / Invesco QQQ Trust, Series 1 | 0,00 | −100,00 | 0,00 | 0,0000 | |||||
| GEHC / GE HealthCare Technologies Inc. | 0,00 | −100,00 | 0,00 | 0,0000 | |||||
| HON / Honeywell International Inc. | 0,00 | −100,00 | 0,00 | 0,0000 | |||||
| IJR / iShares Trust - iShares Core S&P Small-Cap ETF | 0,00 | −100,00 | 0,00 | 0,0000 | |||||
| EEM / iShares, Inc. - iShares MSCI Emerging Markets ETF | 0,00 | −100,00 | 0,00 | 0,0000 |