Grunnleggende statistikk
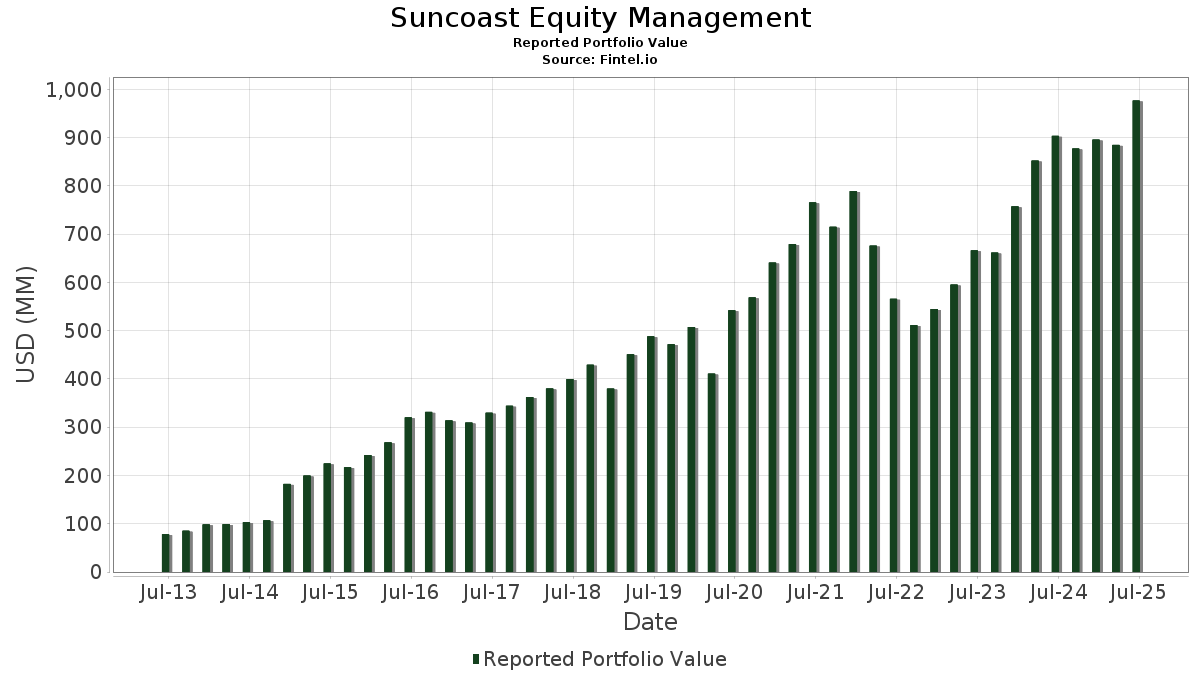
| Porteføljeverdi | $ 976 786 789 |
| Nåværende posisjoner | 85 |
Siste beholdninger, prestasjoner, forvaltet kapital (fra 13F, 13D)
Suncoast Equity Management har oppgitt 85 totale beholdninger i sine siste SEC-arkiveringer. Siste porteføljeverdi er beregnet til 976 786 789 USD. Faktisk forvaltet kapital (AUM) er denne verdien pluss kontanter (som ikke er oppgitt). Suncoast Equity Managements største beholdninger er Direxion Shares ETF Trust - Direxion Daily NVDA Bear 1X Shares (US:NVDD) , Microsoft Corporation (US:MSFT) , Booking Holdings Inc. (US:BKNG) , Intuit Inc. (US:INTU) , and Visa Inc. (US:V) . Suncoast Equity Managements nye posisjoner inkluderer EA Series Trust - Suncoast Select Growth ETF (US:SEMG) , Monolithic Power Systems, Inc. (US:MPWR) , Huron Consulting Group Inc. (US:HURN) , iShares Bitcoin Trust ETF (US:IBIT) , and Broadcom Inc. (US:AVGO) .
De største økningene dette kvartalet
Vi bruker endringen i porteføljeallokeringen fordi dette er det mest meningsfulle målet. Endringer kan skyldes handler eller endringer i aksjekursene.
| Verdipapirer | Aksjer (MM) |
Verdi (MM$) |
Portefølje % | ΔPortefølje % |
|---|---|---|---|---|
| 0,56 | 88,16 | 9,0258 | 2,1663 | |
| 0,18 | 87,33 | 8,9404 | 1,3905 | |
| 0,07 | 56,74 | 5,8093 | 0,7876 | |
| 0,01 | 63,43 | 6,4940 | 0,7865 | |
| 0,05 | 34,19 | 3,5005 | 0,5171 | |
| 0,07 | 24,69 | 2,5275 | 0,4038 | |
| 0,18 | 31,58 | 3,2328 | 0,2512 | |
| 0,08 | 3,48 | 0,3567 | 0,2216 | |
| 0,01 | 2,03 | 0,2080 | 0,2080 | |
| 0,01 | 4,14 | 0,4240 | 0,1857 |
De største reduksjonene dette kvartalet
Vi bruker endringen i porteføljeallokeringen fordi dette er det mest meningsfulle målet. Endringer kan skyldes handler eller endringer i aksjekurser.
| Verdipapirer | Aksjer (MM) |
Verdi (MM$) |
Portefølje % | ΔPortefølje % |
|---|---|---|---|---|
| 0,22 | 37,35 | 3,8234 | −1,5987 | |
| 0,17 | 35,41 | 3,6254 | −0,9555 | |
| 0,13 | 38,16 | 3,9069 | −0,5955 | |
| 0,04 | 33,90 | 3,4702 | −0,5804 | |
| 0,05 | 23,37 | 2,3927 | −0,5178 | |
| 0,15 | 53,86 | 5,5137 | −0,4964 | |
| 0,13 | 36,37 | 3,7235 | −0,3369 | |
| 0,06 | 36,33 | 3,7190 | −0,3083 | |
| 0,10 | 31,22 | 3,1960 | −0,2945 | |
| 0,07 | 25,85 | 2,6463 | −0,2621 |
13F- og Fondsarkiveringer
Dette skjemaet ble sendt inn den 2025-08-11 for rapporteringsperioden 2025-06-30. Klikk på lenkeikonet for å se hele transaksjonshistorikken.
Oppgradere for å låse opp premiedata og eksportere til Excel![]() .
.
| Verdipapirer | Type | Gjennomsnittlig aksjekurs | Aksjer (MM) |
ΔAksjer (%) |
ΔAksjer (%) |
Verdi ($MM) |
Portefølje (%) |
ΔPortefølje (%) |
|
|---|---|---|---|---|---|---|---|---|---|
| NVDD / Direxion Shares ETF Trust - Direxion Daily NVDA Bear 1X Shares | 0,56 | −0,36 | 88,16 | 45,24 | 9,0258 | 2,1663 | |||
| MSFT / Microsoft Corporation | 0,18 | −1,35 | 87,33 | 30,71 | 8,9404 | 1,3905 | |||
| BKNG / Booking Holdings Inc. | 0,01 | −0,05 | 63,43 | 25,60 | 6,4940 | 0,7865 | |||
| INTU / Intuit Inc. | 0,07 | −0,46 | 56,74 | 27,70 | 5,8093 | 0,7876 | |||
| V / Visa Inc. | 0,15 | −0,04 | 53,86 | 1,27 | 5,5137 | −0,4964 | |||
| SYK / Stryker Corporation | 0,12 | −0,03 | 49,09 | 6,25 | 5,0258 | −0,1957 | |||
| GOOGL / Alphabet Inc. | 0,23 | −3,73 | 41,58 | 9,30 | 4,2565 | −0,0421 | |||
| ACN / Accenture plc | 0,13 | −0,00 | 38,16 | −4,21 | 3,9069 | −0,5955 | |||
| XPRO / Expro Group Holdings N.V. | 0,22 | −0,30 | 37,35 | −22,16 | 3,8234 | −1,5987 | |||
| CRM / Salesforce, Inc. | 0,13 | −0,38 | 36,37 | 1,22 | 3,7235 | −0,3369 | |||
| MA / Mastercard Incorporated | 0,06 | −0,57 | 36,33 | 1,93 | 3,7190 | −0,3083 | |||
| AAPL / Apple Inc. | 0,17 | −5,42 | 35,41 | −12,64 | 3,6254 | −0,9555 | |||
| META / Meta Platforms, Inc. | 0,05 | 1,14 | 34,19 | 29,52 | 3,5005 | 0,5171 | |||
| LLY / Eli Lilly and Company | 0,04 | 0,19 | 33,90 | −5,43 | 3,4702 | −0,5804 | |||
| GOOGL / Alphabet Inc. | 0,18 | 5,02 | 31,58 | 19,69 | 3,2328 | 0,2512 | |||
| ADP / Automatic Data Processing, Inc. | 0,10 | 0,13 | 31,22 | 1,07 | 3,1960 | −0,2945 | |||
| GWW / W.W. Grainger, Inc. | 0,03 | 0,39 | 31,07 | 5,71 | 3,1810 | −0,1406 | |||
| ADBE / Adobe Inc. | 0,07 | −0,43 | 25,85 | 0,44 | 2,6463 | −0,2621 | |||
| ETN / Eaton Corporation plc | 0,07 | 0,03 | 24,69 | 31,38 | 2,5275 | 0,4038 | |||
| BRK.A / Berkshire Hathaway Inc. | 0,05 | −0,51 | 23,37 | −9,26 | 2,3927 | −0,5178 | |||
| MCK / McKesson Corporation | 0,03 | −0,43 | 21,43 | 8,42 | 2,1936 | −0,0397 | |||
| COR / Cencora, Inc. | 0,03 | 2,57 | 8,63 | 10,59 | 0,8833 | 0,0017 | |||
| BR / Broadridge Financial Solutions, Inc. | 0,03 | 2,72 | 6,83 | 2,97 | 0,6996 | −0,0504 | |||
| SHW / The Sherwin-Williams Company | 0,01 | 1,93 | 4,72 | 0,21 | 0,4836 | −0,0490 | |||
| TJX / The TJX Companies, Inc. | 0,04 | 0,19 | 4,70 | 1,58 | 0,4808 | −0,0417 | |||
| MMC / Marsh & McLennan Companies, Inc. | 0,02 | 1,77 | 4,39 | −8,83 | 0,4495 | −0,0946 | |||
| ROL / Rollins, Inc. | 0,08 | 2,35 | 4,34 | 6,87 | 0,4446 | −0,0146 | |||
| TT / Trane Technologies plc | 0,01 | 51,27 | 4,14 | 96,44 | 0,4240 | 0,1857 | |||
| FAST / Fastenal Company | 0,08 | 437,95 | 3,48 | 191,55 | 0,3567 | 0,2216 | |||
| CTAS / Cintas Corporation | 0,02 | 4,74 | 3,35 | 13,56 | 0,3430 | 0,0096 | |||
| IWF / iShares Trust - iShares Russell 1000 Growth ETF | 0,01 | 0,00 | 3,06 | 17,58 | 0,3130 | 0,0192 | |||
| TSCO / Tractor Supply Company | 0,05 | 1,92 | 2,64 | −2,40 | 0,2701 | −0,0354 | |||
| FICO / Fair Isaac Corporation | 0,00 | 7,57 | 2,41 | 6,63 | 0,2472 | −0,0087 | |||
| SPY / SPDR S&P 500 ETF | 0,00 | 11,28 | 2,26 | 22,89 | 0,2314 | 0,0236 | |||
| ITT / ITT Inc. | 0,01 | 3,60 | 2,21 | 25,87 | 0,2262 | 0,0277 | |||
| BRK.A / Berkshire Hathaway Inc. | 0,00 | 0,00 | 2,19 | −8,73 | 0,2238 | −0,0469 | |||
| PAYX / Paychex, Inc. | 0,01 | 2,03 | 0,2080 | 0,2080 | |||||
| ZTS / Zoetis Inc. | 0,01 | 3,96 | 1,91 | −1,55 | 0,1957 | −0,0237 | |||
| CPRT / Copart, Inc. | 0,04 | 4,63 | 1,83 | −9,27 | 0,1874 | −0,0406 | |||
| CPAY / Corpay, Inc. | 0,01 | 4,68 | 1,80 | −0,39 | 0,1840 | −0,0199 | |||
| NICE / NICE Ltd. - Depositary Receipt (Common Stock) | 0,01 | 4,37 | 1,46 | 14,34 | 0,1494 | 0,0052 | |||
| CHKP / Check Point Software Technologies Ltd. | 0,01 | 3,16 | 1,44 | 0,14 | 0,1478 | −0,0151 | |||
| BRO / Brown & Brown, Inc. | 0,01 | −32,66 | 1,37 | −40,00 | 0,1404 | −0,1179 | |||
| HUBB / Hubbell Incorporated | 0,00 | 3,99 | 1,32 | 28,33 | 0,1350 | 0,0189 | |||
| VEEV / Veeva Systems Inc. | 0,00 | 4,49 | 1,31 | 29,92 | 0,1338 | 0,0201 | |||
| MCD / McDonald's Corporation | 0,00 | 0,53 | 1,21 | −5,98 | 0,1239 | −0,0216 | |||
| CLS / Celestica Inc. | 0,01 | 7,06 | 1,16 | 111,88 | 0,1187 | 0,0569 | |||
| AMZN / Amazon.com, Inc. | 0,01 | 31,59 | 1,12 | 51,83 | 0,1146 | 0,0312 | |||
| G / Genpact Limited | 0,02 | 5,02 | 1,07 | −8,25 | 0,1093 | −0,0222 | |||
| ROP / Roper Technologies, Inc. | 0,00 | 3,66 | 1,06 | −0,38 | 0,1084 | −0,0117 | |||
| STE / STERIS plc | 0,00 | 4,98 | 1,05 | 11,26 | 0,1073 | 0,0009 | |||
| EW / Edwards Lifesciences Corporation | 0,01 | 4,20 | 1,04 | 12,45 | 0,1064 | 0,0019 | |||
| IDXX / IDEXX Laboratories, Inc. | 0,00 | 3,60 | 0,99 | 32,31 | 0,1011 | 0,0168 | |||
| SEMG / EA Series Trust - Suncoast Select Growth ETF | 0,04 | 0,93 | 0,0952 | 0,0952 | |||||
| USFD / US Foods Holding Corp. | 0,01 | 3,26 | 0,87 | 21,49 | 0,0887 | 0,0081 | |||
| MPWR / Monolithic Power Systems, Inc. | 0,00 | 0,78 | 0,0802 | 0,0802 | |||||
| HURN / Huron Consulting Group Inc. | 0,01 | 0,77 | 0,0784 | 0,0784 | |||||
| YELP / Yelp Inc. | 0,02 | 3,81 | 0,76 | −3,94 | 0,0773 | −0,0115 | |||
| MTD / Mettler-Toledo International Inc. | 0,00 | 5,12 | 0,72 | 4,48 | 0,0741 | −0,0041 | |||
| NTAP / NetApp, Inc. | 0,01 | 4,08 | 0,71 | 26,12 | 0,0723 | 0,0091 | |||
| PLTR / Palantir Technologies Inc. | 0,01 | 0,00 | 0,68 | 61,37 | 0,0698 | 0,0221 | |||
| HD / The Home Depot, Inc. | 0,00 | −0,26 | 0,57 | −0,18 | 0,0579 | −0,0062 | |||
| FDX / FedEx Corporation | 0,00 | −9,54 | 0,47 | −15,61 | 0,0477 | −0,0147 | |||
| WMT / Walmart Inc. | 0,00 | 0,07 | 0,45 | 11,63 | 0,0462 | 0,0004 | |||
| QQQ / Invesco QQQ Trust, Series 1 | 0,00 | 5,54 | 0,43 | 24,28 | 0,0441 | 0,0049 | |||
| TXN / Texas Instruments Incorporated | 0,00 | 0,00 | 0,43 | 15,49 | 0,0435 | 0,0019 | |||
| VOO / Vanguard Index Funds - Vanguard S&P 500 ETF | 0,00 | 0,00 | 0,41 | 10,51 | 0,0420 | 0,0001 | |||
| ETHE / Grayscale Ethereum Trust | 0,02 | 0,00 | 0,41 | 37,16 | 0,0416 | 0,0081 | |||
| HIG / The Hartford Insurance Group, Inc. | 0,00 | 0,00 | 0,36 | 2,56 | 0,0369 | −0,0028 | |||
| IBIT / iShares Bitcoin Trust ETF | 0,01 | 0,34 | 0,0344 | 0,0344 | |||||
| VIG / Vanguard Specialized Funds - Vanguard Dividend Appreciation ETF | 0,00 | 0,00 | 0,30 | 5,67 | 0,0305 | −0,0014 | |||
| JNJ / Johnson & Johnson | 0,00 | 0,22 | 0,28 | −7,69 | 0,0283 | −0,0055 | |||
| HCI / HCI Group, Inc. | 0,00 | 0,00 | 0,27 | 1,87 | 0,0280 | −0,0023 | |||
| UPS / United Parcel Service, Inc. | 0,00 | 0,00 | 0,27 | −8,25 | 0,0274 | −0,0056 | |||
| DNP / DNP Select Income Fund Inc. | 0,03 | 1,36 | 0,27 | 0,38 | 0,0272 | −0,0027 | |||
| DHI / D.R. Horton, Inc. | 0,00 | 0,00 | 0,26 | 1,54 | 0,0270 | −0,0024 | |||
| TSLA / Tesla, Inc. | 0,00 | −0,12 | 0,26 | 22,49 | 0,0263 | 0,0026 | |||
| PEP / PepsiCo, Inc. | 0,00 | −87,93 | 0,24 | −89,39 | 0,0250 | −0,2349 | |||
| HURA / TuHURA Biosciences, Inc. | 0,10 | 4,41 | 0,23 | −27,95 | 0,0238 | −0,0127 | |||
| SOUN / SoundHound AI, Inc. | 0,02 | 0,00 | 0,22 | 32,74 | 0,0228 | 0,0038 | |||
| AVGO / Broadcom Inc. | 0,00 | 0,21 | 0,0216 | 0,0216 | |||||
| MIRA / MIRA Pharmaceuticals, Inc. | 0,10 | 0,00 | 0,12 | 22,77 | 0,0128 | 0,0014 | |||
| HIO / Western Asset High Income Opportunity Fund Inc. | 0,02 | 2,75 | 0,07 | 2,94 | 0,0072 | −0,0005 | |||
| TELO / Telomir Pharmaceuticals, Inc. | 0,05 | 0,00 | 0,06 | −61,82 | 0,0066 | −0,0121 | |||
| PNBK / Patriot National Bancorp, Inc. | 0,02 | 0,03 | 0,0028 | 0,0028 | |||||
| OMEX / Odyssey Marine Exploration, Inc. | 0,00 | −100,00 | 0,00 | −100,00 | −0,0007 | ||||
| PRMB / Primo Brands Corporation | 0,00 | −100,00 | 0,00 | 0,0000 | |||||
| CMPO.W / CompoSecure, Inc. - Equity Warrant | 0,00 | −100,00 | 0,00 | 0,0000 | |||||
| DECK / Deckers Outdoor Corporation | 0,00 | −100,00 | 0,00 | 0,0000 |