Grunnleggende statistikk
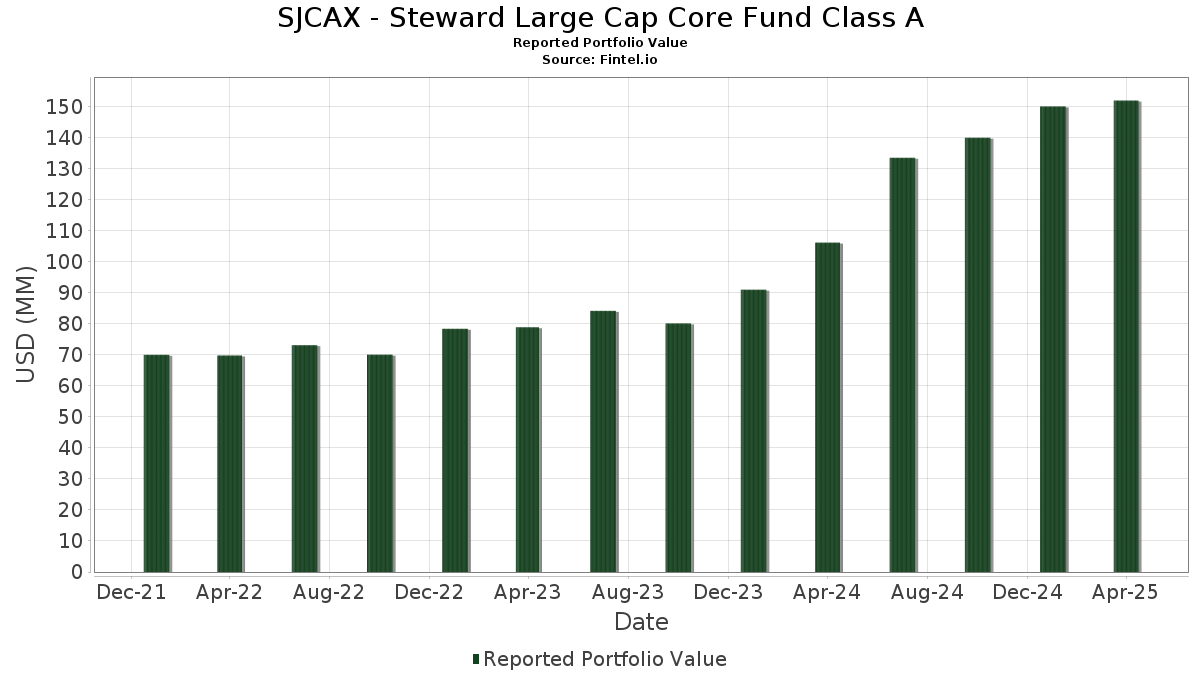
| Porteføljeverdi | $ 152 004 411 |
| Nåværende posisjoner | 94 |
Siste beholdninger, prestasjoner, forvaltet kapital (fra 13F, 13D)
SJCAX - Steward Large Cap Core Fund Class A har oppgitt 94 totale beholdninger i sine siste SEC-arkiveringer. Siste porteføljeverdi er beregnet til 152 004 411 USD. Faktisk forvaltet kapital (AUM) er denne verdien pluss kontanter (som ikke er oppgitt). SJCAX - Steward Large Cap Core Fund Class As største beholdninger er Apple Inc. (US:AAPL) , Microsoft Corporation (US:MSFT) , NVIDIA Corporation (US:NVDA) , Amazon.com, Inc. (US:AMZN) , and Alphabet Inc. (US:GOOGL) . SJCAX - Steward Large Cap Core Fund Class As nye posisjoner inkluderer EMCOR Group, Inc. (US:EME) , Atlassian Corporation (US:TEAM) , F5, Inc. (US:FFIV) , Nutanix, Inc. (US:NTNX) , and Axalta Coating Systems Ltd. (US:AXTA) .
De største økningene dette kvartalet
Vi bruker endringen i porteføljeallokeringen fordi dette er det mest meningsfulle målet. Endringer kan skyldes handler eller endringer i aksjekursene.
| Verdipapirer | Aksjer (MM) |
Verdi (MM$) |
Portefølje % | ΔPortefølje % |
|---|---|---|---|---|
| 0,01 | 1,76 | 1,1568 | 1,1568 | |
| 0,00 | 1,60 | 1,0543 | 1,0543 | |
| 0,01 | 1,60 | 1,0512 | 1,0512 | |
| 0,01 | 1,59 | 1,0448 | 1,0448 | |
| 0,02 | 1,58 | 1,0393 | 1,0393 | |
| 0,05 | 1,56 | 1,0261 | 1,0261 | |
| 0,02 | 1,53 | 1,0042 | 1,0042 | |
| 0,00 | 2,00 | 1,3157 | 0,9683 | |
| 0,06 | 1,45 | 0,9523 | 0,9523 | |
| 0,10 | 1,53 | 1,0060 | 0,8692 |
De største reduksjonene dette kvartalet
Vi bruker endringen i porteføljeallokeringen fordi dette er det mest meningsfulle målet. Endringer kan skyldes handler eller endringer i aksjekurser.
| Verdipapirer | Aksjer (MM) |
Verdi (MM$) |
Portefølje % | ΔPortefølje % |
|---|---|---|---|---|
| 0,00 | 0,00 | −1,3309 | ||
| 0,00 | 0,13 | 0,0846 | −1,0015 | |
| 0,00 | 0,42 | 0,2766 | −0,9676 | |
| 0,00 | 0,55 | 0,3608 | −0,7415 | |
| 0,02 | 3,69 | 2,4261 | −0,5825 | |
| 0,00 | 0,85 | 0,5568 | −0,5214 | |
| 0,02 | 3,65 | 2,4024 | −0,4519 | |
| 0,00 | 2,20 | 1,4444 | −0,3921 | |
| 0,00 | 1,07 | 0,7042 | −0,3488 | |
| 0,01 | 0,72 | 0,4714 | −0,3385 |
13F- og Fondsarkiveringer
Dette skjemaet ble sendt inn den 2025-06-26 for rapporteringsperioden 2025-04-30. Klikk på lenkeikonet for å se hele transaksjonshistorikken.
Oppgradere for å låse opp premiedata og eksportere til Excel![]() .
.
| Verdipapirer | Type | Gjennomsnittlig aksjekurs | Aksjer (MM) |
ΔAksjer (%) |
ΔAksjer (%) |
Verdi ($MM) |
Portefølje (%) |
ΔPortefølje (%) |
|
|---|---|---|---|---|---|---|---|---|---|
| AAPL / Apple Inc. | 0,04 | 15,62 | 7,86 | 4,10 | 5,1717 | 0,1404 | |||
| MSFT / Microsoft Corporation | 0,02 | 5,88 | 7,11 | 0,82 | 4,6798 | −0,0210 | |||
| NVDA / NVIDIA Corporation | 0,06 | 7,69 | 6,10 | −2,31 | 4,0120 | −0,1476 | |||
| AMZN / Amazon.com, Inc. | 0,02 | 5,26 | 3,69 | −18,32 | 2,4261 | −0,5825 | |||
| GOOGL / Alphabet Inc. | 0,02 | 9,52 | 3,65 | −14,75 | 2,4024 | −0,4519 | |||
| V / Visa Inc. | 0,01 | 11,11 | 3,46 | 12,32 | 2,2726 | 0,2232 | |||
| MA / Mastercard Incorporated | 0,01 | 0,00 | 2,74 | −1,33 | 1,8025 | −0,0477 | |||
| CRM / Salesforce, Inc. | 0,01 | 28,57 | 2,42 | 1,13 | 1,5907 | −0,0028 | |||
| META / Meta Platforms, Inc. | 0,00 | 0,00 | 2,20 | −20,32 | 1,4444 | −0,3921 | |||
| CSCO / Cisco Systems, Inc. | 0,04 | 5,56 | 2,19 | 0,55 | 1,4430 | −0,0105 | |||
| IBM / International Business Machines Corporation | 0,01 | 0,00 | 2,18 | −5,43 | 1,4315 | −0,1016 | |||
| QCOM / QUALCOMM Incorporated | 0,01 | 16,67 | 2,08 | 0,14 | 1,3671 | −0,0154 | |||
| BKNG / Booking Holdings Inc. | 0,00 | 0,00 | 2,04 | 7,60 | 1,3416 | 0,0792 | |||
| SPGI / S&P Global Inc. | 0,00 | 300,00 | 2,00 | 283,88 | 1,3157 | 0,9683 | |||
| PGR / The Progressive Corporation | 0,01 | −12,50 | 1,97 | 0,05 | 1,2972 | −0,0162 | |||
| GILD / Gilead Sciences, Inc. | 0,02 | −10,00 | 1,92 | −1,39 | 1,2614 | −0,0337 | |||
| VZ / Verizon Communications Inc. | 0,04 | −10,42 | 1,89 | 0,21 | 1,2462 | −0,0134 | |||
| ADBE / Adobe Inc. | 0,01 | 25,00 | 1,87 | −1,99 | 1,2332 | −0,1322 | |||
| AXP / American Express Company | 0,01 | 16,67 | 1,86 | −2,10 | 1,2266 | −0,0423 | |||
| MMC / Marsh & McLennan Companies, Inc. | 0,01 | 33,33 | 1,80 | 38,59 | 1,1864 | 0,3195 | |||
| ADP / Automatic Data Processing, Inc. | 0,01 | 0,00 | 1,80 | −0,83 | 1,1863 | −0,0249 | |||
| FTNT / Fortinet, Inc. | 0,02 | 0,00 | 1,76 | 2,86 | 1,1602 | 0,0177 | |||
| JBL / Jabil Inc. | 0,01 | 1,76 | 1,1568 | 1,1568 | |||||
| EQIX / Equinix, Inc. | 0,00 | 0,00 | 1,72 | −5,80 | 1,1323 | −0,0850 | |||
| HIG / The Hartford Insurance Group, Inc. | 0,01 | 0,00 | 1,72 | 9,99 | 1,1296 | 0,0892 | |||
| PYPL / PayPal Holdings, Inc. | 0,03 | 30,00 | 1,71 | −3,39 | 1,1260 | −0,0543 | |||
| CI / The Cigna Group | 0,01 | −16,67 | 1,70 | −3,68 | 1,1183 | −0,0577 | |||
| DFS / Discover Financial Services | 0,01 | 0,00 | 1,64 | −9,12 | 1,0814 | −0,1243 | |||
| GS / The Goldman Sachs Group, Inc. | 0,00 | 0,00 | 1,64 | −14,52 | 1,0805 | −0,1995 | |||
| GAP / The Gap, Inc. | 0,07 | 20,97 | 1,64 | 10,05 | 1,0804 | 0,0862 | |||
| CRUS / Cirrus Logic, Inc. | 0,02 | 13,33 | 1,63 | 8,37 | 1,0739 | 0,0702 | |||
| WCC / WESCO International, Inc. | 0,01 | 25,00 | 1,63 | 10,07 | 1,0719 | 0,0859 | |||
| G / Genpact Limited | 0,03 | −8,57 | 1,61 | −5,63 | 1,0579 | −0,0774 | |||
| BK / The Bank of New York Mellon Corporation | 0,02 | 0,00 | 1,61 | −6,40 | 1,0578 | −0,0871 | |||
| EME / EMCOR Group, Inc. | 0,00 | 1,60 | 1,0543 | 1,0543 | |||||
| BRK.B / Berkshire Hathaway Inc. | 0,00 | 50,00 | 1,60 | 70,65 | 1,0523 | 0,4278 | |||
| TEAM / Atlassian Corporation | 0,01 | 1,60 | 1,0512 | 1,0512 | |||||
| JLL / Jones Lang LaSalle Incorporated | 0,01 | 16,67 | 1,59 | −6,19 | 1,0471 | −0,0834 | |||
| FFIV / F5, Inc. | 0,01 | 1,59 | 1,0448 | 1,0448 | |||||
| CBRE / CBRE Group, Inc. | 0,01 | 8,33 | 1,59 | −8,53 | 1,0448 | −0,1124 | |||
| NTNX / Nutanix, Inc. | 0,02 | 1,58 | 1,0393 | 1,0393 | |||||
| AMT / American Tower Corporation | 0,01 | −12,50 | 1,58 | 6,63 | 1,0379 | 0,0521 | |||
| RL / Ralph Lauren Corporation | 0,01 | 16,67 | 1,57 | 5,07 | 1,0357 | 0,0376 | |||
| CL / Colgate-Palmolive Company | 0,02 | −10,53 | 1,57 | −4,86 | 1,0309 | −0,0666 | |||
| LOW / Lowe's Companies, Inc. | 0,01 | 0,00 | 1,56 | −14,07 | 1,0293 | −0,1833 | |||
| AXTA / Axalta Coating Systems Ltd. | 0,05 | 1,56 | 1,0261 | 1,0261 | |||||
| CAH / Cardinal Health, Inc. | 0,01 | −15,38 | 1,55 | −3,30 | 1,0223 | −0,0487 | |||
| WSM / Williams-Sonoma, Inc. | 0,01 | 25,00 | 1,54 | −8,64 | 1,0160 | −0,1105 | |||
| XP / XP Inc. | 0,10 | 1 238,03 | 1,53 | 954,48 | 1,0060 | 0,8692 | |||
| BPOP / Popular, Inc. | 0,02 | 1,53 | 1,0042 | 1,0042 | |||||
| GEN / Gen Digital Inc. | 0,06 | 5,36 | 1,53 | 1,33 | 1,0040 | 0,0000 | |||
| AFL / Aflac Incorporated | 0,01 | 0,00 | 1,52 | 1,20 | 1,0008 | −0,0007 | |||
| GDDY / GoDaddy Inc. | 0,01 | 0,00 | 1,51 | −11,46 | 0,9910 | −0,1424 | |||
| DBX / Dropbox, Inc. | 0,05 | 8,33 | 1,48 | −3,82 | 0,9765 | −0,0516 | |||
| BWA / BorgWarner Inc. | 0,05 | 10,64 | 1,48 | −1,60 | 0,9707 | −0,0282 | |||
| AMCR / Amcor plc | 0,16 | 230,91 | 1,47 | 177,84 | 0,9652 | 0,2946 | |||
| KMB / Kimberly-Clark Corporation | 0,01 | −15,38 | 1,45 | −14,21 | 0,9535 | −0,1722 | |||
| IRDM / Iridium Communications Inc. | 0,06 | 1,45 | 0,9523 | 0,9523 | |||||
| PNC / The PNC Financial Services Group, Inc. | 0,01 | 0,00 | 1,45 | −20,02 | 0,9513 | −0,2536 | |||
| DECK / Deckers Outdoor Corporation | 0,01 | 160,00 | 1,44 | 62,53 | 0,9477 | 0,3569 | |||
| JWN / Nordstrom, Inc. | 0,06 | −10,77 | 1,40 | −11,00 | 0,9209 | −0,1270 | |||
| HRB / H&R Block, Inc. | 0,02 | 0,00 | 1,39 | 9,12 | 0,9133 | 0,0658 | |||
| COLM / Columbia Sportswear Company | 0,02 | 29,41 | 1,37 | −8,93 | 0,8996 | −0,1004 | |||
| COF / Capital One Financial Corporation | 0,01 | 0,00 | 1,26 | −11,51 | 0,8300 | −0,1200 | |||
| SYF / Synchrony Financial | 0,02 | 0,00 | 1,25 | −24,71 | 0,8201 | −0,2828 | |||
| RHI / Robert Half Inc. | 0,03 | 40,00 | 1,24 | −3,35 | 0,8159 | −0,1452 | |||
| AVGO / Broadcom Inc. | 0,01 | 20,00 | 1,15 | 4,34 | 0,7596 | 0,0225 | |||
| MET / MetLife, Inc. | 0,02 | 0,00 | 1,15 | −12,85 | 0,7585 | −0,1233 | |||
| XPRO / Expro Group Holdings N.V. | 0,01 | 1,11 | 0,7284 | 0,7284 | |||||
| MAN / ManpowerGroup Inc. | 0,03 | 160,42 | 1,08 | 51,34 | 0,7082 | −0,0749 | |||
| MTD / Mettler-Toledo International Inc. | 0,00 | 100,00 | 1,07 | 45,38 | 0,7042 | −0,3488 | |||
| JHG / Janus Henderson Group plc | 0,03 | 0,00 | 1,06 | −26,10 | 0,6990 | −0,2588 | |||
| CROX / Crocs, Inc. | 0,01 | 0,00 | 1,06 | −5,53 | 0,6976 | −0,0504 | |||
| PINC / Premier, Inc. | 0,04 | 0,00 | 0,92 | −10,21 | 0,6023 | −0,0770 | |||
| PVH / PVH Corp. | 0,01 | 0,00 | 0,90 | −23,02 | 0,5898 | −0,1862 | |||
| TSLA / Tesla, Inc. | 0,00 | −25,00 | 0,85 | −47,71 | 0,5568 | −0,5214 | |||
| HPQ / HP Inc. | 0,03 | 0,00 | 0,84 | −21,28 | 0,5500 | −0,1580 | |||
| M / Macy's, Inc. | 0,07 | −8,00 | 0,79 | −32,62 | 0,5183 | −0,2602 | |||
| IRM / Iron Mountain Incorporated | 0,01 | 0,00 | 0,78 | −11,66 | 0,5131 | −0,0756 | |||
| YETI / YETI Holdings, Inc. | 0,03 | 0,74 | 0,4883 | 0,4883 | |||||
| QEPC / Q.E.P. Co., Inc. | 0,06 | 0,72 | 0,4767 | 0,4767 | |||||
| LRCX / Lam Research Corporation | 0,01 | −33,33 | 0,72 | −41,07 | 0,4714 | −0,3385 | |||
| MAT / Mattel, Inc. | 0,04 | 0,00 | 0,70 | −14,76 | 0,4599 | −0,0865 | |||
| DT / Dynatrace, Inc. | 0,01 | 0,00 | 0,66 | −18,69 | 0,4325 | −0,1061 | |||
| ADSK / Autodesk, Inc. | 0,00 | −63,64 | 0,55 | −53,16 | 0,3608 | −0,7415 | |||
| JPM / JPMorgan Chase & Co. | 0,00 | 0,00 | 0,49 | −8,43 | 0,3218 | −0,0344 | |||
| DVA / DaVita Inc. | 0,00 | 0,00 | 0,45 | −19,72 | 0,2979 | −0,0777 | |||
| ELV / Elevance Health, Inc. | 0,00 | −60,00 | 0,42 | −68,21 | 0,2766 | −0,9676 | |||
| HOG / Harley-Davidson, Inc. | 0,01 | 0,00 | 0,29 | −17,23 | 0,1932 | −0,0430 | |||
| CCK / Crown Holdings, Inc. | 0,00 | 0,00 | 0,29 | 9,51 | 0,1901 | 0,0145 | |||
| PRU / Prudential Financial, Inc. | 0,00 | 0,00 | 0,29 | −15,09 | 0,1892 | −0,0361 | |||
| AVT / Avnet, Inc. | 0,01 | 0,23 | 0,1545 | 0,1545 | |||||
| TJX / The TJX Companies, Inc. | 0,00 | −90,38 | 0,13 | −87,03 | 0,0846 | −1,0015 | |||
| NTPXX / Northern Institutional Funds - Northern Institutional Treasury Portfolio Premier Shares | 0,12 | −77,90 | 0,12 | −77,96 | 0,0786 | −0,2815 | |||
| BRX / Brixmor Property Group Inc. | 0,00 | −100,00 | 0,00 | −100,00 | −0,0347 | ||||
| MCO / Moody's Corporation | 0,00 | −100,00 | 0,00 | −100,00 | −1,3309 |