Grunnleggende statistikk
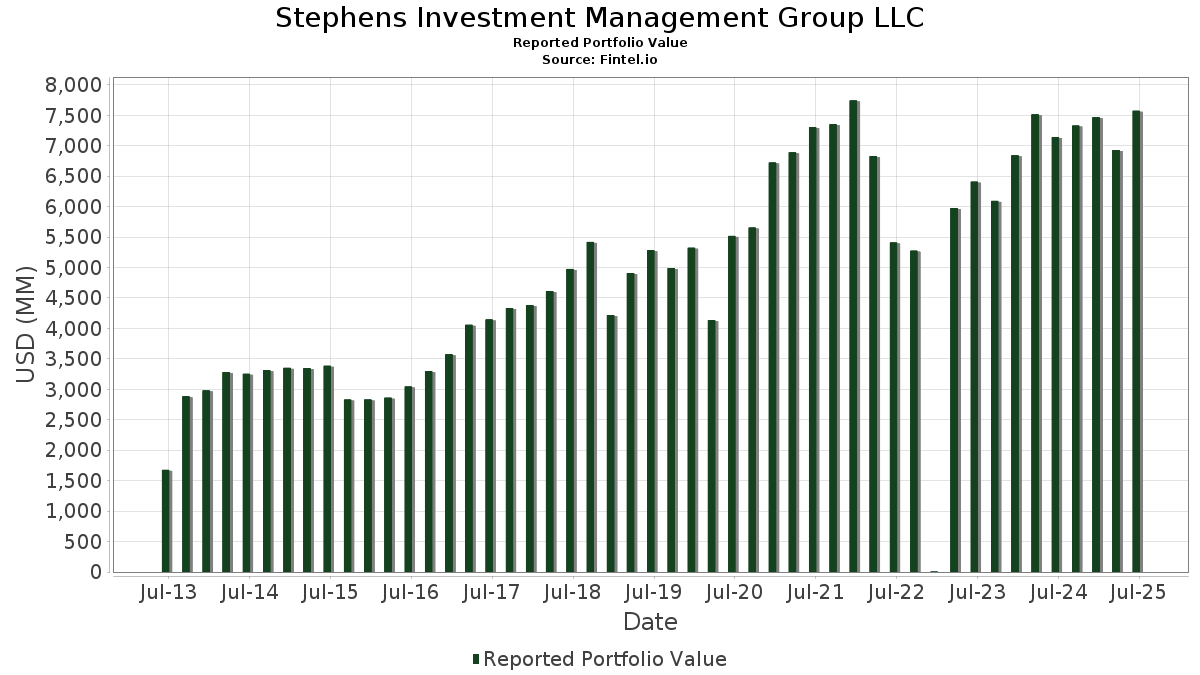
| Porteføljeverdi | $ 7 573 387 794 |
| Nåværende posisjoner | 178 |
Siste beholdninger, prestasjoner, forvaltet kapital (fra 13F, 13D)
Stephens Investment Management Group LLC har oppgitt 178 totale beholdninger i sine siste SEC-arkiveringer. Siste porteføljeverdi er beregnet til 7 573 387 794 USD. Faktisk forvaltet kapital (AUM) er denne verdien pluss kontanter (som ikke er oppgitt). Stephens Investment Management Group LLCs største beholdninger er AeroVironment, Inc. (US:AVAV) , CyberArk Software Ltd. (US:CYBR) , Wingstop Inc. (US:WING) , Guidewire Software, Inc. (US:GWRE) , and Kratos Defense & Security Solutions, Inc. (US:KTOS) . Stephens Investment Management Group LLCs nye posisjoner inkluderer Viking Holdings Ltd (US:VIK) , Exact Sciences Corporation (US:EXAS) , Procore Technologies, Inc. (US:PCOR) , Xometry, Inc. (US:XMTR) , and Credo Technology Group Holding Ltd (US:CRDO) . Stephens Investment Management Group LLCs viktigste bransjer er "Mining And Quarrying Of Nonmetallic Minerals, Except Fuels" (sic 14) , "Apparel And Other Finished Products Made From Fabrics And Similar Materials" (sic 23) , and "Motor Freight Transportation And Warehousing" (sic 42) .
De største økningene dette kvartalet
Vi bruker endringen i porteføljeallokeringen fordi dette er det mest meningsfulle målet. Endringer kan skyldes handler eller endringer i aksjekursene.
| Verdipapirer | Aksjer (MM) |
Verdi (MM$) |
Portefølje % | ΔPortefølje % |
|---|---|---|---|---|
| 0,63 | 180,63 | 2,3850 | 1,0719 | |
| 1,18 | 110,60 | 1,4604 | 0,7096 | |
| 0,74 | 97,69 | 1,2900 | 0,5215 | |
| 0,61 | 32,43 | 0,4282 | 0,4282 | |
| 0,64 | 81,58 | 1,0772 | 0,3799 | |
| 0,53 | 28,17 | 0,3719 | 0,3719 | |
| 0,59 | 84,62 | 1,1173 | 0,3718 | |
| 0,53 | 80,27 | 1,0599 | 0,3379 | |
| 0,55 | 85,13 | 1,1240 | 0,3377 | |
| 0,40 | 135,61 | 1,7906 | 0,3369 |
De største reduksjonene dette kvartalet
Vi bruker endringen i porteføljeallokeringen fordi dette er det mest meningsfulle målet. Endringer kan skyldes handler eller endringer i aksjekurser.
| Verdipapirer | Aksjer (MM) |
Verdi (MM$) |
Portefølje % | ΔPortefølje % |
|---|---|---|---|---|
| 1,30 | 88,68 | 1,1710 | −0,5799 | |
| 1,31 | 75,65 | 0,9989 | −0,4955 | |
| 1,17 | 44,78 | 0,5913 | −0,4205 | |
| 1,29 | 67,21 | 0,8874 | −0,3436 | |
| 0,00 | 0,58 | 0,0076 | −0,3405 | |
| 0,16 | 76,75 | 1,0134 | −0,3187 | |
| 0,27 | 84,07 | 1,1101 | −0,3013 | |
| 0,41 | 60,34 | 0,7967 | −0,2861 | |
| 0,57 | 134,56 | 1,7768 | −0,2642 | |
| 0,18 | 18,40 | 0,2429 | −0,2604 |
13D/G-Arkiveringer
Dette er en liste over eventuelle 13D- og 13G-Arkiveringer det siste året. Klikk på lenkeikonet for å se hele transaksjonshistorikken. Grønne rader angir nye posisjoner. Røde rader angir lukkede posisjoner.
| Fil Dato | Skjema | Verdipapirer | Tidligere aksjer |
Nåværende aksjer |
ΔAksjer % | % Eierskap |
% ΔEierskap | |
|---|---|---|---|---|---|---|---|---|
| 2025-08-13 | ECPG / Encore Capital Group, Inc. | 1 248 831 | 5,30 |
13F- og Fondsarkiveringer
Dette skjemaet ble sendt inn den 2025-07-30 for rapporteringsperioden 2025-06-30. Klikk på lenkeikonet for å se hele transaksjonshistorikken.
Oppgradere for å låse opp premiedata og eksportere til Excel![]() .
.
| Verdipapirer | Type | Gjennomsnittlig aksjekurs | Aksjer (MM) |
ΔAksjer (%) |
ΔAksjer (%) |
Verdi ($MM) |
Portefølje (%) |
ΔPortefølje (%) |
|
|---|---|---|---|---|---|---|---|---|---|
| AVAV / AeroVironment, Inc. | 0,63 | −16,98 | 180,63 | 98,49 | 2,3850 | 1,0719 | |||
| CYBR / CyberArk Software Ltd. | 0,34 | −7,17 | 138,47 | 11,74 | 1,8283 | 0,0402 | |||
| WING / Wingstop Inc. | 0,40 | −9,83 | 135,61 | 34,61 | 1,7906 | 0,3369 | |||
| GWRE / Guidewire Software, Inc. | 0,57 | −24,30 | 134,56 | −4,86 | 1,7768 | −0,2642 | |||
| KTOS / Kratos Defense & Security Solutions, Inc. | 2,58 | −33,18 | 119,82 | 4,54 | 1,5821 | −0,0718 | |||
| HEIA / Heico Corp. - Class A | 0,46 | −15,53 | 118,57 | 3,60 | 1,5657 | −0,0859 | |||
| EXEL / Exelixis, Inc. | 2,64 | −12,40 | 116,46 | 4,57 | 1,5378 | −0,0693 | |||
| FCFS / FirstCash Holdings, Inc. | 0,85 | −4,49 | 114,72 | 7,27 | 1,5148 | −0,0284 | |||
| HOOD / Robinhood Markets, Inc. | 1,18 | −5,51 | 110,60 | 112,58 | 1,4604 | 0,7096 | |||
| RBC / RBC Bearings Incorporated | 0,29 | −6,77 | 109,87 | 11,50 | 1,4507 | 0,0288 | |||
| OLLI / Ollie's Bargain Outlet Holdings, Inc. | 0,82 | 0,84 | 107,54 | 14,20 | 1,4200 | 0,0612 | |||
| HQY / HealthEquity, Inc. | 1,02 | −4,97 | 106,47 | 12,66 | 1,4059 | 0,0421 | |||
| FTI / TechnipFMC plc | 3,08 | −10,32 | 106,23 | −2,54 | 1,4027 | −0,1702 | |||
| LYV / Live Nation Entertainment, Inc. | 0,66 | −6,09 | 99,84 | 8,80 | 1,3183 | −0,0059 | |||
| EXE / Expand Energy Corporation | 0,85 | −12,35 | 99,48 | −7,93 | 1,3136 | −0,2455 | |||
| TW / Tradeweb Markets Inc. | 0,68 | −6,17 | 99,17 | −7,47 | 1,3095 | −0,2370 | |||
| TTWO / Take-Two Interactive Software, Inc. | 0,41 | −18,08 | 99,06 | −4,01 | 1,3079 | −0,1812 | |||
| FIVE / Five Below, Inc. | 0,74 | 4,78 | 97,69 | 83,45 | 1,2900 | 0,5215 | |||
| BURL / Burlington Stores, Inc. | 0,40 | −3,17 | 93,88 | −5,49 | 1,2396 | −0,1937 | |||
| MANH / Manhattan Associates, Inc. | 0,46 | 2,40 | 90,43 | 16,86 | 1,1941 | 0,0774 | |||
| EA / Electronic Arts Inc. | 0,56 | −5,54 | 88,72 | 4,38 | 1,1715 | −0,0550 | |||
| RYAN / Ryan Specialty Holdings, Inc. | 1,30 | −20,59 | 88,68 | −26,91 | 1,1710 | −0,5799 | |||
| DPZ / Domino's Pizza, Inc. | 0,19 | −5,31 | 86,46 | −7,13 | 1,1416 | −0,2018 | |||
| PLMR / Palomar Holdings, Inc. | 0,56 | −16,92 | 86,31 | −6,52 | 1,1397 | −0,1926 | |||
| AXON / Axon Enterprise, Inc. | 0,10 | −38,84 | 85,83 | −3,72 | 1,1333 | −0,1531 | |||
| IRTC / iRhythm Technologies, Inc. | 0,55 | 6,21 | 85,13 | 56,21 | 1,1240 | 0,3377 | |||
| VRNS / Varonis Systems, Inc. | 1,67 | 4,10 | 84,77 | 30,61 | 1,1194 | 0,1828 | |||
| BWXT / BWX Technologies, Inc. | 0,59 | 12,15 | 84,62 | 63,78 | 1,1173 | 0,3718 | |||
| VRSK / Verisk Analytics, Inc. | 0,27 | −17,88 | 84,07 | −14,05 | 1,1101 | −0,3013 | |||
| TYL / Tyler Technologies, Inc. | 0,14 | −5,67 | 84,01 | −3,81 | 1,1093 | −0,1510 | |||
| TOST / Toast, Inc. | 1,89 | −7,55 | 83,81 | 23,44 | 1,1066 | 0,1269 | |||
| RMD / ResMed Inc. | 0,32 | −9,42 | 83,66 | 4,40 | 1,1047 | −0,0516 | |||
| VRT / Vertiv Holdings Co | 0,64 | −5,08 | 81,58 | 68,83 | 1,0772 | 0,3799 | |||
| EVR / Evercore Inc. | 0,30 | 4,64 | 80,60 | 41,47 | 1,0642 | 0,2421 | |||
| BOOT / Boot Barn Holdings, Inc. | 0,53 | 13,38 | 80,27 | 60,42 | 1,0599 | 0,3379 | |||
| PIPR / Piper Sandler Companies | 0,28 | 11,59 | 77,70 | 25,23 | 1,0259 | 0,1307 | |||
| MTSI / MACOM Technology Solutions Holdings, Inc. | 0,54 | 8,35 | 77,36 | 54,67 | 1,0215 | 0,2997 | |||
| KNSL / Kinsale Capital Group, Inc. | 0,16 | −16,38 | 76,75 | −16,86 | 1,0134 | −0,3187 | |||
| DXCM / DexCom, Inc. | 0,88 | 4,37 | 76,63 | 33,41 | 1,0118 | 0,1830 | |||
| BRBR / BellRing Brands, Inc. | 1,31 | −6,11 | 75,65 | −26,95 | 0,9989 | −0,4955 | |||
| BFAM / Bright Horizons Family Solutions Inc. | 0,59 | −4,03 | 72,69 | −6,64 | 0,9598 | −0,1636 | |||
| LGND / Ligand Pharmaceuticals Incorporated | 0,60 | −0,40 | 68,76 | 7,69 | 0,9079 | −0,0134 | |||
| HALO / Halozyme Therapeutics, Inc. | 1,29 | −3,37 | 67,21 | −21,22 | 0,8874 | −0,3436 | |||
| RGEN / Repligen Corporation | 0,52 | −3,09 | 65,03 | −5,27 | 0,8587 | −0,1319 | |||
| PTC / PTC Inc. | 0,37 | −5,19 | 63,27 | 5,45 | 0,8354 | −0,0304 | |||
| PSTG / Pure Storage, Inc. | 1,09 | −4,64 | 62,74 | 24,03 | 0,8285 | 0,0985 | |||
| CSGP / CoStar Group, Inc. | 0,77 | 4,66 | 62,17 | 6,21 | 0,8209 | −0,0238 | |||
| ICLR / ICON Public Limited Company | 0,41 | −3,26 | 60,34 | −19,59 | 0,7967 | −0,2861 | |||
| ROK / Rockwell Automation, Inc. | 0,17 | −6,64 | 57,11 | 20,03 | 0,7542 | 0,0675 | |||
| TSCO / Tractor Supply Company | 1,08 | −6,62 | 56,90 | −10,57 | 0,7513 | −0,1668 | |||
| SITE / SiteOne Landscape Supply, Inc. | 0,46 | −2,01 | 55,85 | −2,41 | 0,7375 | −0,0884 | |||
| IDXX / IDEXX Laboratories, Inc. | 0,10 | −7,23 | 55,43 | 18,48 | 0,7319 | 0,0568 | |||
| CIEN / Ciena Corporation | 0,67 | −1,42 | 54,58 | 32,67 | 0,7207 | 0,1271 | |||
| MCHP / Microchip Technology Incorporated | 0,77 | −0,86 | 54,06 | 44,12 | 0,7138 | 0,1725 | |||
| ASO / Academy Sports and Outdoors, Inc. | 1,18 | 23,94 | 52,76 | 21,76 | 0,6967 | 0,0714 | |||
| MGY / Magnolia Oil & Gas Corporation | 2,30 | −4,90 | 51,61 | −15,36 | 0,6814 | −0,1984 | |||
| CWAN / Clearwater Analytics Holdings, Inc. | 2,29 | 32,92 | 50,14 | 8,77 | 0,6621 | −0,0032 | |||
| AZEK / The AZEK Company Inc. | 0,92 | −0,18 | 50,07 | 10,97 | 0,6611 | 0,0100 | |||
| SUPN / Supernus Pharmaceuticals, Inc. | 1,58 | −9,05 | 49,84 | −12,47 | 0,6580 | −0,1635 | |||
| RDDT / Reddit, Inc. | 0,33 | 35,01 | 49,73 | 93,79 | 0,6566 | 0,2863 | |||
| HUBB / Hubbell Incorporated | 0,12 | −5,90 | 49,25 | 16,14 | 0,6503 | 0,0384 | |||
| ECPG / Encore Capital Group, Inc. | 1,25 | 9,12 | 48,34 | 23,22 | 0,6383 | 0,0722 | |||
| OKTA / Okta, Inc. | 0,46 | −7,44 | 46,18 | −12,06 | 0,6098 | −0,1480 | |||
| SLAB / Silicon Laboratories Inc. | 0,31 | 9,44 | 46,07 | 43,27 | 0,6083 | 0,1443 | |||
| FN / Fabrinet | 0,16 | −1,24 | 45,77 | 47,35 | 0,6044 | 0,1561 | |||
| AR / Antero Resources Corporation | 1,13 | −5,04 | 45,70 | −5,42 | 0,6034 | −0,0938 | |||
| SDGR / Schrödinger, Inc. | 2,26 | 14,79 | 45,50 | 17,00 | 0,6008 | 0,0396 | |||
| AAON / AAON, Inc. | 0,61 | 0,76 | 44,80 | −4,88 | 0,5915 | −0,0881 | |||
| VNOM / Viper Energy, Inc. | 1,17 | −24,37 | 44,78 | −36,13 | 0,5913 | −0,4205 | |||
| BCPC / Balchem Corporation | 0,28 | −0,11 | 43,84 | −4,20 | 0,5789 | −0,0815 | |||
| TECH / Bio-Techne Corporation | 0,85 | 3,39 | 43,50 | −9,27 | 0,5744 | −0,1175 | |||
| NTNX / Nutanix, Inc. | 0,56 | −6,91 | 42,78 | 1,93 | 0,5649 | −0,0408 | |||
| PODD / Insulet Corporation | 0,13 | 11,79 | 42,05 | 33,75 | 0,5553 | 0,1016 | |||
| LSCC / Lattice Semiconductor Corporation | 0,86 | −3,36 | 42,02 | −9,73 | 0,5548 | −0,1169 | |||
| MEDP / Medpace Holdings, Inc. | 0,13 | −2,26 | 41,99 | 0,68 | 0,5544 | −0,0474 | |||
| POWI / Power Integrations, Inc. | 0,75 | 1,49 | 41,92 | 12,34 | 0,5536 | 0,0151 | |||
| MNDY / monday.com Ltd. | 0,13 | −5,58 | 41,43 | 22,11 | 0,5470 | 0,0575 | |||
| HOLX / Hologic, Inc. | 0,61 | −19,78 | 39,99 | −15,37 | 0,5280 | −0,1538 | |||
| TREX / Trex Company, Inc. | 0,73 | −2,55 | 39,50 | −8,79 | 0,5216 | −0,1033 | |||
| GMED / Globus Medical, Inc. | 0,65 | 0,55 | 38,28 | −18,93 | 0,5054 | −0,1759 | |||
| SG / Sweetgreen, Inc. | 2,57 | 89,51 | 38,20 | 12,71 | 0,5045 | 0,0153 | |||
| S / SentinelOne, Inc. | 1,96 | −1,08 | 35,86 | −0,54 | 0,4736 | −0,0468 | |||
| U / Unity Software Inc. | 1,47 | 77,63 | 35,49 | 119,44 | 0,4686 | 0,2352 | |||
| DT / Dynatrace, Inc. | 0,64 | 12,57 | 35,22 | 31,81 | 0,4650 | 0,0795 | |||
| SAIL / SailPoint, Inc. | 1,51 | 22,27 | 34,60 | 49,08 | 0,4569 | 0,1220 | |||
| MMS / Maximus, Inc. | 0,48 | 6,31 | 33,97 | 9,45 | 0,4485 | 0,0007 | |||
| GNRC / Generac Holdings Inc. | 0,23 | −4,47 | 33,57 | 8,02 | 0,4433 | −0,0052 | |||
| TENB / Tenable Holdings, Inc. | 0,98 | 2,77 | 33,16 | −0,76 | 0,4378 | −0,0443 | |||
| IBP / Installed Building Products, Inc. | 0,18 | −1,01 | 33,07 | 4,11 | 0,4367 | −0,0217 | |||
| BRZE / Braze, Inc. | 1,17 | 45,93 | 32,87 | 13,65 | 0,4341 | 0,0167 | |||
| SPOT / Spotify Technology S.A. | 0,04 | −29,44 | 32,82 | −1,56 | 0,4333 | −0,0477 | |||
| AMBA / Ambarella, Inc. | 0,49 | −1,17 | 32,63 | 29,73 | 0,4309 | 0,0679 | |||
| POOL / Pool Corporation | 0,11 | −4,47 | 32,60 | −12,53 | 0,4305 | −0,1074 | |||
| MGNI / Magnite, Inc. | 1,35 | 42,02 | 32,56 | 200,24 | 0,4300 | 0,2735 | |||
| VIK / Viking Holdings Ltd | 0,61 | 32,43 | 0,4282 | 0,4282 | |||||
| TNDM / Tandem Diabetes Care, Inc. | 1,74 | 1,81 | 32,39 | −0,95 | 0,4277 | −0,0442 | |||
| GTLB / GitLab Inc. | 0,71 | −4,67 | 32,01 | −8,50 | 0,4226 | −0,0821 | |||
| CGNX / Cognex Corporation | 0,99 | −4,22 | 31,56 | 1,85 | 0,4167 | −0,0304 | |||
| DRS / Leonardo DRS, Inc. | 0,68 | −12,22 | 31,51 | 24,09 | 0,4161 | 0,0496 | |||
| SAIA / Saia, Inc. | 0,11 | 4,30 | 31,18 | −18,22 | 0,4117 | −0,1384 | |||
| KRNT / Kornit Digital Ltd. | 1,53 | 12,82 | 30,40 | 17,72 | 0,4014 | 0,0288 | |||
| JBHT / J.B. Hunt Transport Services, Inc. | 0,21 | −6,49 | 29,86 | −9,24 | 0,3943 | −0,0805 | |||
| EXAS / Exact Sciences Corporation | 0,53 | 28,17 | 0,3719 | 0,3719 | |||||
| ILMN / Illumina, Inc. | 0,28 | −5,56 | 26,64 | 13,57 | 0,3517 | 0,0133 | |||
| AZTA / Azenta, Inc. | 0,81 | 0,42 | 24,84 | −10,77 | 0,3281 | −0,0737 | |||
| VIRT / Virtu Financial, Inc. | 0,55 | 12,89 | 24,55 | 32,64 | 0,3242 | 0,0571 | |||
| ANSS / ANSYS, Inc. | 0,07 | −7,72 | 24,24 | 2,39 | 0,3201 | −0,0216 | |||
| CPRT / Copart, Inc. | 0,48 | −17,59 | 23,50 | −28,54 | 0,3103 | −0,1642 | |||
| EZPW / EZCORP, Inc. | 1,67 | 0,11 | 23,21 | −5,60 | 0,3065 | −0,0483 | |||
| VSEC / VSE Corporation | 0,18 | −0,02 | 22,99 | 9,14 | 0,3035 | −0,0004 | |||
| CDNS / Cadence Design Systems, Inc. | 0,07 | −25,13 | 21,92 | −9,29 | 0,2894 | −0,0592 | |||
| PCOR / Procore Technologies, Inc. | 0,31 | 20,88 | 0,2757 | 0,2757 | |||||
| RBRK / Rubrik, Inc. | 0,23 | −10,86 | 20,57 | 30,96 | 0,2717 | 0,0450 | |||
| DSGX / The Descartes Systems Group Inc. | 0,20 | −0,28 | 20,39 | 0,53 | 0,2692 | −0,0235 | |||
| LASR / nLIGHT, Inc. | 1,03 | 13,68 | 20,36 | 187,92 | 0,2688 | 0,1668 | |||
| ROST / Ross Stores, Inc. | 0,16 | −14,32 | 20,32 | −14,47 | 0,2683 | −0,0745 | |||
| FAST / Fastenal Company | 0,45 | 88,00 | 18,98 | 1,81 | 0,2507 | −0,0184 | |||
| VST / Vistra Corp. | 0,10 | −18,13 | 18,60 | 35,11 | 0,2455 | 0,0469 | |||
| ONTO / Onto Innovation Inc. | 0,18 | −36,59 | 18,40 | −47,25 | 0,2429 | −0,2604 | |||
| POWL / Powell Industries, Inc. | 0,08 | 13,80 | 17,72 | 40,61 | 0,2340 | 0,0521 | |||
| KRMN / Karman Holdings Inc. | 0,35 | 32,66 | 17,47 | 99,95 | 0,2307 | 0,1046 | |||
| SMPL / The Simply Good Foods Company | 0,54 | 28,50 | 17,08 | 17,70 | 0,2255 | 0,0161 | |||
| VEEV / Veeva Systems Inc. | 0,06 | −17,43 | 16,73 | 2,66 | 0,2209 | −0,0142 | |||
| RVLV / Revolve Group, Inc. | 0,82 | 28,60 | 16,40 | 19,99 | 0,2166 | 0,0193 | |||
| LHX / L3Harris Technologies, Inc. | 0,06 | −17,80 | 15,70 | −1,49 | 0,2073 | −0,0227 | |||
| PRO / PROS Holdings, Inc. | 0,99 | −10,00 | 15,53 | −25,94 | 0,2050 | −0,0975 | |||
| AGYS / Agilysys, Inc. | 0,13 | 33,03 | 15,18 | 110,25 | 0,2004 | 0,0962 | |||
| MRVL / Marvell Technology, Inc. | 0,19 | −30,89 | 14,79 | −13,12 | 0,1953 | −0,0504 | |||
| SPSC / SPS Commerce, Inc. | 0,11 | 0,07 | 14,73 | 2,60 | 0,1945 | −0,0127 | |||
| ZETA / Zeta Global Holdings Corp. | 0,94 | 15,60 | 14,48 | 32,06 | 0,1913 | 0,0330 | |||
| MEG / Montrose Environmental Group, Inc. | 0,66 | 44,59 | 14,38 | 121,97 | 0,1898 | 0,0964 | |||
| BKR / Baker Hughes Company | 0,35 | −18,15 | 13,35 | −28,60 | 0,1763 | −0,0935 | |||
| LNN / Lindsay Corporation | 0,09 | 7,65 | 13,33 | 22,74 | 0,1760 | 0,0193 | |||
| XMTR / Xometry, Inc. | 0,39 | 13,29 | 0,1755 | 0,1755 | |||||
| COHR / Coherent Corp. | 0,15 | −8,67 | 13,24 | 25,46 | 0,1748 | 0,0225 | |||
| ROP / Roper Technologies, Inc. | 0,02 | −18,64 | 12,96 | −21,78 | 0,1711 | −0,0679 | |||
| RMBS / Rambus Inc. | 0,20 | 0,75 | 12,49 | 24,59 | 0,1649 | 0,0203 | |||
| FWRG / First Watch Restaurant Group, Inc. | 0,77 | 8,51 | 12,33 | 4,53 | 0,1629 | −0,0074 | |||
| FTNT / Fortinet, Inc. | 0,12 | −18,74 | 12,25 | −10,76 | 0,1617 | −0,0363 | |||
| ADSK / Autodesk, Inc. | 0,04 | −14,98 | 11,68 | 0,53 | 0,1542 | −0,0134 | |||
| BLFS / BioLife Solutions, Inc. | 0,53 | 6,94 | 11,45 | 0,85 | 0,1512 | −0,0126 | |||
| PANW / Palo Alto Networks, Inc. | 0,06 | −18,00 | 11,29 | −1,66 | 0,1491 | −0,0166 | |||
| HSIC / Henry Schein, Inc. | 0,14 | −15,31 | 10,57 | −9,68 | 0,1396 | −0,0293 | |||
| TER / Teradyne, Inc. | 0,12 | −15,80 | 10,56 | −8,34 | 0,1395 | −0,0268 | |||
| HUBG / Hub Group, Inc. | 0,31 | 0,18 | 10,49 | −9,90 | 0,1386 | −0,0295 | |||
| CRWD / CrowdStrike Holdings, Inc. | 0,02 | −38,64 | 10,16 | −11,36 | 0,1342 | −0,0313 | |||
| KEYS / Keysight Technologies, Inc. | 0,06 | −15,98 | 10,15 | −8,08 | 0,1341 | −0,0253 | |||
| FANG / Diamondback Energy, Inc. | 0,07 | −23,14 | 9,88 | −33,95 | 0,1305 | −0,0854 | |||
| CRDO / Credo Technology Group Holding Ltd | 0,10 | 9,25 | 0,1222 | 0,1222 | |||||
| HSTM / HealthStream, Inc. | 0,32 | 0,30 | 8,84 | −13,75 | 0,1167 | −0,0312 | |||
| MDB / MongoDB, Inc. | 0,04 | −15,90 | 8,46 | 0,68 | 0,1118 | −0,0095 | |||
| GLBE / Global-E Online Ltd. | 0,24 | 38,52 | 7,90 | 30,30 | 0,1043 | 0,0168 | |||
| GENI / Genius Sports Limited | 0,75 | 7,84 | 0,1036 | 0,1036 | |||||
| TITN / Titan Machinery Inc. | 0,38 | 7,61 | 0,1004 | 0,1004 | |||||
| SEI / Solaris Energy Infrastructure, Inc. | 0,27 | 0,97 | 7,59 | 31,27 | 0,1002 | 0,0168 | |||
| GPOR / Gulfport Energy Corporation | 0,04 | 7,49 | 0,0989 | 0,0989 | |||||
| BROS / Dutch Bros Inc. | 0,11 | 7,28 | 0,0961 | 0,0961 | |||||
| PAR / PAR Technology Corporation | 0,10 | 7,14 | 0,0943 | 0,0943 | |||||
| INTA / Intapp, Inc. | 0,12 | −35,84 | 6,38 | −43,26 | 0,0842 | −0,0780 | |||
| FOLD / Amicus Therapeutics, Inc. | 0,83 | 35,95 | 4,77 | −4,52 | 0,0630 | −0,0091 | |||
| SLP / Simulations Plus, Inc. | 0,27 | 4,69 | 0,0619 | 0,0619 | |||||
| CHEF / The Chefs' Warehouse, Inc. | 0,07 | −66,56 | 4,37 | −60,82 | 0,0577 | −0,1032 | |||
| PI / Impinj, Inc. | 0,04 | 3,97 | 0,0525 | 0,0525 | |||||
| MSFT / Microsoft Corporation | 0,00 | −2,34 | 1,23 | 29,46 | 0,0162 | 0,0025 | |||
| NVDD / Direxion Shares ETF Trust - Direxion Daily NVDA Bear 1X Shares | 0,01 | 0,00 | 1,10 | 45,68 | 0,0145 | 0,0036 | |||
| TSM / Taiwan Semiconductor Manufacturing Company Limited - Depositary Receipt (Common Stock) | 0,00 | 0,00 | 0,81 | 36,59 | 0,0107 | 0,0021 | |||
| AMZN / Amazon.com, Inc. | 0,00 | 0,00 | 0,74 | 15,36 | 0,0097 | 0,0005 | |||
| PLTR / Palantir Technologies Inc. | 0,00 | −98,52 | 0,58 | −97,61 | 0,0076 | −0,3405 | |||
| MELI / MercadoLibre, Inc. | 0,00 | 0,00 | 0,56 | 33,98 | 0,0074 | 0,0014 | |||
| META / Meta Platforms, Inc. | 0,00 | 34,54 | 0,52 | 72,19 | 0,0069 | 0,0025 | |||
| CME / CME Group Inc. | 0,00 | 0,00 | 0,34 | 3,63 | 0,0045 | −0,0002 | |||
| GOOGL / Alphabet Inc. | 0,00 | −12,57 | 0,34 | −0,29 | 0,0045 | −0,0004 | |||
| TJX / The TJX Companies, Inc. | 0,00 | 0,00 | 0,33 | 1,56 | 0,0043 | −0,0003 | |||
| RTX / RTX Corporation | 0,00 | 0,00 | 0,31 | 10,11 | 0,0040 | 0,0000 | |||
| ASML / ASML Holding N.V. - Depositary Receipt (Common Stock) | 0,00 | 0,00 | 0,29 | 20,92 | 0,0038 | 0,0004 | |||
| SHOP / Shopify Inc. | 0,00 | 0,26 | 0,0034 | 0,0034 | |||||
| SPGI / S&P Global Inc. | 0,00 | 0,00 | 0,25 | 4,10 | 0,0034 | −0,0002 | |||
| ISRG / Intuitive Surgical, Inc. | 0,00 | 0,00 | 0,25 | 10,04 | 0,0033 | 0,0000 | |||
| GLOB / Globant S.A. | 0,00 | −100,00 | 0,00 | 0,0000 | |||||
| NEOG / Neogen Corporation | 0,00 | −100,00 | 0,00 | 0,0000 |