Grunnleggende statistikk
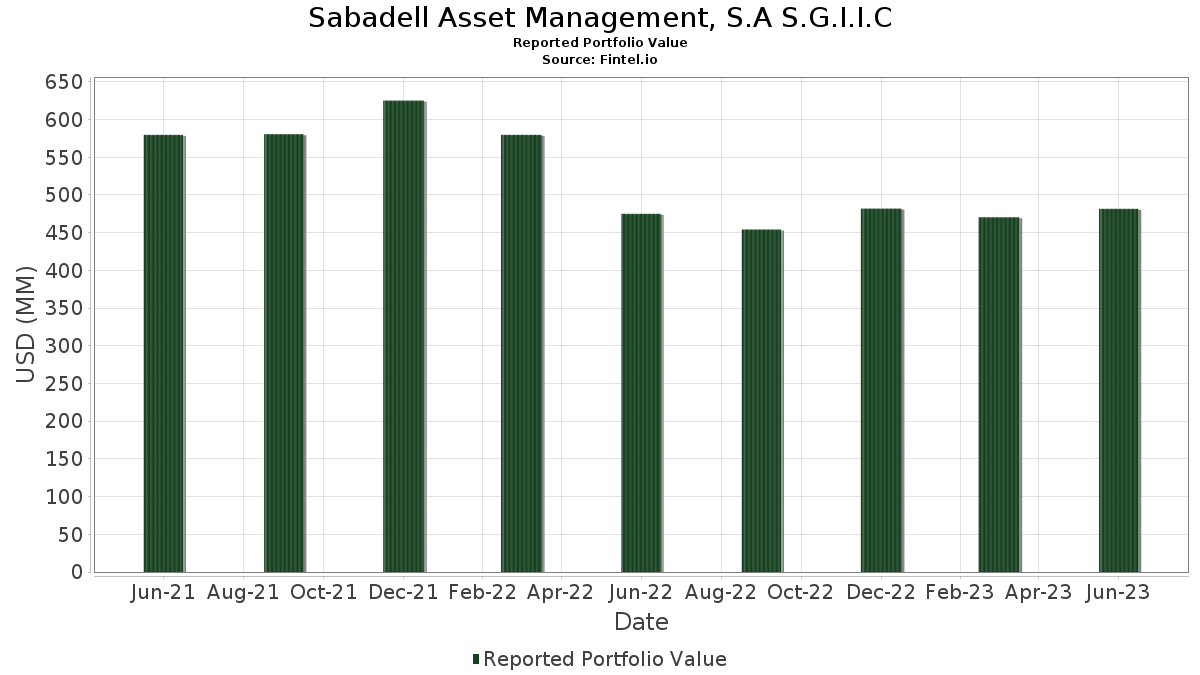
| Porteføljeverdi | $ 481 640 873 |
| Nåværende posisjoner | 98 |
Siste beholdninger, prestasjoner, forvaltet kapital (fra 13F, 13D)
Sabadell Asset Management, S.A S.G.I.I.C har oppgitt 98 totale beholdninger i sine siste SEC-arkiveringer. Siste porteføljeverdi er beregnet til 481 640 873 USD. Faktisk forvaltet kapital (AUM) er denne verdien pluss kontanter (som ikke er oppgitt). Sabadell Asset Management, S.A S.G.I.I.Cs største beholdninger er Microsoft Corporation (US:MSFT) , Meta Platforms, Inc. (US:META) , Apple Inc. (US:AAPL) , Amazon.com, Inc. (US:AMZN) , and Alphabet Inc. (US:GOOGL) . Sabadell Asset Management, S.A S.G.I.I.Cs nye posisjoner inkluderer Alcon Inc. (US:ALC) , .
De største økningene dette kvartalet
Vi bruker endringen i porteføljeallokeringen fordi dette er det mest meningsfulle målet. Endringer kan skyldes handler eller endringer i aksjekursene.
| Verdipapirer | Aksjer (MM) |
Verdi (MM$) |
Portefølje % | ΔPortefølje % |
|---|---|---|---|---|
| 0,12 | 14,35 | 2,9785 | 1,8862 | |
| 0,07 | 9,92 | 1,9747 | 1,7530 | |
| 0,10 | 8,85 | 1,8366 | 0,9030 | |
| 0,18 | 9,76 | 2,0262 | 0,8438 | |
| 0,11 | 14,41 | 2,9923 | 0,5931 | |
| 0,03 | 12,56 | 2,6076 | 0,5371 | |
| 0,13 | 7,42 | 1,5414 | 0,5272 | |
| 0,11 | 20,93 | 4,3456 | 0,4996 | |
| 0,20 | 12,28 | 2,5487 | 0,4557 | |
| 0,22 | 10,07 | 2,0905 | 0,4374 |
De største reduksjonene dette kvartalet
Vi bruker endringen i porteføljeallokeringen fordi dette er det mest meningsfulle målet. Endringer kan skyldes handler eller endringer i aksjekurser.
| Verdipapirer | Aksjer (MM) |
Verdi (MM$) |
Portefølje % | ΔPortefølje % |
|---|---|---|---|---|
| 0,02 | 1,26 | 0,2622 | −1,4152 | |
| 0,01 | 1,04 | 0,2164 | −1,0712 | |
| 0,04 | 3,97 | 0,8250 | −0,9740 | |
| 0,00 | 0,00 | −0,7574 | ||
| 0,00 | 0,00 | −0,7420 | ||
| 0,17 | 7,29 | 1,5141 | −0,7392 | |
| 0,08 | 22,81 | 4,7353 | −0,7363 | |
| 0,00 | 0,00 | −0,7194 | ||
| 0,04 | 7,22 | 1,4986 | −0,4607 | |
| 0,04 | 10,32 | 2,1417 | −0,3493 |
13F- og Fondsarkiveringer
Dette skjemaet ble sendt inn den 2024-01-23 for rapporteringsperioden 2023-06-30. Klikk på lenkeikonet for å se hele transaksjonshistorikken.
Oppgradere for å låse opp premiedata og eksportere til Excel![]() .
.
| Verdipapirer | Type | Gjennomsnittlig aksjekurs | Aksjer (MM) |
ΔAksjer (%) |
ΔAksjer (%) |
Verdi ($MM) |
Portefølje (%) |
ΔPortefølje (%) |
|
|---|---|---|---|---|---|---|---|---|---|
| MSFT / Microsoft Corporation | 0,09 | −14,82 | 29,47 | 1,25 | 6,1182 | −0,0683 | |||
| META / Meta Platforms, Inc. | 0,08 | −34,48 | 22,81 | −11,39 | 4,7353 | −0,7363 | |||
| AAPL / Apple Inc. | 0,11 | −1,57 | 20,93 | 15,69 | 4,3456 | 0,4996 | |||
| AMZN / Amazon.com, Inc. | 0,11 | −0,86 | 14,41 | 27,69 | 2,9923 | 0,5931 | |||
| GOOGL / Alphabet Inc. | 0,12 | 143,05 | 14,35 | 179,19 | 2,9785 | 1,8862 | |||
| GOOGL / Alphabet Inc. | 0,12 | −0,77 | 14,24 | 13,89 | 2,9562 | 0,2986 | |||
| NFLX / Netflix, Inc. | 0,03 | 0,00 | 12,56 | 28,94 | 2,6076 | 0,5371 | |||
| KO / The Coca-Cola Company | 0,20 | 29,24 | 12,28 | 24,68 | 2,5487 | 0,4557 | |||
| MRK / Merck & Co., Inc. | 0,10 | −4,97 | 11,70 | −2,91 | 2,4301 | −0,1327 | |||
| AMD / Advanced Micro Devices, Inc. | 0,10 | −4,34 | 11,63 | 19,69 | 2,4143 | 0,3491 | |||
| HD / The Home Depot, Inc. | 0,04 | −5,69 | 11,26 | 1,28 | 2,3387 | −0,0254 | |||
| AMT / American Tower Corporation | 0,06 | −4,98 | 10,99 | −9,46 | 2,2828 | −0,2986 | |||
| AEM / Agnico Eagle Mines Limited | 0,21 | 34,67 | 10,37 | 21,66 | 2,0641 | 0,3257 | |||
| V / Visa Inc. | 0,04 | −15,60 | 10,32 | −11,97 | 2,1417 | −0,3493 | |||
| PFE / Pfizer Inc. | 0,28 | 12,48 | 10,14 | −0,79 | 2,1061 | −0,0673 | |||
| BK / The Bank of New York Mellon Corporation | 0,22 | 28,93 | 10,07 | 29,48 | 2,0905 | 0,4374 | |||
| PG / The Procter & Gamble Company | 0,07 | 805,47 | 9,92 | 813,26 | 1,9747 | 1,7530 | |||
| BSX / Boston Scientific Corporation | 0,18 | 66,28 | 9,76 | 75,44 | 2,0262 | 0,8438 | |||
| ADBE / Adobe Inc. | 0,02 | −30,63 | 9,32 | −11,89 | 1,9348 | −0,3136 | |||
| T / AT&T Inc. | 0,57 | 28,00 | 9,14 | 3,79 | 1,8986 | 0,0257 | |||
| ICE / Intercontinental Exchange, Inc. | 0,08 | −4,97 | 8,95 | 1,03 | 1,8573 | −0,0248 | |||
| AEP / American Electric Power Company, Inc. | 0,10 | 33,98 | 8,92 | 20,91 | 1,8528 | 0,2839 | |||
| MDT / Medtronic plc | 0,10 | 85,54 | 8,85 | 101,43 | 1,8366 | 0,9030 | |||
| CRM / Salesforce, Inc. | 0,04 | −2,31 | 7,49 | 5,87 | 1,5545 | 0,0511 | |||
| NATI / National Instruments Corp. | 0,13 | 42,42 | 7,42 | 55,62 | 1,5414 | 0,5272 | |||
| IBM / International Business Machines Corporation | 0,05 | −4,74 | 7,35 | −3,65 | 1,5256 | −0,0953 | |||
| DHR / Danaher Corporation | 0,03 | −3,20 | 7,32 | −7,46 | 1,4568 | −0,1563 | |||
| CMCSA / Comcast Corporation | 0,17 | −37,53 | 7,29 | −31,21 | 1,5141 | −0,7392 | |||
| EL / The Estée Lauder Companies Inc. | 0,04 | −5,30 | 7,22 | −21,69 | 1,4986 | −0,4607 | |||
| BKR / Baker Hughes Company | 0,23 | −3,65 | 7,17 | 4,84 | 1,4895 | 0,0349 | |||
| HPE / Hewlett Packard Enterprise Company | 0,42 | 18,11 | 7,07 | 24,05 | 1,4682 | 0,2564 | |||
| NEE / NextEra Energy, Inc. | 0,09 | −2,60 | 6,78 | −7,51 | 1,4085 | −0,1507 | |||
| CB / Chubb Limited | 0,03 | −5,11 | 6,65 | −6,89 | 1,3800 | −0,1375 | |||
| CME / CME Group Inc. | 0,03 | −6,51 | 5,66 | −10,83 | 1,1746 | −0,1741 | |||
| ETN / Eaton Corporation plc | 0,03 | −7,90 | 5,31 | 16,62 | 1,1029 | 0,1345 | |||
| CNC / Centene Corporation | 0,07 | 67,56 | 5,00 | 71,62 | 1,0384 | 0,4188 | |||
| ADSK / Autodesk, Inc. | 0,02 | −5,59 | 4,88 | −2,66 | 1,0126 | −0,0524 | |||
| TJX / The TJX Companies, Inc. | 0,05 | −4,63 | 4,57 | 2,93 | 0,9482 | 0,0052 | |||
| SLB / Schlumberger Limited | 0,09 | −5,11 | 4,38 | −7,42 | 0,9098 | −0,0963 | |||
| DIS / The Walt Disney Company | 0,04 | −48,17 | 3,97 | −53,05 | 0,8250 | −0,9740 | |||
| CDW / CDW Corporation | 0,02 | −4,45 | 3,53 | −6,89 | 0,7329 | −0,0728 | |||
| ROK / Rockwell Automation, Inc. | 0,01 | −4,67 | 3,51 | 14,95 | 0,7295 | 0,0799 | |||
| MU / Micron Technology, Inc. | 0,05 | −1,14 | 3,49 | 10,77 | 0,7239 | 0,0549 | |||
| AER / AerCap Holdings N.V. | 0,05 | −5,02 | 3,40 | 11,95 | 0,7063 | 0,0604 | |||
| LVS / Las Vegas Sands Corp. | 0,06 | −4,68 | 3,28 | −1,24 | 0,6807 | −0,0250 | |||
| JCI / Johnson Controls International plc | 0,05 | −4,76 | 3,27 | 15,71 | 0,6791 | 0,1024 | |||
| ROST / Ross Stores, Inc. | 0,03 | −2,14 | 3,22 | 2,16 | 0,6686 | −0,0015 | |||
| ULTA / Ulta Beauty, Inc. | 0,01 | −5,06 | 3,12 | −15,15 | 0,6487 | −0,1341 | |||
| OGN / Organon & Co. | 0,14 | −2,14 | 2,78 | −14,84 | 0,5531 | −0,1124 | |||
| ALNY / Alnylam Pharmaceuticals, Inc. | 0,01 | −6,57 | 2,78 | −11,76 | 0,5767 | −0,0923 | |||
| PSTG / Pure Storage, Inc. | 0,07 | −43,68 | 2,61 | −17,49 | 0,5416 | −0,1304 | |||
| MA / Mastercard Incorporated | 0,01 | 0,00 | 2,35 | 8,29 | 0,4883 | 0,0266 | |||
| UNH / UnitedHealth Group Incorporated | 0,00 | 0,00 | 1,99 | −6,18 | 0,4130 | −0,0376 | |||
| CVX / Chevron Corporation | 0,01 | 0,00 | 1,78 | −7,43 | 0,3698 | −0,0393 | |||
| AVGO / Broadcom Inc. | 0,00 | −12,74 | 1,70 | 21,55 | 0,3527 | 0,0557 | |||
| RACE / Ferrari N.V. | 0,01 | −15,75 | 1,68 | 1,51 | 0,3480 | −0,0031 | |||
| JPM / JPMorgan Chase & Co. | 0,01 | 0,00 | 1,64 | 14,88 | 0,3273 | 0,0354 | |||
| LLY / Eli Lilly and Company | 0,00 | 0,00 | 1,53 | 27,33 | 0,3184 | 0,0625 | |||
| BAC / Bank of America Corporation | 0,05 | 2,74 | 1,46 | 8,53 | 0,3038 | 0,0172 | |||
| COST / Costco Wholesale Corporation | 0,00 | 0,00 | 1,36 | 8,79 | 0,2830 | 0,0168 | |||
| ADI / Analog Devices, Inc. | 0,01 | 0,00 | 1,36 | 2,11 | 0,2820 | −0,0008 | |||
| YUMC / Yum China Holdings, Inc. | 0,02 | −10,58 | 1,31 | −17,83 | 0,2607 | −0,0645 | |||
| CSX / CSX Corporation | 0,04 | 0,00 | 1,29 | 17,21 | 0,2687 | 0,0341 | |||
| MCD / McDonald's Corporation | 0,00 | −6,91 | 1,27 | −2,68 | 0,2637 | −0,0137 | |||
| CSCO / Cisco Systems, Inc. | 0,02 | −84,00 | 1,26 | −84,01 | 0,2622 | −1,4152 | |||
| PEP / PepsiCo, Inc. | 0,01 | 0,00 | 1,21 | 1,00 | 0,2520 | −0,0033 | |||
| SYY / Sysco Corporation | 0,02 | 1,21 | 0,2512 | 0,2512 | |||||
| JNJ / Johnson & Johnson | 0,01 | 10,46 | 1,21 | 8,94 | 0,2504 | 0,0151 | |||
| SYK / Stryker Corporation | 0,00 | −12,43 | 1,20 | −9,42 | 0,2497 | −0,0325 | |||
| C.WSA / Citigroup, Inc. | 0,00 | 0,00 | 1,20 | 5,72 | 0,2497 | 0,0079 | |||
| VLO / Valero Energy Corporation | 0,01 | 0,00 | 1,19 | −13,05 | 0,2477 | −0,0440 | |||
| UNP / Union Pacific Corporation | 0,01 | 0,00 | 1,19 | 6,14 | 0,2476 | 0,0088 | |||
| NKE / NIKE, Inc. | 0,01 | 21,31 | 1,17 | 9,42 | 0,2437 | 0,0158 | |||
| IBN / ICICI Bank Limited - Depositary Receipt (Common Stock) | 0,05 | 0,00 | 1,13 | 7,96 | 0,2339 | 0,0121 | |||
| ACN / Accenture plc | 0,00 | 0,00 | 1,11 | 10,55 | 0,2213 | 0,0162 | |||
| AMGN / Amgen Inc. | 0,00 | 15,84 | 1,11 | 2,88 | 0,2303 | 0,0011 | |||
| SBUX / Starbucks Corporation | 0,01 | 0,00 | 1,07 | −5,47 | 0,2224 | −0,0185 | |||
| TGT / Target Corporation | 0,01 | −78,92 | 1,04 | −82,80 | 0,2164 | −1,0712 | |||
| QCOM / QUALCOMM Incorporated | 0,01 | 0,00 | 1,04 | −2,35 | 0,2161 | −0,0106 | |||
| NTES / NetEase, Inc. - Depositary Receipt (Common Stock) | 0,01 | −23,50 | 1,02 | −14,32 | 0,2113 | −0,0411 | |||
| TCOM / Trip.com Group Limited - Depositary Receipt (Common Stock) | 0,03 | −19,25 | 0,99 | −22,57 | 0,1967 | −0,0638 | |||
| TXN / Texas Instruments Incorporated | 0,01 | 0,00 | 0,98 | 1,45 | 0,2031 | −0,0019 | |||
| PRU / Prudential Financial, Inc. | 0,01 | 0,00 | 0,95 | 7,58 | 0,1976 | 0,0096 | |||
| HDB / HDFC Bank Limited - Depositary Receipt (Common Stock) | 0,01 | 0,00 | 0,86 | 4,24 | 0,1788 | 0,0031 | |||
| JD / JD.com, Inc. - Depositary Receipt (Common Stock) | 0,02 | −8,86 | 0,83 | −20,89 | 0,1731 | −0,0509 | |||
| MMYT / MakeMyTrip Limited | 0,02 | 15,50 | 0,64 | 33,20 | 0,1335 | 0,0309 | |||
| EDU / New Oriental Education & Technology Group Inc. - Depositary Receipt (Common Stock) | 0,02 | −29,29 | 0,64 | −25,56 | 0,1319 | −0,0495 | |||
| INFY / Infosys Limited - Depositary Receipt (Common Stock) | 0,04 | −38,05 | 0,62 | −42,32 | 0,1280 | −0,0992 | |||
| BDX / Becton, Dickinson and Company | 0,00 | −17,84 | 0,60 | −14,45 | 0,1242 | −0,0245 | |||
| ITUB / Itaú Unibanco Holding S.A. - Depositary Receipt (Common Stock) | 0,10 | 0,00 | 0,59 | 23,58 | 0,1221 | 0,0210 | |||
| TMO / Thermo Fisher Scientific Inc. | 0,00 | 81,97 | 0,46 | 63,12 | 0,0957 | 0,0356 | |||
| BAX / Baxter International Inc. | 0,01 | 0,00 | 0,43 | 5,62 | 0,0898 | 0,0028 | |||
| STLA / Stellantis N.V. | 0,01 | 0,00 | 0,24 | 1,24 | 0,0507 | −0,0005 | |||
| ALC / Alcon Inc. | 0,00 | 0,21 | 0,0433 | 0,0433 | |||||
| CNHI / CNH Industrial N.V. | 0,01 | 0,00 | 0,20 | 5,76 | 0,0403 | 0,0013 | |||
| MRNA / Moderna, Inc. | 0,00 | 0,00 | 0,17 | −21,10 | 0,0358 | −0,0108 | |||
| YNDX / Yandex N.V. | 0,01 | 0,00 | 0,16 | 0,00 | 0,0335 | −0,0008 | |||
| TAL / TAL Education Group - Depositary Receipt (Common Stock) | 0,01 | −14,92 | 0,05 | −18,18 | 0,0108 | −0,0028 | |||
| BIDU / Baidu, Inc. - Depositary Receipt (Common Stock) | 0,00 | −100,00 | 0,00 | −100,00 | −0,0200 | ||||
| SPR / Spirit AeroSystems Holdings, Inc. | 0,00 | −100,00 | 0,00 | −100,00 | −0,7420 | ||||
| ALL / The Allstate Corporation | 0,00 | −100,00 | 0,00 | −100,00 | −0,0757 | ||||
| UBS / UBS Group AG | 0,00 | −100,00 | 0,00 | −100,00 | −0,0454 | ||||
| TFC / Truist Financial Corporation | 0,00 | −100,00 | 0,00 | −100,00 | −0,2067 | ||||
| IQV / IQVIA Holdings Inc. | 0,00 | −100,00 | 0,00 | −100,00 | −0,7194 | ||||
| CTSH / Cognizant Technology Solutions Corporation | 0,00 | −100,00 | 0,00 | −100,00 | −0,7574 | ||||
| BABA / Alibaba Group Holding Limited - Depositary Receipt (Common Stock) | 0,00 | −100,00 | 0,00 | −100,00 | −0,3431 |