Grunnleggende statistikk
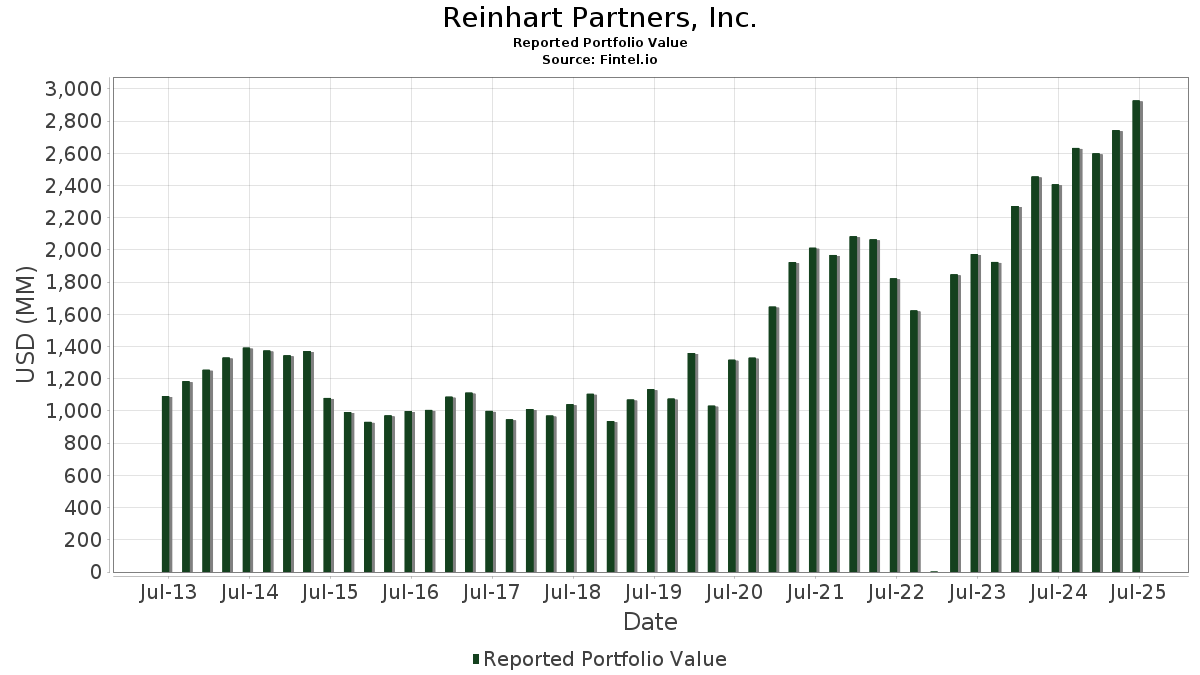
| Porteføljeverdi | $ 2 927 557 163 |
| Nåværende posisjoner | 74 |
Siste beholdninger, prestasjoner, forvaltet kapital (fra 13F, 13D)
Reinhart Partners, Inc. har oppgitt 74 totale beholdninger i sine siste SEC-arkiveringer. Siste porteføljeverdi er beregnet til 2 927 557 163 USD. Faktisk forvaltet kapital (AUM) er denne verdien pluss kontanter (som ikke er oppgitt). Reinhart Partners, Inc.s største beholdninger er First Citizens BancShares, Inc. (US:FCNCA) , Lantheus Holdings, Inc. (US:LNTH) , Silicon Motion Technology Corporation - Depositary Receipt (Common Stock) (US:SIMO) , Frontdoor, Inc. (US:FTDR) , and Modine Manufacturing Company (US:MOD) . Reinhart Partners, Inc.s nye posisjoner inkluderer Independent Bank Corp. (US:INDB) , Marriott International, Inc. (US:MAR) , . Reinhart Partners, Inc.s viktigste bransjer er "Rubber And Miscellaneous Plastics Products" (sic 30) , "Railroad Transportation" (sic 40) , and "Apparel And Accessory Stores" (sic 56) .
De største økningene dette kvartalet
Vi bruker endringen i porteføljeallokeringen fordi dette er det mest meningsfulle målet. Endringer kan skyldes handler eller endringer i aksjekursene.
| Verdipapirer | Aksjer (MM) |
Verdi (MM$) |
Portefølje % | ΔPortefølje % |
|---|---|---|---|---|
| 1,47 | 110,62 | 3,7786 | 1,2639 | |
| 1,09 | 107,52 | 3,6727 | 1,2222 | |
| 0,51 | 31,93 | 1,0906 | 1,0906 | |
| 1,90 | 65,54 | 2,2388 | 1,0470 | |
| 2,14 | 67,54 | 2,3071 | 1,0247 | |
| 1,52 | 105,83 | 3,6149 | 1,0056 | |
| 0,64 | 69,96 | 2,3896 | 0,6924 | |
| 0,09 | 19,08 | 0,6517 | 0,6517 | |
| 0,60 | 58,74 | 2,0064 | 0,5487 | |
| 1,65 | 37,39 | 1,2771 | 0,5103 |
De største reduksjonene dette kvartalet
Vi bruker endringen i porteføljeallokeringen fordi dette er det mest meningsfulle målet. Endringer kan skyldes handler eller endringer i aksjekurser.
| Verdipapirer | Aksjer (MM) |
Verdi (MM$) |
Portefølje % | ΔPortefølje % |
|---|---|---|---|---|
| 1,79 | 107,43 | 3,6697 | −1,1578 | |
| 0,99 | 45,32 | 1,5479 | −1,0521 | |
| 1,08 | 63,34 | 2,1635 | −0,9605 | |
| 1,75 | 95,27 | 3,2543 | −0,5348 | |
| 7,31 | 68,96 | 2,3555 | −0,5041 | |
| 0,28 | 53,35 | 1,8225 | −0,4885 | |
| 0,04 | 74,90 | 2,5584 | −0,4238 | |
| 2,21 | 68,02 | 2,3233 | −0,3931 | |
| 1,40 | 114,90 | 3,9249 | −0,3659 | |
| 1,22 | 74,73 | 2,5526 | −0,3280 |
13D/G-Arkiveringer
Dette er en liste over eventuelle 13D- og 13G-Arkiveringer det siste året. Klikk på lenkeikonet for å se hele transaksjonshistorikken. Grønne rader angir nye posisjoner. Røde rader angir lukkede posisjoner.
| Fil Dato | Skjema | Verdipapirer | Tidligere aksjer |
Nåværende aksjer |
ΔAksjer % | % Eierskap |
% ΔEierskap | |
|---|---|---|---|---|---|---|---|---|
| 2025-08-05 | HLMN / Hillman Solutions Corp. | 10 053 219 | 5,10 | |||||
| 2025-05-15 | AHCO / AdaptHealth Corp. | 7 236 262 | 5,40 | |||||
| 2025-05-15 | MMI / Marcus & Millichap, Inc. | 2 162 935 | 5,60 |
13F- og Fondsarkiveringer
Dette skjemaet ble sendt inn den 2025-07-09 for rapporteringsperioden 2025-06-30. Klikk på lenkeikonet for å se hele transaksjonshistorikken.
Oppgradere for å låse opp premiedata og eksportere til Excel![]() .
.
| Verdipapirer | Type | Gjennomsnittlig aksjekurs | Aksjer (MM) |
ΔAksjer (%) |
ΔAksjer (%) |
Verdi ($MM) |
Portefølje (%) |
ΔPortefølje (%) |
|
|---|---|---|---|---|---|---|---|---|---|
| FCNCA / First Citizens BancShares, Inc. | 0,07 | 4,24 | 135,58 | 10,02 | 4,6310 | 0,1388 | |||
| LNTH / Lantheus Holdings, Inc. | 1,40 | 16,40 | 114,90 | −2,37 | 3,9249 | −0,3659 | |||
| SIMO / Silicon Motion Technology Corporation - Depositary Receipt (Common Stock) | 1,47 | 7,86 | 110,62 | 60,37 | 3,7786 | 1,2639 | |||
| FTDR / Frontdoor, Inc. | 1,87 | −20,90 | 110,44 | 21,35 | 3,7723 | 0,4547 | |||
| MOD / Modine Manufacturing Company | 1,09 | 24,63 | 107,52 | 59,95 | 3,6727 | 1,2222 | |||
| NSP / Insperity, Inc. | 1,79 | 20,41 | 107,43 | −18,87 | 3,6697 | −1,1578 | |||
| ACLS / Axcelis Technologies, Inc. | 1,52 | 5,38 | 105,83 | 47,86 | 3,6149 | 1,0056 | |||
| AGO / Assured Guaranty Ltd. | 1,14 | 0,32 | 99,16 | −0,82 | 3,3870 | −0,2577 | |||
| UHALB / U-Haul Holding Company - Series N | 1,75 | −0,23 | 95,27 | −8,34 | 3,2543 | −0,5348 | |||
| WTFC / Wintrust Financial Corporation | 0,75 | 12,21 | 93,17 | 23,71 | 3,1825 | 0,4368 | |||
| IDCC / InterDigital, Inc. | 0,41 | −0,27 | 91,78 | 8,16 | 3,1352 | 0,0416 | |||
| EEFT / Euronet Worldwide, Inc. | 0,90 | 21,60 | 91,03 | 15,38 | 3,1095 | 0,2333 | |||
| WTM / White Mountains Insurance Group, Ltd. | 0,04 | −1,85 | 74,90 | −8,44 | 2,5584 | −0,4238 | |||
| FAF / First American Financial Corporation | 1,22 | 1,10 | 74,73 | −5,43 | 2,5526 | −0,3280 | |||
| HLMN / Hillman Solutions Corp. | 10,05 | 16,10 | 71,78 | −5,70 | 2,4519 | −0,3229 | |||
| GMS / GMS Inc. | 0,64 | 1,10 | 69,96 | 50,27 | 2,3896 | 0,6924 | |||
| AHCO / AdaptHealth Corp. | 7,31 | 1,06 | 68,96 | −12,09 | 2,3555 | −0,5041 | |||
| MMI / Marcus & Millichap, Inc. | 2,21 | 2,40 | 68,02 | −8,72 | 2,3233 | −0,3931 | |||
| YETI / YETI Holdings, Inc. | 2,14 | 101,63 | 67,54 | 92,01 | 2,3071 | 1,0247 | |||
| FORM / FormFactor, Inc. | 1,90 | 64,82 | 65,54 | 100,48 | 2,2388 | 1,0470 | |||
| MMS / Maximus, Inc. | 0,91 | 0,26 | 64,15 | 3,21 | 2,1914 | −0,0745 | |||
| AL / Air Lease Corporation | 1,08 | −38,95 | 63,34 | −26,09 | 2,1635 | −0,9605 | |||
| PAR / PAR Technology Corporation | 0,88 | 2,90 | 61,31 | 16,38 | 2,0942 | 0,1737 | |||
| LSTR / Landstar System, Inc. | 0,43 | 49,21 | 59,23 | 38,10 | 2,0232 | 0,4597 | |||
| RHP / Ryman Hospitality Properties, Inc. | 0,60 | 36,14 | 58,74 | 46,90 | 2,0064 | 0,5487 | |||
| FHB / First Hawaiian, Inc. | 2,34 | 0,75 | 58,49 | 2,89 | 1,9979 | −0,0744 | |||
| EHC / Encompass Health Corporation | 0,45 | −19,51 | 55,57 | −2,54 | 1,8981 | −0,1805 | |||
| SKWD / Skyward Specialty Insurance Group, Inc. | 0,96 | 1,55 | 55,42 | 10,89 | 1,8932 | 0,0712 | |||
| LOPE / Grand Canyon Education, Inc. | 0,28 | −22,96 | 53,35 | −15,84 | 1,8225 | −0,4885 | |||
| IBOC / International Bancshares Corporation | 0,79 | 1,38 | 52,48 | 7,01 | 1,7926 | 0,0047 | |||
| ASGN / ASGN Incorporated | 1,02 | 53,07 | 50,90 | 21,27 | 1,7386 | 0,2086 | |||
| ACIW / ACI Worldwide, Inc. | 0,99 | −24,28 | 45,32 | −36,46 | 1,5479 | −1,0521 | |||
| ESI / Element Solutions Inc | 1,65 | 77,44 | 37,39 | 77,75 | 1,2771 | 0,5103 | |||
| GXO / GXO Logistics, Inc. | 0,72 | −0,57 | 35,16 | 23,92 | 1,2009 | 0,1666 | |||
| INDB / Independent Bank Corp. | 0,51 | 31,93 | 1,0906 | 1,0906 | |||||
| IWM / iShares Trust - iShares Russell 2000 ETF | 0,09 | 19,08 | 0,6517 | 0,6517 | |||||
| PAYC / Paycom Software, Inc. | 0,06 | −8,55 | 14,79 | −3,14 | 0,5052 | −0,0515 | |||
| VVX / V2X, Inc. | 0,29 | 14,08 | 0,4811 | 0,4811 | |||||
| TPR / Tapestry, Inc. | 0,15 | 17,56 | 12,90 | 46,62 | 0,4406 | 0,1199 | |||
| AMG / Affiliated Managers Group, Inc. | 0,06 | −8,30 | 12,67 | 7,39 | 0,4329 | 0,0026 | |||
| SSNC / SS&C Technologies Holdings, Inc. | 0,14 | −8,09 | 11,21 | −8,89 | 0,3829 | −0,0656 | |||
| TRU / TransUnion | 0,13 | −6,43 | 11,16 | −0,77 | 0,3812 | −0,0288 | |||
| LPLA / LPL Financial Holdings Inc. | 0,03 | −8,91 | 11,14 | 4,41 | 0,3806 | −0,0084 | |||
| MTB / M&T Bank Corporation | 0,05 | −8,72 | 10,01 | −0,93 | 0,3420 | −0,0264 | |||
| LYV / Live Nation Entertainment, Inc. | 0,06 | −8,27 | 9,74 | 6,27 | 0,3327 | −0,0014 | |||
| MCHP / Microchip Technology Incorporated | 0,13 | −5,48 | 9,03 | 37,40 | 0,3086 | 0,0689 | |||
| LKQ / LKQ Corporation | 0,24 | −7,97 | 8,95 | −19,94 | 0,3059 | −0,1019 | |||
| REXR / Rexford Industrial Realty, Inc. | 0,25 | −7,67 | 8,92 | −16,11 | 0,3048 | −0,0830 | |||
| FIS / Fidelity National Information Services, Inc. | 0,11 | −7,79 | 8,75 | 0,52 | 0,2989 | −0,0185 | |||
| CPT / Camden Property Trust | 0,08 | −7,96 | 8,71 | −15,20 | 0,2976 | −0,0769 | |||
| KEYS / Keysight Technologies, Inc. | 0,05 | 28,90 | 8,60 | 41,03 | 0,2937 | 0,0714 | |||
| XEL / Xcel Energy Inc. | 0,12 | −8,11 | 8,45 | −11,60 | 0,2886 | −0,0598 | |||
| ALSN / Allison Transmission Holdings, Inc. | 0,09 | −8,53 | 8,38 | −9,18 | 0,2864 | −0,0502 | |||
| ST / Sensata Technologies Holding plc | 0,27 | −6,07 | 8,23 | 16,54 | 0,2811 | 0,0237 | |||
| FNF / Fidelity National Financial, Inc. | 0,15 | −6,86 | 8,21 | −19,77 | 0,2805 | −0,0926 | |||
| BKR / Baker Hughes Company | 0,21 | −7,95 | 8,18 | −19,69 | 0,2795 | −0,0919 | |||
| ICE / Intercontinental Exchange, Inc. | 0,04 | −8,45 | 7,93 | −2,64 | 0,2710 | −0,0260 | |||
| AVTR / Avantor, Inc. | 0,57 | −7,70 | 7,65 | −23,36 | 0,2613 | −0,1026 | |||
| EXP / Eagle Materials Inc. | 0,04 | −5,90 | 7,52 | −14,30 | 0,2568 | −0,0630 | |||
| DG / Dollar General Corporation | 0,06 | −4,90 | 7,40 | 23,70 | 0,2526 | 0,0347 | |||
| AOS / A. O. Smith Corporation | 0,11 | 7,16 | 0,2447 | 0,2447 | |||||
| CTSH / Cognizant Technology Solutions Corporation | 0,09 | −9,16 | 7,07 | −7,35 | 0,2415 | −0,0367 | |||
| COLD / Americold Realty Trust, Inc. | 0,41 | −7,52 | 6,81 | −28,33 | 0,2328 | −0,1139 | |||
| AFG / American Financial Group, Inc. | 0,05 | −8,97 | 6,79 | −12,52 | 0,2320 | −0,0510 | |||
| ZBH / Zimmer Biomet Holdings, Inc. | 0,07 | −8,11 | 6,73 | −25,95 | 0,2299 | −0,1014 | |||
| BOKF / BOK Financial Corporation | 0,07 | −7,46 | 6,64 | −13,26 | 0,2268 | −0,0522 | |||
| GPN / Global Payments Inc. | 0,07 | −10,30 | 5,89 | −26,69 | 0,2013 | −0,0917 | |||
| PGR / The Progressive Corporation | 0,02 | −33,09 | 4,95 | −36,90 | 0,1691 | −0,1169 | |||
| BJ / BJ's Wholesale Club Holdings, Inc. | 0,04 | −29,09 | 4,64 | −32,99 | 0,1584 | −0,0939 | |||
| MAR / Marriott International, Inc. | 0,01 | 3,91 | 0,1336 | 0,1336 | |||||
| SNA / Snap-on Incorporated | 0,01 | −7,83 | 3,87 | −14,89 | 0,1322 | −0,0336 | |||
| WSC / WillScot Holdings Corporation | 0,10 | −5,73 | 2,76 | −7,07 | 0,0943 | −0,0140 | |||
| IVV / iShares Trust - iShares Core S&P 500 ETF | 0,00 | 0,00 | 1,39 | 10,47 | 0,0476 | 0,0016 | |||
| SPSB / SPDR Series Trust - SPDR Portfolio Short Term Corporate Bond ETF | 0,01 | 0,00 | 0,29 | 0,35 | 0,0098 | −0,0006 | |||
| SFM / Sprouts Farmers Market, Inc. | 0,00 | −100,00 | 0,00 | 0,0000 | |||||
| PINC / Premier, Inc. | 0,00 | −100,00 | 0,00 | 0,0000 | |||||
| AMN / AMN Healthcare Services, Inc. | 0,00 | −100,00 | 0,00 | 0,0000 | |||||
| IWN / iShares Trust - iShares Russell 2000 Value ETF | 0,00 | −100,00 | 0,00 | 0,0000 | |||||
| CRL / Charles River Laboratories International, Inc. | 0,00 | −100,00 | 0,00 | 0,0000 | |||||
| FMC / FMC Corporation | 0,00 | −100,00 | 0,00 | 0,0000 | |||||
| ALEX / Alexander & Baldwin, Inc. | 0,00 | −100,00 | 0,00 | 0,0000 | |||||
| THO / THOR Industries, Inc. | 0,00 | −100,00 | 0,00 | 0,0000 |