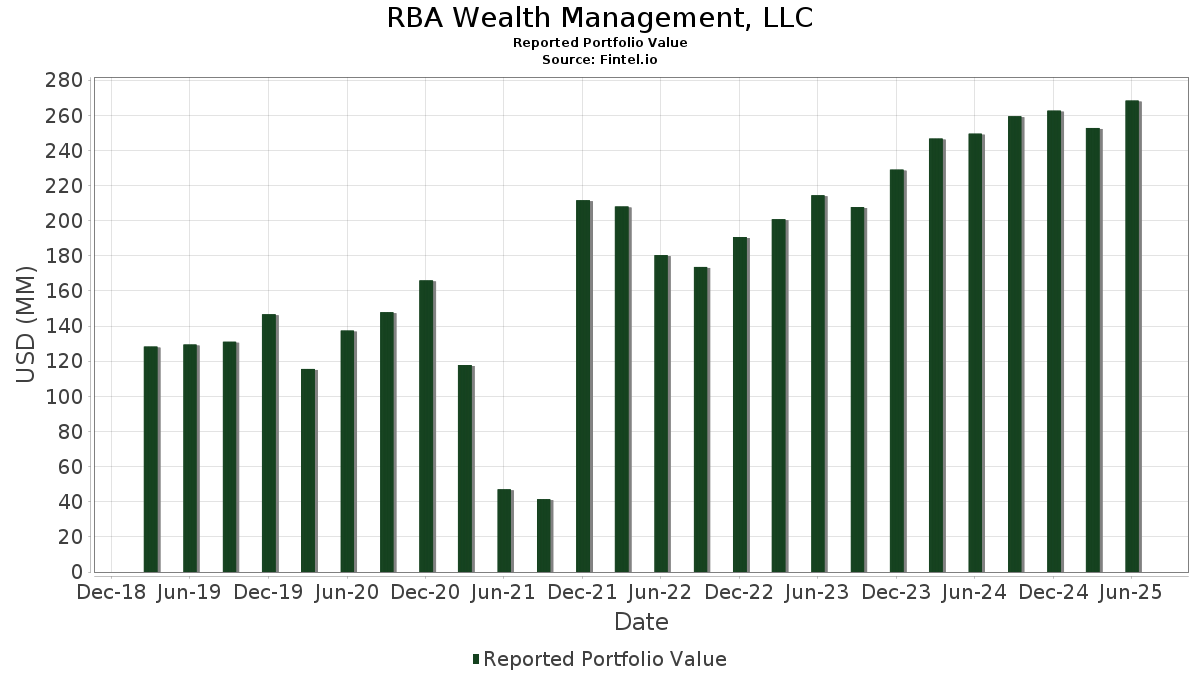
Grunnleggende statistikk
| Porteføljeverdi | $ 268 384 663 |
| Nåværende posisjoner | 93 |
Siste beholdninger, prestasjoner, forvaltet kapital (fra 13F, 13D)
RBA Wealth Management, LLC har oppgitt 93 totale beholdninger i sine siste SEC-arkiveringer. Siste porteføljeverdi er beregnet til 268 384 663 USD. Faktisk forvaltet kapital (AUM) er denne verdien pluss kontanter (som ikke er oppgitt). RBA Wealth Management, LLCs største beholdninger er Microsoft Corporation (US:MSFT) , Broadcom Inc. (US:AVGO) , Apple Inc. (US:AAPL) , Alphabet Inc. (US:GOOGL) , and Visa Inc. (US:V) . RBA Wealth Management, LLCs nye posisjoner inkluderer Ingredion Incorporated (US:INGR) , NRG Energy, Inc. (US:NRG) , .
De største økningene dette kvartalet
Vi bruker endringen i porteføljeallokeringen fordi dette er det mest meningsfulle målet. Endringer kan skyldes handler eller endringer i aksjekursene.
| Verdipapirer | Aksjer (MM) |
Verdi (MM$) |
Portefølje % | ΔPortefølje % |
|---|---|---|---|---|
| 0,01 | 5,64 | 2,1016 | 2,1016 | |
| 0,03 | 8,97 | 3,3419 | 1,1394 | |
| 0,02 | 2,80 | 1,0429 | 1,0429 | |
| 0,01 | 2,33 | 0,8686 | 0,8686 | |
| 0,02 | 10,03 | 3,7384 | 0,6747 | |
| 0,01 | 6,97 | 2,5982 | 0,5139 | |
| 0,02 | 5,20 | 1,9392 | 0,4448 | |
| 0,03 | 5,21 | 1,9400 | 0,3402 | |
| 0,01 | 5,34 | 1,9911 | 0,2949 | |
| 0,01 | 5,93 | 2,2078 | 0,2927 |
De største reduksjonene dette kvartalet
Vi bruker endringen i porteføljeallokeringen fordi dette er det mest meningsfulle målet. Endringer kan skyldes handler eller endringer i aksjekurser.
| Verdipapirer | Aksjer (MM) |
Verdi (MM$) |
Portefølje % | ΔPortefølje % |
|---|---|---|---|---|
| 0,01 | 0,60 | 0,2222 | −1,7863 | |
| 0,00 | 5,69 | 2,1204 | −1,4317 | |
| 0,02 | 3,98 | 1,4835 | −0,5057 | |
| 0,04 | 8,65 | 3,2236 | −0,4469 | |
| 0,00 | 1,03 | 0,3839 | −0,4380 | |
| 0,02 | 5,11 | 1,9041 | −0,3341 | |
| 0,02 | 3,98 | 1,4844 | −0,3234 | |
| 0,06 | 5,91 | 2,2007 | −0,2987 | |
| 0,02 | 4,59 | 1,7088 | −0,2464 | |
| 0,02 | 7,61 | 2,8344 | −0,2374 |
13F- og Fondsarkiveringer
Dette skjemaet ble sendt inn den 2025-07-17 for rapporteringsperioden 2025-06-30. Klikk på lenkeikonet for å se hele transaksjonshistorikken.
Oppgradere for å låse opp premiedata og eksportere til Excel![]() .
.
| Verdipapirer | Type | Gjennomsnittlig aksjekurs | Aksjer (MM) |
ΔAksjer (%) |
ΔAksjer (%) |
Verdi ($MM) |
Portefølje (%) |
ΔPortefølje (%) |
|
|---|---|---|---|---|---|---|---|---|---|
| MSFT / Microsoft Corporation | 0,02 | −2,23 | 10,03 | 29,56 | 3,7384 | 0,6747 | |||
| AVGO / Broadcom Inc. | 0,03 | −2,15 | 8,97 | 61,11 | 3,3419 | 1,1394 | |||
| AAPL / Apple Inc. | 0,04 | 0,96 | 8,65 | −6,76 | 3,2236 | −0,4469 | |||
| GOOGL / Alphabet Inc. | 0,05 | −1,02 | 8,27 | 12,80 | 3,0827 | 0,1811 | |||
| V / Visa Inc. | 0,02 | −3,30 | 7,61 | −2,02 | 2,8344 | −0,2374 | |||
| WM / Waste Management, Inc. | 0,03 | −0,54 | 7,25 | −1,70 | 2,7002 | −0,2161 | |||
| META / Meta Platforms, Inc. | 0,01 | 3,36 | 6,97 | 32,37 | 2,5982 | 0,5139 | |||
| CMI / Cummins Inc. | 0,02 | 0,02 | 6,81 | 4,51 | 2,5384 | −0,0403 | |||
| BSX / Boston Scientific Corporation | 0,06 | −5,26 | 6,80 | 0,88 | 2,5336 | −0,1330 | |||
| MET / MetLife, Inc. | 0,08 | 0,15 | 6,24 | 0,32 | 2,3258 | −0,1359 | |||
| EWBC / East West Bancorp, Inc. | 0,06 | 1,53 | 6,18 | 14,21 | 2,3029 | 0,1623 | |||
| SNPS / Synopsys, Inc. | 0,01 | 0,15 | 5,93 | 19,73 | 2,2111 | 0,2503 | |||
| ASML / ASML Holding N.V. - Depositary Receipt (Common Stock) | 0,01 | 1,20 | 5,93 | 22,39 | 2,2078 | 0,2927 | |||
| ACGL / Arch Capital Group Ltd. | 0,06 | −1,25 | 5,91 | −6,51 | 2,2007 | −0,2987 | |||
| CBOE / Cboe Global Markets, Inc. | 0,03 | 4,55 | 5,86 | 7,73 | 2,1852 | 0,0319 | |||
| AZO / AutoZone, Inc. | 0,00 | −34,90 | 5,69 | −36,63 | 2,1204 | −1,4317 | |||
| GS / The Goldman Sachs Group, Inc. | 0,01 | 5,64 | 2,1016 | 2,1016 | |||||
| URI / United Rentals, Inc. | 0,01 | 3,67 | 5,34 | 24,63 | 1,9911 | 0,2949 | |||
| AMAT / Applied Materials, Inc. | 0,03 | 2,06 | 5,21 | 28,77 | 1,9400 | 0,3402 | |||
| TSM / Taiwan Semiconductor Manufacturing Company Limited - Depositary Receipt (Common Stock) | 0,02 | 0,98 | 5,20 | 37,78 | 1,9392 | 0,4448 | |||
| TMUS / T-Mobile US, Inc. | 0,02 | 1,11 | 5,11 | −9,67 | 1,9041 | −0,3341 | |||
| HD / The Home Depot, Inc. | 0,01 | 0,46 | 5,01 | 0,50 | 1,8651 | −0,1053 | |||
| AEP / American Electric Power Company, Inc. | 0,05 | 1,55 | 4,96 | −3,58 | 1,8489 | −0,1868 | |||
| QCOM / QUALCOMM Incorporated | 0,03 | 0,75 | 4,91 | 4,45 | 1,8288 | −0,0301 | |||
| PG / The Procter & Gamble Company | 0,03 | 1,77 | 4,86 | −4,86 | 1,8105 | −0,2099 | |||
| MDT / Medtronic plc | 0,05 | 1,30 | 4,65 | −1,75 | 1,7329 | −0,1394 | |||
| CRM / Salesforce, Inc. | 0,02 | 0,96 | 4,61 | 2,58 | 1,7161 | −0,0600 | |||
| EXP / Eagle Materials Inc. | 0,02 | 1,89 | 4,59 | −7,20 | 1,7088 | −0,2464 | |||
| EA / Electronic Arts Inc. | 0,03 | 0,65 | 4,53 | 11,24 | 1,6890 | 0,0766 | |||
| ADBE / Adobe Inc. | 0,01 | 1,85 | 4,47 | 2,74 | 1,6645 | −0,0556 | |||
| FIS / Fidelity National Information Services, Inc. | 0,05 | 1,20 | 4,43 | 10,33 | 1,6519 | 0,0622 | |||
| FLS / Flowserve Corporation | 0,08 | 0,88 | 4,26 | 8,15 | 1,5877 | 0,0288 | |||
| CI / The Cigna Group | 0,01 | 5,06 | 4,16 | 5,56 | 1,5503 | −0,0090 | |||
| PVH / PVH Corp. | 0,06 | 1,23 | 4,04 | 7,42 | 1,5044 | 0,0176 | |||
| PLD / Prologis, Inc. | 0,04 | 0,30 | 4,01 | −5,70 | 1,4934 | −0,1877 | |||
| TRGP / Targa Resources Corp. | 0,02 | 0,40 | 3,98 | −12,83 | 1,4844 | −0,3234 | |||
| BDX / Becton, Dickinson and Company | 0,02 | 5,30 | 3,98 | −20,82 | 1,4835 | −0,5057 | |||
| KBH / KB Home | 0,07 | 2,67 | 3,50 | −6,44 | 1,3058 | −0,1758 | |||
| VGT / Vanguard World Fund - Vanguard Information Technology ETF | 0,01 | −0,19 | 3,40 | 22,08 | 1,2651 | 0,1646 | |||
| MHK / Mohawk Industries, Inc. | 0,03 | 3,59 | 3,33 | −4,88 | 1,2412 | −0,1442 | |||
| NXPI / NXP Semiconductors N.V. | 0,01 | 2,66 | 3,20 | 18,01 | 1,1939 | 0,1198 | |||
| INGR / Ingredion Incorporated | 0,02 | 2,80 | 1,0429 | 1,0429 | |||||
| TFX / Teleflex Incorporated | 0,02 | 6,23 | 2,69 | −9,03 | 1,0022 | −0,1673 | |||
| EOG / EOG Resources, Inc. | 0,02 | 5,31 | 2,59 | −1,78 | 0,9642 | −0,0780 | |||
| ACN / Accenture plc | 0,01 | 12,98 | 2,47 | 8,18 | 0,9218 | 0,0174 | |||
| NRG / NRG Energy, Inc. | 0,01 | 2,33 | 0,8686 | 0,8686 | |||||
| VICI / VICI Properties Inc. | 0,06 | 2,63 | 2,06 | 2,59 | 0,7662 | −0,0269 | |||
| BND / Vanguard Bond Index Funds - Vanguard Total Bond Market ETF | 0,02 | −0,68 | 1,62 | −0,43 | 0,6033 | −0,0401 | |||
| AGG / iShares Trust - iShares Core U.S. Aggregate Bond ETF | 0,02 | −2,24 | 1,60 | −1,97 | 0,5948 | −0,0493 | |||
| VFH / Vanguard World Fund - Vanguard Financials ETF | 0,01 | 4,56 | 1,52 | 11,41 | 0,5677 | 0,0267 | |||
| TGT / Target Corporation | 0,02 | 10,75 | 1,51 | 4,71 | 0,5632 | −0,0080 | |||
| BRK.A / Berkshire Hathaway Inc. | 0,00 | 0,00 | 1,46 | −8,71 | 0,5431 | −0,0886 | |||
| CVX / Chevron Corporation | 0,01 | −7,10 | 1,29 | −20,48 | 0,4804 | −0,1611 | |||
| AMZN / Amazon.com, Inc. | 0,01 | 0,02 | 1,18 | 15,36 | 0,4395 | 0,0349 | |||
| VCR / Vanguard World Fund - Vanguard Consumer Discretionary ETF | 0,00 | 7,82 | 1,07 | 20,02 | 0,4001 | 0,0462 | |||
| VHT / Vanguard World Fund - Vanguard Health Care ETF | 0,00 | 3,67 | 1,03 | −2,83 | 0,3845 | −0,0353 | |||
| UNH / UnitedHealth Group Incorporated | 0,00 | −16,74 | 1,03 | −50,41 | 0,3839 | −0,4380 | |||
| VIS / Vanguard World Fund - Vanguard Industrials ETF | 0,00 | 2,32 | 1,00 | 15,89 | 0,3722 | 0,0308 | |||
| VOX / Vanguard World Fund - Vanguard Communication Services ETF | 0,01 | −0,68 | 0,97 | 14,54 | 0,3611 | 0,0262 | |||
| JPM / JPMorgan Chase & Co. | 0,00 | −1,00 | 0,95 | 17,04 | 0,3535 | 0,0328 | |||
| WMT / Walmart Inc. | 0,01 | −10,59 | 0,87 | −0,46 | 0,3237 | −0,0214 | |||
| TSLA / Tesla, Inc. | 0,00 | 0,93 | 0,83 | 23,65 | 0,3081 | 0,0437 | |||
| SCHG / Schwab Strategic Trust - Schwab U.S. Large-Cap Growth ETF | 0,02 | 2,82 | 0,65 | 19,89 | 0,2406 | 0,0276 | |||
| CSCO / Cisco Systems, Inc. | 0,01 | −89,55 | 0,60 | −88,26 | 0,2222 | −1,7863 | |||
| NVDA / NVIDIA Corporation | 0,00 | 3,83 | 0,56 | 51,62 | 0,2090 | 0,0624 | |||
| OTTR / Otter Tail Corporation | 0,01 | −3,85 | 0,53 | −7,89 | 0,1959 | −0,0296 | |||
| VDC / Vanguard World Fund - Vanguard Consumer Staples ETF | 0,00 | −2,67 | 0,49 | −2,60 | 0,1816 | −0,0163 | |||
| IBM / International Business Machines Corporation | 0,00 | −16,36 | 0,48 | −0,83 | 0,1786 | −0,0127 | |||
| LMT / Lockheed Martin Corporation | 0,00 | −27,55 | 0,47 | −24,92 | 0,1743 | −0,0720 | |||
| SCHZ / Schwab Strategic Trust - Schwab U.S. Aggregate Bond ETF | 0,02 | 2,86 | 0,41 | 3,27 | 0,1528 | −0,0044 | |||
| DIS / The Walt Disney Company | 0,00 | −5,50 | 0,40 | 18,69 | 0,1493 | 0,0158 | |||
| QQQ / Invesco QQQ Trust, Series 1 | 0,00 | 0,56 | 0,40 | 18,51 | 0,1480 | 0,0152 | |||
| COST / Costco Wholesale Corporation | 0,00 | −7,08 | 0,39 | −2,74 | 0,1454 | −0,0133 | |||
| SCHM / Schwab Strategic Trust - Schwab U.S. Mid-Cap ETF | 0,01 | 2,67 | 0,38 | 9,86 | 0,1414 | 0,0048 | |||
| SPYG / SPDR Series Trust - SPDR Portfolio S&P 500 Growth ETF | 0,00 | 1,37 | 0,37 | 20,32 | 0,1390 | 0,0163 | |||
| SPY / SPDR S&P 500 ETF | 0,00 | −7,75 | 0,35 | 1,73 | 0,1315 | −0,0055 | |||
| VDE / Vanguard World Fund - Vanguard Energy ETF | 0,00 | 13,19 | 0,35 | 3,83 | 0,1314 | −0,0028 | |||
| CB / Chubb Limited | 0,00 | −1,53 | 0,33 | −5,65 | 0,1247 | −0,0154 | |||
| PEP / PepsiCo, Inc. | 0,00 | −19,54 | 0,30 | −29,21 | 0,1130 | −0,0563 | |||
| SCHA / Schwab Strategic Trust - Schwab U.S. Small-Cap ETF | 0,01 | 5,67 | 0,30 | 13,96 | 0,1128 | 0,0078 | |||
| TECK / Teck Resources Limited | 0,01 | −9,87 | 0,30 | 0,00 | 0,1111 | −0,0070 | |||
| CPRT / Copart, Inc. | 0,01 | 0,00 | 0,27 | −13,38 | 0,1016 | −0,0228 | |||
| IAGG / iShares Trust - iShares Core International Aggregate Bond ETF | 0,01 | 7,42 | 0,26 | 9,54 | 0,0986 | 0,0032 | |||
| SCHV / Schwab Strategic Trust - Schwab U.S. Large-Cap Value ETF | 0,01 | 0,37 | 0,26 | 4,49 | 0,0956 | −0,0016 | |||
| SCHF / Schwab Strategic Trust - Schwab International Equity ETF | 0,01 | −0,95 | 0,26 | 10,39 | 0,0953 | 0,0039 | |||
| VNQ / Vanguard Specialized Funds - Vanguard Real Estate ETF | 0,00 | 4,63 | 0,26 | 2,82 | 0,0953 | −0,0030 | |||
| VPU / Vanguard World Fund - Vanguard Utilities ETF | 0,00 | 4,64 | 0,25 | 8,09 | 0,0949 | 0,0017 | |||
| JEPI / J.P. Morgan Exchange-Traded Fund Trust - JPMorgan Equity Premium Income ETF | 0,00 | −5,11 | 0,25 | −5,66 | 0,0933 | −0,0116 | |||
| MCD / McDonald's Corporation | 0,00 | −0,71 | 0,24 | −6,87 | 0,0909 | −0,0130 | |||
| BRK.B / Berkshire Hathaway Inc. | 0,00 | −7,89 | 0,24 | −15,90 | 0,0887 | −0,0234 | |||
| RJF / Raymond James Financial, Inc. | 0,00 | −2,81 | 0,23 | 7,37 | 0,0870 | 0,0009 | |||
| FDX / FedEx Corporation | 0,00 | −1,00 | 0,22 | −7,82 | 0,0837 | −0,0126 | |||
| VAW / Vanguard World Fund - Vanguard Materials ETF | 0,00 | 1,29 | 0,21 | 4,41 | 0,0797 | −0,0013 | |||
| COP / ConocoPhillips | 0,00 | −100,00 | 0,00 | 0,0000 | |||||
| JNJ / Johnson & Johnson | 0,00 | −100,00 | 0,00 | 0,0000 | |||||
| SPGI / S&P Global Inc. | 0,00 | −100,00 | 0,00 | 0,0000 | |||||
| XOM / Exxon Mobil Corporation | 0,00 | −100,00 | 0,00 | 0,0000 |