Grunnleggende statistikk
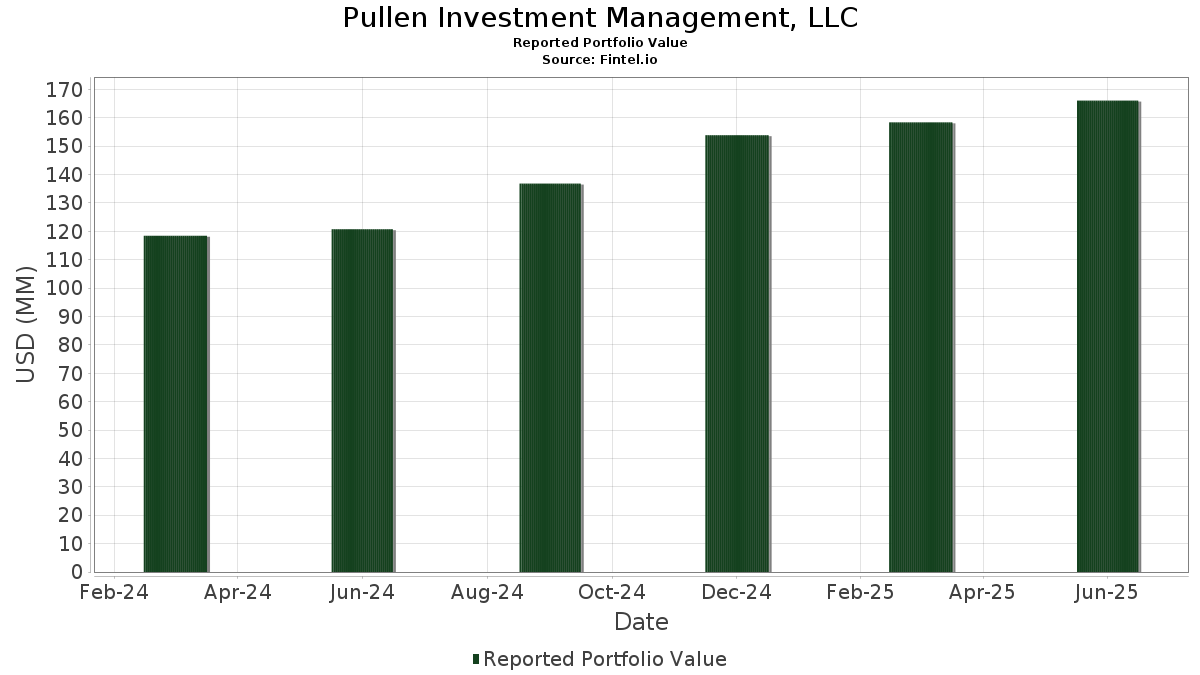
| Porteføljeverdi | $ 166 017 332 |
| Nåværende posisjoner | 100 |
Siste beholdninger, prestasjoner, forvaltet kapital (fra 13F, 13D)
Pullen Investment Management, LLC har oppgitt 100 totale beholdninger i sine siste SEC-arkiveringer. Siste porteføljeverdi er beregnet til 166 017 332 USD. Faktisk forvaltet kapital (AUM) er denne verdien pluss kontanter (som ikke er oppgitt). Pullen Investment Management, LLCs største beholdninger er Vanguard Index Funds - Vanguard S&P 500 ETF (US:VOO) , Vanguard Index Funds - Vanguard Total Stock Market ETF (US:VTI) , Schwab Strategic Trust - Schwab U.S. Broad Market ETF (US:SCHB) , Microsoft Corporation (US:MSFT) , and Berkshire Hathaway Inc. (US:BRK.B) . Pullen Investment Management, LLCs nye posisjoner inkluderer Barrick Mining Corporation (US:B) , Titan Machinery Inc. (US:TITN) , .
De største økningene dette kvartalet
Vi bruker endringen i porteføljeallokeringen fordi dette er det mest meningsfulle målet. Endringer kan skyldes handler eller endringer i aksjekursene.
| Verdipapirer | Aksjer (MM) |
Verdi (MM$) |
Portefølje % | ΔPortefølje % |
|---|---|---|---|---|
| 0,09 | 1,77 | 1,0672 | 1,0672 | |
| 0,15 | 2,03 | 1,2230 | 0,6655 | |
| 0,03 | 1,70 | 1,0229 | 0,6360 | |
| 0,04 | 1,89 | 1,1408 | 0,5823 | |
| 0,03 | 8,19 | 4,9340 | 0,5682 | |
| 0,01 | 4,49 | 2,7043 | 0,5680 | |
| 0,02 | 2,03 | 1,2237 | 0,5554 | |
| 0,05 | 1,80 | 1,0851 | 0,4055 | |
| 0,03 | 0,67 | 0,4024 | 0,4024 | |
| 0,09 | 1,93 | 1,1612 | 0,3997 |
De største reduksjonene dette kvartalet
Vi bruker endringen i porteføljeallokeringen fordi dette er det mest meningsfulle målet. Endringer kan skyldes handler eller endringer i aksjekurser.
| Verdipapirer | Aksjer (MM) |
Verdi (MM$) |
Portefølje % | ΔPortefølje % |
|---|---|---|---|---|
| 0,01 | 0,29 | 0,1750 | −0,9064 | |
| 0,02 | 0,65 | 0,3897 | −0,6682 | |
| 0,16 | 2,10 | 1,2633 | −0,4401 | |
| 0,01 | 4,05 | 2,4391 | −0,4045 | |
| 0,01 | 2,12 | 1,2781 | −0,3981 | |
| 0,02 | 1,92 | 1,1545 | −0,2939 | |
| 0,20 | 4,80 | 2,8926 | −0,2338 | |
| 0,02 | 1,07 | 0,6446 | −0,2242 | |
| 0,09 | 1,79 | 1,0768 | −0,2239 | |
| 0,01 | 1,82 | 1,0979 | −0,2145 |
13F- og Fondsarkiveringer
Dette skjemaet ble sendt inn den 2025-07-31 for rapporteringsperioden 2025-06-30. Klikk på lenkeikonet for å se hele transaksjonshistorikken.
Oppgradere for å låse opp premiedata og eksportere til Excel![]() .
.
| Verdipapirer | Type | Gjennomsnittlig aksjekurs | Aksjer (MM) |
ΔAksjer (%) |
ΔAksjer (%) |
Verdi ($MM) |
Portefølje (%) |
ΔPortefølje (%) |
|
|---|---|---|---|---|---|---|---|---|---|
| VOO / Vanguard Index Funds - Vanguard S&P 500 ETF | 0,02 | −1,43 | 10,60 | 8,95 | 6,3855 | 0,2411 | |||
| VTI / Vanguard Index Funds - Vanguard Total Stock Market ETF | 0,03 | 7,14 | 8,19 | 18,49 | 4,9340 | 0,5682 | |||
| SCHB / Schwab Strategic Trust - Schwab U.S. Broad Market ETF | 0,20 | −12,36 | 4,80 | −2,99 | 2,8926 | −0,2338 | |||
| MSFT / Microsoft Corporation | 0,01 | 0,16 | 4,49 | 32,73 | 2,7043 | 0,5680 | |||
| BRK.B / Berkshire Hathaway Inc. | 0,01 | −1,41 | 4,05 | −10,06 | 2,4391 | −0,4045 | |||
| HII / Huntington Ingalls Industries, Inc. | 0,02 | 0,29 | 3,83 | 18,71 | 2,3090 | 0,2693 | |||
| SPY / SPDR S&P 500 ETF | 0,01 | 0,00 | 3,81 | 10,47 | 2,2944 | 0,1165 | |||
| LINC / Lincoln Educational Services Corporation | 0,16 | −25,47 | 3,65 | 8,27 | 2,2011 | 0,0692 | |||
| KEX / Kirby Corporation | 0,03 | 0,59 | 3,58 | 12,94 | 2,1562 | 0,1547 | |||
| GPK / Graphic Packaging Holding Company | 0,16 | 46,29 | 3,37 | 18,74 | 2,0307 | 0,2376 | |||
| AGM / Federal Agricultural Mortgage Corporation | 0,02 | −0,34 | 3,10 | 3,26 | 1,8674 | −0,0287 | |||
| SENEA / Seneca Foods Corporation | 0,03 | 0,86 | 2,92 | 14,91 | 1,7599 | 0,1541 | |||
| SO / The Southern Company | 0,03 | −1,38 | 2,68 | −1,51 | 1,6163 | −0,1042 | |||
| FCFS / FirstCash Holdings, Inc. | 0,02 | 0,86 | 2,34 | 13,28 | 1,4079 | 0,1050 | |||
| CRDA / Crawford & Co. - Class A | 0,22 | 27,35 | 2,28 | 18,00 | 1,3707 | 0,1527 | |||
| MSGS / Madison Square Garden Sports Corp. | 0,01 | 0,87 | 2,26 | 8,22 | 1,3639 | 0,0428 | |||
| ALL / The Allstate Corporation | 0,01 | −0,56 | 2,17 | −3,34 | 1,3081 | −0,1105 | |||
| CVX / Chevron Corporation | 0,01 | −6,61 | 2,12 | −20,08 | 1,2781 | −0,3981 | |||
| SSTI / SoundThinking, Inc. | 0,16 | 0,95 | 2,10 | −22,25 | 1,2633 | −0,4401 | |||
| THG / The Hanover Insurance Group, Inc. | 0,01 | 0,84 | 2,09 | −1,55 | 1,2606 | −0,0814 | |||
| GLD / SPDR Gold Trust | 0,01 | 2,26 | 2,08 | 8,17 | 1,2519 | 0,0387 | |||
| OLLI / Ollie's Bargain Outlet Holdings, Inc. | 0,02 | 69,52 | 2,03 | 91,97 | 1,2237 | 0,5554 | |||
| MRC / MRC Global Inc. | 0,15 | 92,60 | 2,03 | 130,16 | 1,2230 | 0,6655 | |||
| TTI / TETRA Technologies, Inc. | 0,60 | 15,21 | 2,01 | 15,22 | 1,2087 | 0,1088 | |||
| SIGI / Selective Insurance Group, Inc. | 0,02 | 0,89 | 1,97 | −4,51 | 1,1873 | −0,1162 | |||
| INGM / Ingram Micro Holding Corporation | 0,09 | 36,09 | 1,93 | 59,92 | 1,1612 | 0,3997 | |||
| COKE / Coca-Cola Consolidated, Inc. | 0,02 | 910,42 | 1,92 | −16,44 | 1,1545 | −0,2939 | |||
| NEM / Newmont Corporation | 0,03 | −0,28 | 1,91 | 20,39 | 1,1524 | 0,1484 | |||
| SPB / Spectrum Brands Holdings, Inc. | 0,04 | 189,09 | 1,89 | 114,14 | 1,1408 | 0,5823 | |||
| AZZ / AZZ Inc. | 0,02 | 1,30 | 1,86 | 14,47 | 1,1201 | 0,0942 | |||
| CME / CME Group Inc. | 0,01 | −0,45 | 1,83 | 3,40 | 1,1009 | −0,0151 | |||
| HES / Hess Corporation | 0,01 | 1,12 | 1,82 | −12,32 | 1,0979 | −0,2145 | |||
| PNC / The PNC Financial Services Group, Inc. | 0,01 | −0,63 | 1,80 | 5,38 | 1,0864 | 0,0057 | |||
| ALNT / Allient Inc. | 0,05 | 1,34 | 1,80 | 67,38 | 1,0851 | 0,4055 | |||
| THS / TreeHouse Foods, Inc. | 0,09 | 82,25 | 1,79 | 30,69 | 1,0803 | 0,2134 | |||
| KVUE / Kenvue Inc. | 0,09 | −0,56 | 1,79 | −13,21 | 1,0768 | −0,2239 | |||
| B / Barrick Mining Corporation | 0,09 | 1,77 | 1,0672 | 1,0672 | |||||
| HON / Honeywell International Inc. | 0,01 | −0,67 | 1,76 | 9,23 | 1,0629 | 0,0428 | |||
| PLPC / Preformed Line Products Company | 0,01 | 0,93 | 1,75 | 15,18 | 1,0513 | 0,0941 | |||
| UL / Unilever PLC - Depositary Receipt (Common Stock) | 0,03 | −0,41 | 1,73 | 2,31 | 1,0400 | −0,0258 | |||
| COST / Costco Wholesale Corporation | 0,00 | −0,75 | 1,70 | 3,85 | 1,0245 | −0,0096 | |||
| CSCO / Cisco Systems, Inc. | 0,02 | −0,55 | 1,70 | 11,86 | 1,0230 | 0,0638 | |||
| FTDR / Frontdoor, Inc. | 0,03 | 80,66 | 1,70 | 177,45 | 1,0229 | 0,6360 | |||
| LH / Labcorp Holdings Inc. | 0,01 | −0,36 | 1,69 | 12,37 | 1,0185 | 0,0684 | |||
| MPC / Marathon Petroleum Corporation | 0,01 | −1,76 | 1,67 | 12,03 | 1,0046 | 0,0643 | |||
| WRB / W. R. Berkley Corporation | 0,02 | −0,53 | 1,62 | 2,74 | 0,9728 | −0,0203 | |||
| CCI / Crown Castle Inc. | 0,02 | −0,38 | 1,60 | −1,78 | 0,9632 | −0,0653 | |||
| SCL / Stepan Company | 0,03 | 22,73 | 1,54 | 21,66 | 0,9276 | 0,1285 | |||
| JAAA / Janus Detroit Street Trust - Janus Henderson AAA CLO ETF | 0,03 | 9,62 | 1,54 | 9,71 | 0,9261 | 0,0411 | |||
| DUK / Duke Energy Corporation | 0,01 | −0,58 | 1,45 | −3,78 | 0,8741 | −0,0787 | |||
| UNF / UniFirst Corporation | 0,01 | 0,94 | 1,40 | 9,14 | 0,8419 | 0,0335 | |||
| LMT / Lockheed Martin Corporation | 0,00 | −0,14 | 1,34 | 3,56 | 0,8062 | −0,0102 | |||
| XOM / Exxon Mobil Corporation | 0,01 | 0,82 | 1,29 | −8,58 | 0,7771 | −0,1144 | |||
| WMG / Warner Music Group Corp. | 0,05 | −0,48 | 1,28 | −13,51 | 0,7713 | −0,1639 | |||
| PSN / Parsons Corporation | 0,02 | 1,35 | 1,27 | 22,85 | 0,7644 | 0,1121 | |||
| AVD / American Vanguard Corporation | 0,32 | 31,81 | 1,26 | 17,49 | 0,7567 | 0,0811 | |||
| RTO / Rentokil Initial plc - Depositary Receipt (Common Stock) | 0,05 | −0,48 | 1,16 | 4,31 | 0,6997 | −0,0036 | |||
| CCK / Crown Holdings, Inc. | 0,01 | −0,61 | 1,15 | 14,67 | 0,6924 | 0,0594 | |||
| FOX / Fox Corporation | 0,02 | −0,47 | 1,15 | −2,55 | 0,6901 | −0,0520 | |||
| CNX / CNX Resources Corporation | 0,03 | 1,33 | 1,11 | 8,37 | 0,6709 | 0,0221 | |||
| IBKR / Interactive Brokers Group, Inc. | 0,02 | 299,10 | 1,08 | 33,54 | 0,6524 | 0,1402 | |||
| SYY / Sysco Corporation | 0,01 | −0,48 | 1,08 | 0,47 | 0,6497 | −0,0284 | |||
| WMB / The Williams Companies, Inc. | 0,02 | −25,99 | 1,07 | −22,18 | 0,6446 | −0,2242 | |||
| CDW / CDW Corporation | 0,01 | −0,39 | 1,05 | 10,97 | 0,6343 | 0,0352 | |||
| JNJ / Johnson & Johnson | 0,01 | 0,19 | 1,04 | −7,79 | 0,6282 | −0,0855 | |||
| NSC / Norfolk Southern Corporation | 0,00 | −0,48 | 1,02 | 7,61 | 0,6135 | 0,0155 | |||
| MZTI / The Marzetti Company | 0,01 | 0,33 | 0,99 | −1,01 | 0,5939 | −0,0347 | |||
| WMT / Walmart Inc. | 0,01 | −0,56 | 0,98 | 10,80 | 0,5873 | 0,0314 | |||
| LKQ / LKQ Corporation | 0,03 | −0,88 | 0,96 | −13,76 | 0,5777 | −0,1247 | |||
| JPM / JPMorgan Chase & Co. | 0,00 | −0,60 | 0,91 | 17,55 | 0,5490 | 0,0591 | |||
| VZ / Verizon Communications Inc. | 0,02 | −5,61 | 0,91 | −10,00 | 0,5479 | −0,0901 | |||
| MNRO / Monro, Inc. | 0,06 | 6,23 | 0,90 | 9,58 | 0,5446 | 0,0230 | |||
| MRK / Merck & Co., Inc. | 0,01 | −5,88 | 0,87 | −17,02 | 0,5260 | −0,1384 | |||
| SLRC / SLR Investment Corp. | 0,05 | −13,06 | 0,87 | −16,73 | 0,5247 | −0,1363 | |||
| AVGO / Broadcom Inc. | 0,00 | −2,23 | 0,81 | 61,23 | 0,4886 | 0,1704 | |||
| LAND / Gladstone Land Corporation | 0,08 | 2,96 | 0,76 | −0,52 | 0,4595 | −0,0245 | |||
| BRK.A / Berkshire Hathaway Inc. | 0,00 | 0,00 | 0,73 | −8,77 | 0,4390 | −0,0652 | |||
| GENC / Gencor Industries, Inc. | 0,05 | 14,77 | 0,68 | 32,10 | 0,4095 | 0,0846 | |||
| TITN / Titan Machinery Inc. | 0,03 | 0,67 | 0,4024 | 0,4024 | |||||
| UTI / Universal Technical Institute, Inc. | 0,02 | −70,74 | 0,65 | −61,43 | 0,3897 | −0,6682 | |||
| V / Visa Inc. | 0,00 | −3,36 | 0,63 | −2,01 | 0,3813 | −0,0270 | |||
| SHEL / Shell plc - Depositary Receipt (Common Stock) | 0,01 | −6,81 | 0,56 | −10,48 | 0,3347 | −0,0572 | |||
| MA / Mastercard Incorporated | 0,00 | −9,22 | 0,53 | −6,84 | 0,3199 | −0,0405 | |||
| CMDY / iShares U.S. ETF Trust - iShares Bloomberg Roll Select Commodity Strategy ETF | 0,01 | 7,71 | 0,50 | 4,59 | 0,3023 | −0,0004 | |||
| WTRG / Essential Utilities, Inc. | 0,01 | −1,20 | 0,45 | −7,22 | 0,2716 | −0,0352 | |||
| BINC / BlackRock ETF Trust II - iShares Flexible Income Active ETF | 0,01 | −8,03 | 0,43 | −7,26 | 0,2617 | −0,0340 | |||
| IAU / iShares Gold Trust | 0,01 | 9,26 | 0,40 | 15,36 | 0,2403 | 0,0223 | |||
| JBBB / Janus Detroit Street Trust - Janus Henderson B-BBB CLO ETF | 0,01 | −3,24 | 0,40 | −4,12 | 0,2386 | −0,0224 | |||
| IVW / iShares Trust - iShares S&P 500 Growth ETF | 0,00 | 0,00 | 0,38 | 18,55 | 0,2273 | 0,0264 | |||
| HUM / Humana Inc. | 0,00 | −0,13 | 0,37 | −7,71 | 0,2238 | −0,0305 | |||
| VUG / Vanguard Index Funds - Vanguard Growth ETF | 0,00 | 0,00 | 0,37 | 18,27 | 0,2223 | 0,0252 | |||
| VSTS / Vestis Corporation | 0,06 | 1,33 | 0,35 | −41,39 | 0,2137 | −0,1683 | |||
| FMC / FMC Corporation | 0,01 | −0,87 | 0,31 | −1,91 | 0,1856 | −0,0128 | |||
| RVTY / Revvity, Inc. | 0,00 | −11,64 | 0,30 | −19,36 | 0,1835 | −0,0547 | |||
| VIRT / Virtu Financial, Inc. | 0,01 | −85,56 | 0,29 | −83,06 | 0,1750 | −0,9064 | |||
| VTV / Vanguard Index Funds - Vanguard Value ETF | 0,00 | 0,00 | 0,28 | 2,20 | 0,1685 | −0,0042 | |||
| EQT / EQT Corporation | 0,00 | −0,05 | 0,24 | 9,17 | 0,1434 | 0,0056 | |||
| DG / Dollar General Corporation | 0,00 | 0,24 | 0,1420 | 0,1420 | |||||
| DLN / WisdomTree Trust - WisdomTree U.S. LargeCap Dividend Fund | 0,00 | 0,00 | 0,22 | 3,24 | 0,1347 | −0,0018 | |||
| KO / The Coca-Cola Company | 0,00 | −18,19 | 0,21 | −19,29 | 0,1238 | −0,0368 | |||
| PG / The Procter & Gamble Company | 0,00 | −100,00 | 0,00 | 0,0000 | |||||
| GOLD / Barrick Mining Corporation | 0,00 | −100,00 | 0,00 | 0,0000 | |||||
| HNRG / Hallador Energy Company | 0,00 | −100,00 | 0,00 | 0,0000 | |||||
| MP / MP Materials Corp. | 0,00 | −100,00 | 0,00 | 0,0000 | |||||
| NWE / NorthWestern Energy Group, Inc. | 0,00 | −100,00 | 0,00 | 0,0000 | |||||
| FIGS / FIGS, Inc. | 0,00 | −100,00 | 0,00 | 0,0000 | |||||
| HCWB / HCW Biologics Inc. | 0,00 | −100,00 | 0,00 | 0,0000 |