Grunnleggende statistikk
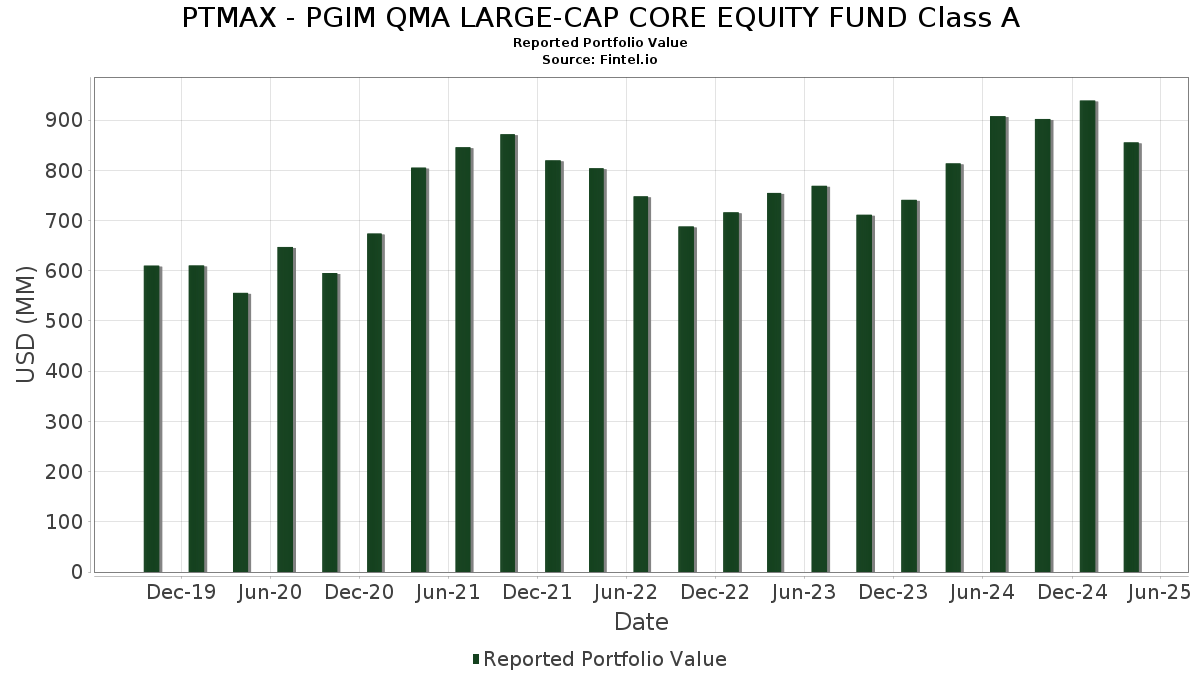
| Porteføljeverdi | $ 855 365 188 |
| Nåværende posisjoner | 191 |
Siste beholdninger, prestasjoner, forvaltet kapital (fra 13F, 13D)
PTMAX - PGIM QMA LARGE-CAP CORE EQUITY FUND Class A har oppgitt 191 totale beholdninger i sine siste SEC-arkiveringer. Siste porteføljeverdi er beregnet til 855 365 188 USD. Faktisk forvaltet kapital (AUM) er denne verdien pluss kontanter (som ikke er oppgitt). PTMAX - PGIM QMA LARGE-CAP CORE EQUITY FUND Class As største beholdninger er Apple Inc. (US:AAPL) , Microsoft Corporation (US:MSFT) , NVIDIA Corporation (US:NVDA) , Amazon.com, Inc. (US:AMZN) , and Meta Platforms, Inc. (US:META) . PTMAX - PGIM QMA LARGE-CAP CORE EQUITY FUND Class As nye posisjoner inkluderer Natera, Inc. (US:NTRA) , Compass, Inc. (US:COMP) , Ameren Corporation (US:AEE) , Skyward Specialty Insurance Group, Inc. (US:SKWD) , and The Boston Beer Company, Inc. (US:SAM) .
De største økningene dette kvartalet
Vi bruker endringen i porteføljeallokeringen fordi dette er det mest meningsfulle målet. Endringer kan skyldes handler eller endringer i aksjekursene.
| Verdipapirer | Aksjer (MM) |
Verdi (MM$) |
Portefølje % | ΔPortefølje % |
|---|---|---|---|---|
| 10,85 | 10,85 | 1,2897 | 1,2897 | |
| 10,85 | 10,85 | 1,2897 | 1,2897 | |
| 0,14 | 53,55 | 6,3655 | 0,7943 | |
| 0,03 | 6,14 | 0,7298 | 0,6993 | |
| 0,01 | 5,77 | 0,6855 | 0,6563 | |
| 0,02 | 16,99 | 2,0196 | 0,6456 | |
| 0,04 | 14,04 | 1,6684 | 0,6442 | |
| 0,03 | 5,63 | 0,6693 | 0,6197 | |
| 0,03 | 7,30 | 0,8674 | 0,5917 | |
| 0,09 | 7,94 | 0,9439 | 0,5870 |
De største reduksjonene dette kvartalet
Vi bruker endringen i porteføljeallokeringen fordi dette er det mest meningsfulle målet. Endringer kan skyldes handler eller endringer i aksjekurser.
| Verdipapirer | Aksjer (MM) |
Verdi (MM$) |
Portefølje % | ΔPortefølje % |
|---|---|---|---|---|
| 0,03 | 8,75 | 1,0397 | −1,2277 | |
| 0,00 | 0,29 | 0,0341 | −0,8882 | |
| 0,19 | 34,97 | 4,1572 | −0,7134 | |
| 0,02 | 3,45 | 0,4098 | −0,6983 | |
| 0,00 | 4,77 | 0,5674 | −0,5601 | |
| 0,04 | 3,60 | 0,4277 | −0,5355 | |
| 0,01 | 0,59 | 0,0699 | −0,5191 | |
| 0,11 | 17,75 | 2,1100 | −0,5154 | |
| 0,01 | 1,02 | 0,1207 | −0,4894 | |
| 0,00 | 0,00 | −0,4718 |
13F- og Fondsarkiveringer
Dette skjemaet ble sendt inn den 2025-06-25 for rapporteringsperioden 2025-04-30. Klikk på lenkeikonet for å se hele transaksjonshistorikken.
Oppgradere for å låse opp premiedata og eksportere til Excel![]() .
.
| Verdipapirer | Type | Gjennomsnittlig aksjekurs | Aksjer (MM) |
ΔAksjer (%) |
ΔAksjer (%) |
Verdi ($MM) |
Portefølje (%) |
ΔPortefølje (%) |
|
|---|---|---|---|---|---|---|---|---|---|
| AAPL / Apple Inc. | 0,29 | −2,96 | 62,11 | −12,62 | 7,3828 | −0,1901 | |||
| MSFT / Microsoft Corporation | 0,14 | 7,54 | 53,55 | 2,41 | 6,3655 | 0,7943 | |||
| NVDA / NVIDIA Corporation | 0,44 | −5,37 | 47,99 | −14,16 | 5,7045 | −0,2517 | |||
| AMZN / Amazon.com, Inc. | 0,19 | −1,40 | 34,97 | −23,50 | 4,1572 | −0,7134 | |||
| META / Meta Platforms, Inc. | 0,04 | 0,49 | 22,72 | −19,95 | 2,7004 | −0,3233 | |||
| AVGO / Broadcom Inc. | 0,11 | 27,91 | 20,29 | 11,27 | 2,4114 | 0,4688 | |||
| GOOGL / Alphabet Inc. | 0,11 | −7,45 | 17,75 | −27,97 | 2,1100 | −0,5154 | |||
| LLY / Eli Lilly and Company | 0,02 | 18,87 | 16,99 | 31,75 | 2,0196 | 0,6456 | |||
| GOOG / Alphabet Inc. | 0,09 | −8,15 | 14,88 | −28,12 | 1,7683 | −0,4367 | |||
| V / Visa Inc. | 0,04 | 44,44 | 14,04 | 46,00 | 1,6684 | 0,6442 | |||
| MA / Mastercard Incorporated | 0,02 | 25,97 | 12,50 | 24,29 | 1,4853 | 0,4142 | |||
| BRK.B / Berkshire Hathaway Inc. | 0,02 | 0,00 | 12,30 | 13,78 | 1,4626 | 0,3104 | |||
| (PIPA070) PGIM Core Government Money Market Fund / STIV (000000000) | 10,85 | 10,85 | 1,2897 | 1,2897 | |||||
| (PIPA070) PGIM Core Government Money Market Fund / STIV (000000000) | 10,85 | 10,85 | 1,2897 | 1,2897 | |||||
| KO / The Coca-Cola Company | 0,13 | 39,70 | 9,45 | 59,67 | 1,1228 | 0,4925 | |||
| NFLX / Netflix, Inc. | 0,01 | 0,00 | 8,94 | 15,86 | 1,0627 | 0,2406 | |||
| TSLA / Tesla, Inc. | 0,03 | −41,06 | 8,75 | −58,90 | 1,0397 | −1,2277 | |||
| CSCO / Cisco Systems, Inc. | 0,15 | −1,05 | 8,71 | −5,74 | 1,0354 | 0,0509 | |||
| JPM / JPMorgan Chase & Co. | 0,03 | −32,64 | 8,53 | −38,36 | 1,0142 | −0,4604 | |||
| MRK / Merck & Co., Inc. | 0,09 | 174,93 | 7,94 | 137,09 | 0,9439 | 0,5870 | |||
| BKNG / Booking Holdings Inc. | 0,00 | 7,80 | 7,75 | 16,04 | 0,9213 | 0,2096 | |||
| QCOM / QUALCOMM Incorporated | 0,05 | 0,00 | 7,57 | −14,15 | 0,9000 | −0,0396 | |||
| CRM / Salesforce, Inc. | 0,03 | −12,50 | 7,34 | −31,20 | 0,8720 | −0,2639 | |||
| PGR / The Progressive Corporation | 0,03 | 146,67 | 7,30 | 182,06 | 0,8674 | 0,5917 | |||
| DIS / The Walt Disney Company | 0,08 | 33,22 | 7,26 | 7,16 | 0,8627 | 0,1412 | |||
| HD / The Home Depot, Inc. | 0,02 | 43,88 | 7,21 | 25,90 | 0,8570 | 0,2469 | |||
| MMM / 3M Company | 0,05 | −8,77 | 7,08 | −16,73 | 0,8421 | −0,0644 | |||
| MO / Altria Group, Inc. | 0,12 | 0,00 | 7,01 | 13,25 | 0,8332 | 0,1738 | |||
| AMGN / Amgen Inc. | 0,02 | 76,98 | 6,49 | 80,39 | 0,7712 | 0,3880 | |||
| TMUS / T-Mobile US, Inc. | 0,03 | 143,40 | 6,37 | 158,04 | 0,7573 | 0,4942 | |||
| NOC / Northrop Grumman Corporation | 0,01 | 4,07 | 6,23 | 3,90 | 0,7402 | 0,1017 | |||
| ADI / Analog Devices, Inc. | 0,03 | 2 525,00 | 6,14 | 2 116,25 | 0,7298 | 0,6993 | |||
| GE / General Electric Company | 0,03 | −1,97 | 6,03 | −2,93 | 0,7163 | 0,0548 | |||
| SPGI / S&P Global Inc. | 0,01 | −14,89 | 6,00 | −18,38 | 0,7133 | −0,0700 | |||
| ABBV / AbbVie Inc. | 0,03 | 68,69 | 5,94 | 78,97 | 0,7062 | 0,3525 | |||
| LMT / Lockheed Martin Corporation | 0,01 | 48,19 | 5,88 | 52,94 | 0,6985 | 0,2891 | |||
| EQIX / Equinix, Inc. | 0,01 | 2 133,33 | 5,77 | 2 004,74 | 0,6855 | 0,6563 | |||
| PM / Philip Morris International Inc. | 0,03 | 153,08 | 5,64 | 233,16 | 0,6701 | 0,4898 | |||
| CEG / Constellation Energy Corporation | 0,03 | 1 382,35 | 5,63 | 1 159,51 | 0,6693 | 0,6197 | |||
| XOM / Exxon Mobil Corporation | 0,05 | −35,15 | 5,54 | −35,87 | 0,6579 | −0,2617 | |||
| CNC / Centene Corporation | 0,09 | 0,00 | 5,46 | −6,53 | 0,6488 | 0,0267 | |||
| ALL / The Allstate Corporation | 0,03 | 0,00 | 5,44 | 3,15 | 0,6461 | 0,0847 | |||
| GM / General Motors Company | 0,12 | 1,81 | 5,34 | −6,89 | 0,6351 | 0,0238 | |||
| ADSK / Autodesk, Inc. | 0,02 | 207,94 | 5,32 | 171,29 | 0,6324 | 0,4235 | |||
| PFE / Pfizer Inc. | 0,21 | −21,43 | 5,14 | −27,67 | 0,6108 | −0,1462 | |||
| EMR / Emerson Electric Co. | 0,05 | 0,83 | 5,10 | −18,45 | 0,6060 | −0,0600 | |||
| CTSH / Cognizant Technology Solutions Corporation | 0,07 | 0,00 | 5,08 | −10,95 | 0,6034 | −0,0039 | |||
| UNP / Union Pacific Corporation | 0,02 | 40,12 | 5,05 | 21,94 | 0,5999 | 0,1590 | |||
| TGT / Target Corporation | 0,05 | 40,05 | 5,04 | −9,73 | 0,5989 | −0,0202 | |||
| YUM / Yum! Brands, Inc. | 0,03 | 334,67 | 4,90 | 459,18 | 0,5830 | 0,4737 | |||
| NRG / NRG Energy, Inc. | 0,04 | −12,18 | 4,90 | −6,06 | 0,5822 | 0,0267 | |||
| TFC / Truist Financial Corporation | 0,13 | 0,00 | 4,88 | −19,50 | 0,5802 | −0,0657 | |||
| CVX / Chevron Corporation | 0,04 | 688,89 | 4,83 | 619,82 | 0,5741 | 0,5026 | |||
| ADP / Automatic Data Processing, Inc. | 0,02 | 1 490,00 | 4,78 | 1 882,99 | 0,5681 | 0,5384 | |||
| COST / Costco Wholesale Corporation | 0,00 | −55,56 | 4,77 | −54,90 | 0,5674 | −0,5601 | |||
| CRH / CRH plc | 0,05 | 0,00 | 4,77 | −3,64 | 0,5671 | 0,0396 | |||
| TMO / Thermo Fisher Scientific Inc. | 0,01 | −30,35 | 4,73 | −50,01 | 0,5616 | −0,4455 | |||
| ANET / Arista Networks Inc | 0,06 | 42,39 | 4,70 | 1,67 | 0,5584 | 0,0661 | |||
| MDT / Medtronic plc | 0,05 | −29,77 | 4,62 | −34,45 | 0,5491 | −0,2018 | |||
| PYPL / PayPal Holdings, Inc. | 0,07 | 0,00 | 4,60 | −25,67 | 0,5463 | −0,1125 | |||
| FDX / FedEx Corporation | 0,02 | 193,24 | 4,56 | 132,86 | 0,5425 | 0,3337 | |||
| INTU / Intuit Inc. | 0,01 | 242,86 | 4,52 | 252,62 | 0,5370 | 0,3949 | |||
| GILD / Gilead Sciences, Inc. | 0,04 | 125,00 | 4,51 | 146,63 | 0,5357 | 0,3410 | |||
| DXCM / DexCom, Inc. | 0,06 | 2 307,69 | 4,47 | 1 318,41 | 0,5311 | 0,4861 | |||
| LOW / Lowe's Companies, Inc. | 0,02 | −30,63 | 4,40 | −40,37 | 0,5235 | −0,2633 | |||
| SNOW / Snowflake Inc. | 0,03 | 62,05 | 4,29 | 42,38 | 0,5100 | 0,1890 | |||
| USB / U.S. Bancorp | 0,11 | 89,43 | 4,26 | 59,90 | 0,5068 | 0,2228 | |||
| ABT / Abbott Laboratories | 0,03 | −40,08 | 4,14 | −38,76 | 0,4927 | −0,2283 | |||
| CMS / CMS Energy Corporation | 0,06 | 1,08 | 4,14 | 12,81 | 0,4920 | 0,1010 | |||
| REZI / Resideo Technologies, Inc. | 0,24 | 58,46 | 4,08 | 18,07 | 0,4855 | 0,1169 | |||
| UPS / United Parcel Service, Inc. | 0,04 | −17,79 | 3,96 | −31,42 | 0,4712 | −0,1446 | |||
| DRI / Darden Restaurants, Inc. | 0,02 | 120,48 | 3,67 | 126,60 | 0,4364 | 0,2638 | |||
| GNW / Genworth Financial, Inc. | 0,53 | 0,00 | 3,64 | −5,11 | 0,4328 | 0,0240 | |||
| WMT / Walmart Inc. | 0,04 | −59,83 | 3,60 | −60,20 | 0,4277 | −0,5355 | |||
| BK / The Bank of New York Mellon Corporation | 0,04 | −30,99 | 3,55 | −35,41 | 0,4215 | −0,1635 | |||
| JNJ / Johnson & Johnson | 0,02 | −67,73 | 3,45 | −66,86 | 0,4098 | −0,6983 | |||
| PLD / Prologis, Inc. | 0,03 | 45,81 | 3,38 | 24,98 | 0,4021 | 0,1137 | |||
| INTA / Intapp, Inc. | 0,06 | −15,49 | 3,37 | −35,68 | 0,4012 | −0,1578 | |||
| WCC / WESCO International, Inc. | 0,02 | 1 246,67 | 3,29 | 1 423,61 | 0,3913 | 0,3605 | |||
| COP / ConocoPhillips | 0,04 | 16,61 | 3,13 | 5,18 | 0,3718 | 0,0549 | |||
| BA / The Boeing Company | 0,02 | 8,28 | 3,12 | 18,22 | 0,3703 | 0,0467 | |||
| JHG / Janus Henderson Group plc | 0,09 | 147,23 | 3,11 | 82,78 | 0,3699 | 0,1885 | |||
| ECL / Ecolab Inc. | 0,01 | 70,42 | 3,04 | 71,28 | 0,3616 | 0,1724 | |||
| DHR / Danaher Corporation | 0,02 | −36,93 | 3,03 | −43,57 | 0,3601 | −0,2118 | |||
| VRNT / Verint Systems Inc. | 0,16 | 39,62 | 2,87 | −2,97 | 0,3414 | 0,0261 | |||
| VZ / Verizon Communications Inc. | 0,06 | −57,56 | 2,77 | −52,53 | 0,3294 | −0,2925 | |||
| AWK / American Water Works Company, Inc. | 0,02 | 190,16 | 2,60 | 244,18 | 0,3093 | 0,2071 | |||
| UNH / UnitedHealth Group Incorporated | 0,01 | −18,18 | 2,59 | −37,95 | 0,3081 | −0,1369 | |||
| United States Treasury Bill / DBT (US912797PS04) | 2,59 | 0,3074 | 0,3074 | ||||||
| United States Treasury Bill / DBT (US912797PS04) | 2,59 | 0,3074 | 0,3074 | ||||||
| MET / MetLife, Inc. | 0,03 | −55,56 | 2,53 | −57,29 | 0,3010 | −0,3566 | |||
| BIIB / Biogen Inc. | 0,02 | −5,05 | 2,51 | −20,11 | 0,2979 | −0,0364 | |||
| DD / DuPont de Nemours, Inc. | 0,04 | −38,13 | 2,44 | −46,84 | 0,2902 | −0,1991 | |||
| UNFI / United Natural Foods, Inc. | 0,09 | −21,72 | 2,44 | −29,71 | 0,2896 | −0,0796 | |||
| MS / Morgan Stanley | 0,02 | 8,25 | 2,42 | −9,76 | 0,2881 | 0,0020 | |||
| ICE / Intercontinental Exchange, Inc. | 0,01 | −45,95 | 2,35 | −43,20 | 0,2795 | −0,1615 | |||
| PG / The Procter & Gamble Company | 0,01 | −3,40 | 2,31 | −5,38 | 0,2741 | 0,0144 | |||
| PANW / Palo Alto Networks, Inc. | 0,01 | −30,51 | 2,30 | −28,80 | 0,2733 | −0,1876 | |||
| PSA / Public Storage | 0,01 | −58,92 | 2,28 | −58,65 | 0,2714 | −0,3169 | |||
| C / Citigroup Inc. | 0,03 | 90,24 | 2,13 | 59,78 | 0,2536 | 0,1113 | |||
| FIS / Fidelity National Information Services, Inc. | 0,03 | −60,00 | 2,11 | −61,29 | 0,2513 | −0,3303 | |||
| T / AT&T Inc. | 0,07 | −41,08 | 2,06 | −31,23 | 0,2451 | −0,0743 | |||
| ALSN / Allison Transmission Holdings, Inc. | 0,02 | −0,89 | 2,06 | −22,24 | 0,2445 | −0,0373 | |||
| SYK / Stryker Corporation | 0,01 | −6,78 | 2,06 | 3,58 | 0,2445 | 0,0007 | |||
| VLO / Valero Energy Corporation | 0,02 | −46,11 | 2,01 | −52,96 | 0,2387 | −0,2161 | |||
| ENR / Energizer Holdings, Inc. | 0,07 | 337,13 | 1,97 | 268,79 | 0,2346 | 0,1752 | |||
| ETN / Eaton Corporation plc | 0,01 | −23,86 | 1,97 | −31,34 | 0,2344 | −0,0716 | |||
| GPN / Global Payments Inc. | 0,03 | 1,94 | 0,2304 | 0,2304 | |||||
| NTRA / Natera, Inc. | 0,01 | 1,93 | 0,2296 | 0,2296 | |||||
| PEP / PepsiCo, Inc. | 0,01 | −36,20 | 1,91 | −47,93 | 0,2272 | −0,1799 | |||
| CSX / CSX Corporation | 0,07 | −59,86 | 1,88 | −66,51 | 0,2236 | −0,3992 | |||
| NI / NiSource Inc. | 0,05 | 1,05 | 1,88 | 52,23 | 0,2231 | 0,0566 | |||
| CL / Colgate-Palmolive Company | 0,02 | −61,87 | 1,81 | −59,47 | 0,2148 | −0,2600 | |||
| COMP / Compass, Inc. | 0,23 | 1,79 | 0,2123 | 0,2123 | |||||
| GIII / G-III Apparel Group, Ltd. | 0,07 | 0,00 | 1,78 | −19,22 | 0,2113 | −0,0232 | |||
| WFC / Wells Fargo & Company | 0,03 | −50,59 | 1,78 | −40,87 | 0,2110 | −0,1196 | |||
| AEE / Ameren Corporation | 0,02 | 1,75 | 0,2076 | 0,2076 | |||||
| RTX / RTX Corporation | 0,01 | 177,08 | 1,68 | 171,36 | 0,1994 | 0,1335 | |||
| SKWD / Skyward Specialty Insurance Group, Inc. | 0,03 | 1,67 | 0,1982 | 0,1982 | |||||
| HON / Honeywell International Inc. | 0,01 | 129,41 | 1,64 | 135,78 | 0,1952 | 0,1185 | |||
| CI / The Cigna Group | 0,00 | −60,83 | 1,60 | −54,73 | 0,1900 | −0,1862 | |||
| TNC / Tennant Company | 0,02 | 0,00 | 1,58 | −15,60 | 0,1878 | −0,0117 | |||
| SBUX / Starbucks Corporation | 0,02 | −47,18 | 1,58 | −54,58 | 0,1875 | −0,2812 | |||
| SYF / Synchrony Financial | 0,03 | 1,52 | 0,1809 | 0,1809 | |||||
| POR / Portland General Electric Company | 0,04 | 51,71 | 1,50 | 55,41 | 0,1777 | 0,0752 | |||
| ALTM / Arcadium Lithium plc | 0,04 | −29,09 | 1,45 | −54,50 | 0,1725 | −0,1673 | |||
| JLL / Jones Lang LaSalle Incorporated | 0,01 | 0,00 | 1,43 | −19,60 | 0,1703 | −0,0195 | |||
| FTNT / Fortinet, Inc. | 0,01 | −61,69 | 1,41 | −60,60 | 0,1677 | −0,2138 | |||
| ZBRA / Zebra Technologies Corporation | 0,01 | 51,35 | 1,40 | −3,38 | 0,1666 | 0,0121 | |||
| BLMN / Bloomin' Brands, Inc. | 0,17 | 592,80 | 1,39 | 342,36 | 0,1651 | 0,1317 | |||
| NDAQ / Nasdaq, Inc. | 0,02 | 133,33 | 1,39 | 116,04 | 0,1649 | 0,0964 | |||
| MCK / McKesson Corporation | 0,00 | −9,52 | 1,35 | 8,49 | 0,1610 | 0,0279 | |||
| AVA / Avista Corporation | 0,03 | −63,89 | 1,33 | −59,11 | 0,1582 | −0,1886 | |||
| WMB / The Williams Companies, Inc. | 0,02 | −58,48 | 1,25 | −56,14 | 0,1483 | −0,1547 | |||
| ELAN / Elanco Animal Health Incorporated | 0,13 | 45,24 | 1,19 | 14,48 | 0,1411 | 0,0306 | |||
| AMAT / Applied Materials, Inc. | 0,01 | 271,43 | 1,18 | 210,85 | 0,1397 | 0,0994 | |||
| GS / The Goldman Sachs Group, Inc. | 0,00 | 0,00 | 1,15 | −14,51 | 0,1367 | −0,0066 | |||
| EXPE / Expedia Group, Inc. | 0,01 | 1,15 | 0,1362 | 0,1362 | |||||
| ADBE / Adobe Inc. | 0,00 | 16,00 | 1,09 | −0,55 | 0,1293 | 0,0127 | |||
| SAM / The Boston Beer Company, Inc. | 0,00 | 1,06 | 0,1256 | 0,1256 | |||||
| MU / Micron Technology, Inc. | 0,01 | −76,09 | 1,02 | −81,55 | 0,1207 | −0,4894 | |||
| BKH / Black Hills Corporation | 0,02 | −62,30 | 1,00 | −61,23 | 0,1187 | −0,1669 | |||
| OPCH / Option Care Health, Inc. | 0,03 | 0,98 | 0,1168 | 0,1168 | |||||
| BDX / Becton, Dickinson and Company | 0,00 | −73,49 | 0,91 | −76,50 | 0,1083 | −0,3218 | |||
| FLS / Flowserve Corporation | 0,02 | −62,12 | 0,90 | −72,66 | 0,1075 | −0,2447 | |||
| PSX / Phillips 66 | 0,01 | −19,63 | 0,89 | −29,10 | 0,1064 | −0,0280 | |||
| DOV / Dover Corporation | 0,01 | 30,00 | 0,89 | 32,78 | 0,1055 | 0,0257 | |||
| FNF / Fidelity National Financial, Inc. | 0,01 | 0,83 | 0,0990 | 0,0990 | |||||
| ACN / Accenture plc | 0,00 | 0,81 | 0,0960 | 0,0960 | |||||
| KMPR / Kemper Corporation | 0,01 | 84,85 | 0,72 | 62,75 | 0,0857 | 0,0385 | |||
| INGR / Ingredion Incorporated | 0,01 | −84,21 | 0,72 | −84,63 | 0,0853 | −0,4119 | |||
| TRV / The Travelers Companies, Inc. | 0,00 | −53,57 | 0,69 | −50,04 | 0,0816 | −0,0647 | |||
| DTE / DTE Energy Company | 0,00 | −82,50 | 0,67 | −80,01 | 0,0798 | −0,2778 | |||
| CMCO / Columbus McKinnon Corporation | 0,04 | 0,67 | 0,0794 | 0,0794 | |||||
| HAIN / The Hain Celestial Group, Inc. | 0,21 | 164,00 | 0,65 | 58,54 | 0,0774 | 0,0336 | |||
| LH / Labcorp Holdings Inc. | 0,00 | 0,65 | 0,0774 | 0,0774 | |||||
| GWW / W.W. Grainger, Inc. | 0,00 | −78,57 | 0,61 | −70,30 | 0,0731 | −0,1965 | |||
| MPC / Marathon Petroleum Corporation | 0,00 | −80,37 | 0,59 | −85,17 | 0,0702 | −0,4185 | |||
| LRCX / Lam Research Corporation | 0,01 | −87,98 | 0,59 | −89,38 | 0,0699 | −0,5191 | |||
| CE / Celanese Corporation | 0,01 | 163,83 | 0,55 | −24,73 | 0,0656 | −0,0218 | |||
| S&P500 EMINI / DE (000000000) | 0,50 | 0,0597 | 0,0597 | ||||||
| CWEN / Clearway Energy, Inc. | 0,02 | 0,50 | 0,0593 | 0,0593 | |||||
| BAC / Bank of America Corporation | 0,01 | −74,69 | 0,49 | −78,22 | 0,0583 | −0,1814 | |||
| LYV / Live Nation Entertainment, Inc. | 0,00 | 0,48 | 0,0567 | 0,0567 | |||||
| HPQ / HP Inc. | 0,02 | 104,71 | 0,44 | 60,87 | 0,0529 | 0,0235 | |||
| AEP / American Electric Power Company, Inc. | 0,00 | −57,45 | 0,43 | −53,14 | 0,0515 | −0,0470 | |||
| ST / Sensata Technologies Holding plc | 0,02 | 0,43 | 0,0511 | 0,0511 | |||||
| 2IY / Cushman & Wakefield plc | 0,05 | 160,57 | 0,43 | 111,39 | 0,0508 | 0,0210 | |||
| BDC / Belden Inc. | 0,00 | 0,42 | 0,0503 | 0,0503 | |||||
| ROK / Rockwell Automation, Inc. | 0,00 | −62,22 | 0,42 | −72,17 | 0,0500 | −0,1472 | |||
| VTR / Ventas, Inc. | 0,01 | −35,48 | 0,42 | −25,13 | 0,0500 | −0,0099 | |||
| PRIM / Primoris Services Corporation | 0,01 | 0,41 | 0,0485 | 0,0485 | |||||
| STT / State Street Corporation | 0,00 | −75,00 | 0,41 | −78,33 | 0,0482 | −0,1510 | |||
| DVN / Devon Energy Corporation | 0,01 | −85,24 | 0,40 | −88,41 | 0,0470 | −0,3310 | |||
| AES / The AES Corporation | 0,04 | 0,39 | 0,0464 | 0,0464 | |||||
| BTU / Peabody Energy Corporation | 0,03 | 61,66 | 0,39 | −25,24 | 0,0458 | −0,0238 | |||
| FIVN / Five9, Inc. | 0,01 | 0,35 | 0,0418 | 0,0418 | |||||
| FLR / Fluor Corporation | 0,01 | 0,33 | 0,0398 | 0,0398 | |||||
| SYNA / Synaptics Incorporated | 0,01 | −53,23 | 0,32 | −69,39 | 0,0384 | −0,0738 | |||
| BSX / Boston Scientific Corporation | 0,00 | −80,62 | 0,32 | −80,57 | 0,0379 | −0,1366 | |||
| TDC / Teradata Corporation | 0,01 | 0,00 | 0,31 | −32,68 | 0,0371 | −0,0122 | |||
| TEX / Terex Corporation | 0,01 | −69,97 | 0,31 | −79,60 | 0,0368 | −0,1312 | |||
| PH / Parker-Hannifin Corporation | 0,00 | 25,00 | 0,30 | 7,09 | 0,0360 | 0,0058 | |||
| THC / Tenet Healthcare Corporation | 0,00 | 0,30 | 0,0357 | 0,0357 | |||||
| NOW / ServiceNow, Inc. | 0,00 | −96,47 | 0,29 | −96,70 | 0,0341 | −0,8882 | |||
| VIAV / Viavi Solutions Inc. | 0,03 | 0,27 | 0,0318 | 0,0318 | |||||
| AMRX / Amneal Pharmaceuticals, Inc. | 0,03 | 0,27 | 0,0317 | 0,0317 | |||||
| GLW / Corning Incorporated | 0,01 | −76,28 | 0,27 | −67,28 | 0,0317 | −0,0884 | |||
| AMD / Advanced Micro Devices, Inc. | 0,00 | 0,26 | 0,0312 | 0,0312 | |||||
| PGIM Institutional Money Market Fund - D / STIV (000000000) | 0,19 | 0,19 | 0,0227 | 0,0227 | |||||
| PGIM Institutional Money Market Fund - D / STIV (000000000) | 0,19 | 0,19 | 0,0227 | 0,0227 | |||||
| RJF / Raymond James Financial, Inc. | 0,00 | −100,00 | 0,00 | −100,00 | −0,1274 | ||||
| TVTX / Travere Therapeutics, Inc. | 0,00 | −100,00 | 0,00 | −100,00 | −0,2110 | ||||
| CCI / Crown Castle Inc. | 0,00 | −100,00 | 0,00 | −100,00 | −0,4718 | ||||
| HLI / Houlihan Lokey, Inc. | 0,00 | −100,00 | 0,00 | −100,00 | −0,3311 | ||||
| FAF / First American Financial Corporation | 0,00 | −100,00 | 0,00 | −100,00 | −0,1711 | ||||
| CMG / Chipotle Mexican Grill, Inc. | 0,00 | −100,00 | 0,00 | −100,00 | −0,2673 | ||||
| CVNA / Carvana Co. | 0,00 | −100,00 | 0,00 | −100,00 | −0,2689 | ||||
| ROOT / Root, Inc. | 0,00 | −100,00 | 0,00 | −100,00 | −0,0623 | ||||
| NJR / New Jersey Resources Corporation | 0,00 | −100,00 | 0,00 | −100,00 | −0,1073 |