Grunnleggende statistikk
| Porteføljeverdi | $ 220 694 000 |
| Nåværende posisjoner | 123 |
Siste beholdninger, prestasjoner, forvaltet kapital (fra 13F, 13D)
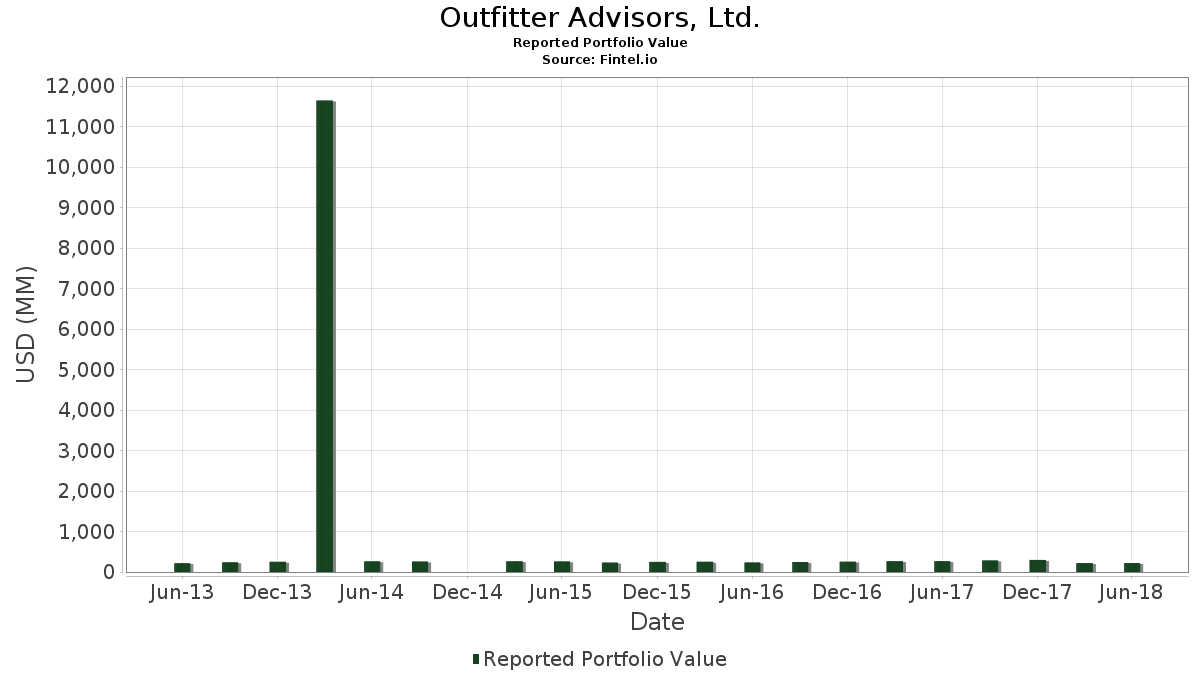
Outfitter Advisors, Ltd. har oppgitt 123 totale beholdninger i sine siste SEC-arkiveringer. Siste porteføljeverdi er beregnet til 220 694 000 USD. Faktisk forvaltet kapital (AUM) er denne verdien pluss kontanter (som ikke er oppgitt). Outfitter Advisors, Ltd.s største beholdninger er Intuit Inc. (US:INTU) , Texas Instruments Incorporated (US:TXN) , Adobe Inc. (US:ADBE) , Vanguard Index Funds - Vanguard Total Stock Market ETF (US:VTI) , and Dominion Energy, Inc. (US:D) . Outfitter Advisors, Ltd.s nye posisjoner inkluderer Sage Therapeutics, Inc. (US:SAGE) , Invesco QQQ Trust, Series 1 (US:QQQ) , Primis Financial Corp. (US:FRST) , The Scotts Miracle-Gro Company (US:SMG) , and Fidelity Securities Fund - Fidelity OTC Portfolio (US:FOCPX) .
De største økningene dette kvartalet
Vi bruker endringen i porteføljeallokeringen fordi dette er det mest meningsfulle målet. Endringer kan skyldes handler eller endringer i aksjekursene.
| Verdipapirer | Aksjer (MM) |
Verdi (MM$) |
Portefølje % | ΔPortefølje % |
|---|---|---|---|---|
| 0,08 | 3,87 | 1,7549 | 1,7549 | |
| 0,06 | 2,92 | 1,3226 | 1,3226 | |
| 0,04 | 2,83 | 1,2810 | 1,2810 | |
| 0,05 | 2,31 | 1,0485 | 1,0485 | |
| 0,01 | 2,29 | 1,0358 | 1,0358 | |
| 0,03 | 1,82 | 0,8251 | 0,8251 | |
| 0,03 | 1,69 | 0,7640 | 0,7640 | |
| 0,02 | 1,32 | 0,5963 | 0,5963 | |
| 0,04 | 1,27 | 0,5768 | 0,5768 | |
| 0,01 | 1,27 | 0,5741 | 0,5741 |
De største reduksjonene dette kvartalet
Vi bruker endringen i porteføljeallokeringen fordi dette er det mest meningsfulle målet. Endringer kan skyldes handler eller endringer i aksjekurser.
| Verdipapirer | Aksjer (MM) |
Verdi (MM$) |
Portefølje % | ΔPortefølje % |
|---|---|---|---|---|
| 0,00 | 0,00 | −1,8621 | ||
| 0,03 | 0,89 | 0,4033 | −0,3329 | |
| 0,06 | 5,91 | 2,6788 | −0,2681 | |
| 0,03 | 6,33 | 2,8669 | −0,2505 | |
| 0,03 | 6,30 | 2,8528 | −0,2225 | |
| 0,02 | 2,98 | 1,3526 | −0,2016 | |
| 0,04 | 3,76 | 1,7055 | −0,1191 | |
| 0,01 | 2,10 | 0,9534 | −0,1095 | |
| 0,01 | 1,10 | 0,4975 | −0,0929 | |
| 0,03 | 2,71 | 1,2266 | −0,0867 |
13F- og Fondsarkiveringer
Dette skjemaet ble sendt inn den 2018-07-23 for rapporteringsperioden 2018-06-30. Klikk på lenkeikonet for å se hele transaksjonshistorikken.
Oppgradere for å låse opp premiedata og eksportere til Excel![]() .
.
| Verdipapirer | Type | Gjennomsnittlig aksjekurs | Aksjer (MM) |
ΔAksjer (%) |
ΔAksjer (%) |
Verdi ($MM) |
Portefølje (%) |
ΔPortefølje (%) |
|
|---|---|---|---|---|---|---|---|---|---|
| INTU / Intuit Inc. | 0,04 | −4,04 | 8,75 | 13,09 | 3,9648 | 0,4293 | |||
| TXN / Texas Instruments Incorporated | 0,07 | −1,68 | 7,64 | 4,34 | 3,4618 | 0,1160 | |||
| ADBE / Adobe Inc. | 0,03 | −12,02 | 7,55 | −0,74 | 3,4197 | −0,0546 | |||
| VTI / Vanguard Index Funds - Vanguard Total Stock Market ETF | 0,05 | 4,76 | 7,33 | 8,40 | 3,3209 | 0,2314 | |||
| D / Dominion Energy, Inc. | 0,10 | 5,91 | 6,59 | 7,09 | 2,9847 | 0,1739 | |||
| BRK.B / Berkshire Hathaway Inc. | 0,03 | −0,89 | 6,33 | −7,26 | 2,8669 | −0,2505 | |||
| FDX / FedEx Corporation | 0,03 | −1,07 | 6,30 | −6,45 | 2,8528 | −0,2225 | |||
| BIIB / Biogen Inc. | 0,02 | 0,43 | 6,10 | 6,45 | 2,7654 | 0,1456 | |||
| CBOE / Cboe Global Markets, Inc. | 0,06 | 0,51 | 5,91 | −8,33 | 2,6788 | −0,2681 | |||
| VANGUARD BAL IDX / MF (921931101) | 0,14 | 4,99 | 0,0000 | ||||||
| RTX / RTX Corporation | 0,04 | 12,57 | 4,89 | 11,85 | 2,2148 | 0,2179 | |||
| DOW / Dow Inc. | 0,07 | −1,28 | 4,86 | 2,17 | 2,2021 | 0,0284 | |||
| 904784709 / Unilever N.V. | 0,08 | −1,17 | 4,71 | −2,34 | 2,1355 | −0,0697 | |||
| CME / CME Group Inc. | 0,03 | 0,48 | 4,61 | 1,83 | 2,0902 | 0,0202 | |||
| COST / Costco Wholesale Corporation | 0,02 | −2,26 | 4,51 | 8,41 | 2,0449 | 0,1426 | |||
| CP / Canadian Pacific Kansas City Limited | 0,02 | −1,15 | 4,32 | 2,49 | 1,9584 | 0,0314 | |||
| XOM / Exxon Mobil Corporation | 0,05 | 1,38 | 3,94 | 12,41 | 1,7848 | 0,1836 | |||
| CBB / Cincinnati Bell, Inc. | 0,08 | −2,00 | 3,87 | −1,10 | 1,7549 | 1,7549 | |||
| KMB / Kimberly-Clark Corporation | 0,04 | −1,43 | 3,76 | −5,74 | 1,7055 | −0,1191 | |||
| VZ / Verizon Communications Inc. | 0,07 | 1,37 | 3,58 | 6,65 | 1,6199 | 0,0882 | |||
| HLUYY / H. Lundbeck AS - ADR | 0,05 | −7,95 | 3,56 | 14,67 | 1,6154 | 0,1947 | |||
| MRK / Merck & Co., Inc. | 0,06 | −0,54 | 3,38 | 10,85 | 1,5320 | 0,1383 | |||
| PG / The Procter & Gamble Company | 0,04 | 1,52 | 3,22 | −0,03 | 1,4577 | −0,0128 | |||
| HES / Hess Corporation | 0,05 | −1,04 | 3,19 | 30,79 | 1,4436 | 0,3305 | |||
| IBM / International Business Machines Corporation | 0,02 | −3,59 | 2,98 | −12,23 | 1,3526 | −0,2016 | |||
| CTTAY / Continental Aktiengesellschaft - Depositary Receipt (Common Stock) | 0,06 | −1,46 | 2,92 | −19,05 | 1,3226 | 1,3226 | |||
| GOOGL / Alphabet Inc. | 0,00 | −0,77 | 2,91 | 8,07 | 1,3172 | 0,0880 | |||
| VNO / Vornado Realty Trust | 0,04 | 0,00 | 2,83 | 9,87 | 1,2810 | 1,2810 | |||
| KO / The Coca-Cola Company | 0,06 | −2,19 | 2,71 | −1,20 | 1,2289 | −0,0255 | |||
| FMX / Fomento Económico Mexicano, S.A.B. de C.V. - Depositary Receipt (Common Stock) | 0,03 | −1,91 | 2,71 | −5,81 | 1,2266 | −0,0867 | |||
| META / Meta Platforms, Inc. | 0,01 | −1,61 | 2,67 | 19,65 | 1,2085 | 0,1899 | |||
| CI / The Cigna Group | 0,01 | 0,00 | 2,53 | 1,32 | 1,1455 | 0,0054 | |||
| US0549371070 / BB&T Corp. | 0,05 | −0,13 | 2,42 | −3,20 | 1,0970 | −0,0459 | |||
| HEINY / Heineken N.V. - Depositary Receipt (Common Stock) | 0,05 | 1,25 | 2,31 | −5,63 | 1,0485 | 1,0485 | |||
| BABA / Alibaba Group Holding Limited - Depositary Receipt (Common Stock) | 0,01 | 16,83 | 2,29 | 18,14 | 1,0358 | 1,0358 | |||
| AMZN / Amazon.com, Inc. | 0,00 | 0,37 | 2,28 | 17,86 | 1,0345 | 0,1493 | |||
| RBCAA / Republic Bancorp, Inc. | 0,05 | 0,00 | 2,15 | 18,27 | 0,9737 | 0,1435 | |||
| MMM / 3M Company | 0,01 | 0,94 | 2,10 | −9,54 | 0,9534 | −0,1095 | |||
| ASAZY / ASSA ABLOY AB (publ) - Depositary Receipt (Common Stock) | 0,18 | −0,65 | 1,95 | −3,23 | 0,8827 | −0,0372 | |||
| WFC / Wells Fargo & Company | 0,03 | −4,50 | 1,93 | 0,99 | 0,8741 | 0,0013 | |||
| CAKE / The Cheesecake Factory Incorporated | 0,03 | 0,00 | 1,82 | 14,17 | 0,8251 | 0,8251 | |||
| DIS / The Walt Disney Company | 0,02 | −0,89 | 1,76 | 3,41 | 0,7975 | 0,0197 | |||
| SCHD / Schwab Strategic Trust - Schwab U.S. Dividend Equity ETF | 0,03 | 6,04 | 1,69 | 6,57 | 0,7640 | 0,7640 | |||
| KVHI / KVH Industries, Inc. | 0,12 | −1,04 | 1,60 | 28,10 | 0,7250 | 0,1542 | |||
| JPM / JPMorgan Chase & Co. | 0,01 | −4,47 | 1,56 | −9,47 | 0,7060 | −0,0805 | |||
| IJR / iShares Trust - iShares Core S&P Small-Cap ETF | 0,02 | 0,00 | 1,52 | 8,41 | 0,6892 | 0,0481 | |||
| NXTM / NxStage Medical, Inc. | 0,05 | −13,64 | 1,46 | −3,06 | 0,6597 | −0,0266 | |||
| JNJ / Johnson & Johnson | 0,01 | −0,91 | 1,45 | −6,21 | 0,6575 | −0,0494 | |||
| PEP / PepsiCo, Inc. | 0,01 | −1,17 | 1,38 | −1,43 | 0,6253 | −0,0144 | |||
| AAPL / Apple Inc. | 0,01 | 0,00 | 1,37 | 10,29 | 0,6217 | 0,0532 | |||
| QCOM / QUALCOMM Incorporated | 0,02 | −2,80 | 1,35 | −1,53 | 0,6113 | −0,0148 | |||
| / TCF Financial Corporation Depositary Shares representing 5.70% Series C Non-Cumulative Preferred Stock | 0,02 | −1,97 | 1,32 | −0,23 | 0,5963 | 0,5963 | |||
| MSFT / Microsoft Corporation | 0,01 | 0,04 | 1,30 | 8,09 | 0,5872 | 0,0393 | |||
| AKZOF / Akzo Nobel N.V. | 0,04 | 4,79 | 1,27 | −6,05 | 0,5768 | 0,5768 | |||
| SLB / Schlumberger Limited | 0,02 | 6,17 | 1,27 | 9,86 | 0,5755 | 0,0472 | |||
| SAGE / Sage Therapeutics, Inc. | 0,01 | 1,27 | 0,5741 | 0,5741 | |||||
| SJM / The J. M. Smucker Company | 0,01 | 0,87 | 1,25 | −12,57 | 0,5673 | 0,5673 | |||
| RIO / Rio Tinto Group - Depositary Receipt (Common Stock) | 0,02 | 4,93 | 1,24 | 12,94 | 0,5614 | 0,5614 | |||
| BA / The Boeing Company | 0,00 | 0,00 | 1,16 | 2,37 | 0,5274 | 0,0079 | |||
| QQQ / Invesco QQQ Trust, Series 1 | 0,01 | 1,16 | 0,5256 | 0,5256 | |||||
| GD / General Dynamics Corporation | 0,01 | 0,68 | 1,10 | −15,02 | 0,4975 | −0,0929 | |||
| DE / Deere & Company | 0,01 | 0,00 | 0,97 | −9,99 | 0,4409 | −0,0531 | |||
| MKL / Markel Group Inc. | 0,00 | 28,44 | 0,93 | 18,93 | 0,4214 | 0,4214 | |||
| BOX / Box, Inc. | 0,04 | −7,84 | 0,93 | 12,11 | 0,4196 | 0,4196 | |||
| AXP / American Express Company | 0,01 | 0,75 | 0,92 | 5,90 | 0,4151 | 0,0198 | |||
| OTCFX / T. Rowe Price Small-Cap Stock Fund Inc - T. Rowe Price Small-Cap Stock Fund | 0,02 | 0,00 | 0,89 | 6,58 | 0,4037 | 0,0217 | |||
| HAIN / The Hain Celestial Group, Inc. | 0,03 | −40,57 | 0,89 | −44,75 | 0,4033 | −0,3329 | |||
| RHT / Red Hat, Inc. | 0,01 | 0,00 | 0,86 | −10,10 | 0,3910 | −0,0476 | |||
| GOOG / Alphabet Inc. | 0,00 | −2,93 | 0,85 | 4,93 | 0,3856 | 0,0150 | |||
| US9229087104 / VANGUARD 500 INDEX FUND VANGUARD 500 INDEX ADM | 0,00 | 0,00 | 0,85 | 3,03 | 0,3847 | 0,3847 | |||
| AUB / Atlantic Union Bankshares Corporation | 0,02 | −3,14 | 0,84 | 2,56 | 0,3806 | 0,3806 | |||
| SPY / SPDR S&P 500 ETF | 0,00 | −1,92 | 0,83 | 1,09 | 0,3774 | 0,0009 | |||
| T / AT&T Inc. | 0,02 | 1,63 | 0,74 | −8,45 | 0,3339 | −0,0339 | |||
| CVX / Chevron Corporation | 0,01 | 3,73 | 0,72 | 14,93 | 0,3244 | 0,0397 | |||
| SRCI / SRC Energy Inc | 0,06 | 0,00 | 0,71 | 16,80 | 0,3213 | 0,3213 | |||
| AMGN / Amgen Inc. | 0,00 | 7,35 | 0,65 | 16,16 | 0,2932 | 0,0386 | |||
| XLU / The Select Sector SPDR Trust - The Utilities Select Sector SPDR Fund | 0,01 | −1,98 | 0,64 | 0,78 | 0,2909 | −0,0002 | |||
| LIND / Lindblad Expeditions Holdings, Inc. | 0,05 | −1,57 | 0,62 | 27,09 | 0,2827 | 0,2827 | |||
| RY / Royal Bank of Canada | 0,01 | 2,23 | 0,60 | −0,50 | 0,2732 | −0,0037 | |||
| CCU / Compañía Cervecerías Unidas S.A. - Depositary Receipt (Common Stock) | 0,02 | −3,18 | 0,57 | −17,87 | 0,2583 | −0,0589 | |||
| ANWPX / New Perspective Fund - American Funds New Perspective Fund Class A | 0,01 | 0,00 | 0,55 | 2,25 | 0,2474 | 0,0034 | |||
| WRE / Washington Real Estate Investment Trust | 0,02 | −4,63 | 0,53 | 5,99 | 0,2406 | 0,0117 | |||
| AWSHX / Washington Mutual Investors Fund - Washington Mutual Investors Fund Class A | 0,01 | 0,00 | 0,51 | −0,97 | 0,2306 | −0,0042 | |||
| GS / The Goldman Sachs Group, Inc. | 0,00 | 0,00 | 0,47 | −12,31 | 0,2130 | −0,0320 | |||
| ETR / Entergy Corporation | 0,01 | −2,53 | 0,47 | 0,00 | 0,2121 | −0,0018 | |||
| ABBV / AbbVie Inc. | 0,01 | 0,00 | 0,46 | −2,11 | 0,2098 | −0,0063 | |||
| VTSAX / Vanguard Index Funds - Vanguard Total Stock Market Index Fund Admiral | 0,01 | 0,00 | 0,45 | 3,48 | 0,2021 | 0,0051 | |||
| IVV / iShares Trust - iShares Core S&P 500 ETF | 0,00 | −5,78 | 0,45 | −3,05 | 0,2016 | −0,0081 | |||
| FUNDAMENTAL INVS / MF (360802102) | 0,01 | 0,44 | 0,0000 | ||||||
| UE / Urban Edge Properties | 0,02 | 0,00 | 0,44 | 7,11 | 0,1980 | 0,1980 | |||
| AMAT / Applied Materials, Inc. | 0,01 | −3,16 | 0,42 | −19,51 | 0,1926 | −0,0487 | |||
| BAX / Baxter International Inc. | 0,01 | −3,39 | 0,42 | 9,64 | 0,1908 | 0,1908 | |||
| DUK / Duke Energy Corporation | 0,01 | 8,59 | 0,40 | 10,92 | 0,1794 | 0,0163 | |||
| BMY / Bristol-Myers Squibb Company | 0,01 | 0,00 | 0,40 | −12,42 | 0,1790 | −0,0271 | |||
| PPG / PPG Industries, Inc. | 0,00 | 0,00 | 0,33 | −7,00 | 0,1504 | −0,0127 | |||
| TXMD / TherapeuticsMD, Inc. | 0,05 | 0,00 | 0,32 | 28,29 | 0,1459 | 0,0312 | |||
| CHUY / Chuy's Holdings, Inc. | 0,01 | −3,29 | 0,32 | 13,26 | 0,1432 | 0,1432 | |||
| FRST / Primis Financial Corp. | 0,02 | 0,30 | 0,1382 | 0,1382 | |||||
| LH / Labcorp Holdings Inc. | 0,00 | 0,00 | 0,30 | 10,91 | 0,1382 | 0,0125 | |||
| IWF / iShares Trust - iShares Russell 1000 Growth ETF | 0,00 | 0,00 | 0,30 | 5,94 | 0,1373 | 0,1373 | |||
| MAR / Marriott International, Inc. | 0,00 | −4,06 | 0,30 | −10,75 | 0,1355 | −0,0176 | |||
| VFINX / Vanguard Index Funds - Vanguard Index Trust 500 Index Fund | 0,00 | 0,00 | 0,30 | 2,77 | 0,1346 | 0,1346 | |||
| CWGIX / Capital World Growth & Income Fund - American Funds Capital World Growth & Income Fund Class A | 0,01 | −8,47 | 0,29 | −8,83 | 0,1310 | −0,0139 | |||
| ABT / Abbott Laboratories | 0,00 | 0,00 | 0,29 | 2,12 | 0,1310 | 0,0016 | |||
| USB / U.S. Bancorp | 0,01 | 0,92 | 0,27 | 0,00 | 0,1242 | −0,0011 | |||
| VBIAX / Vanguard Valley Forge Funds - Vanguard Balanced Index Fund Admiral | 0,01 | 0,00 | 0,27 | 1,87 | 0,1237 | 0,0012 | |||
| ILMN / Illumina, Inc. | 0,00 | 0,00 | 0,26 | 18,47 | 0,1192 | 0,1192 | |||
| PFE / Pfizer Inc. | 0,01 | 15,47 | 0,26 | 18,02 | 0,1187 | 0,0173 | |||
| PM / Philip Morris International Inc. | 0,00 | 0,00 | 0,24 | −18,67 | 0,1106 | −0,0265 | |||
| ATRI / Atrion Corporation | 0,00 | 0,00 | 0,24 | −5,14 | 0,1087 | 0,1087 | |||
| SMG / The Scotts Miracle-Gro Company | 0,00 | 0,22 | 0,1010 | 0,1010 | |||||
| LNC / Lincoln National Corporation | 0,00 | 0,00 | 0,22 | −14,79 | 0,0992 | −0,0182 | |||
| DHR / Danaher Corporation | 0,00 | −4,35 | 0,22 | −3,56 | 0,0983 | −0,0045 | |||
| K / Kellanova | 0,00 | 0,00 | 0,22 | 7,43 | 0,0983 | 0,0060 | |||
| GLD / SPDR Gold Trust | 0,00 | 0,00 | 0,21 | −5,70 | 0,0974 | 0,0974 | |||
| GE / General Electric Company | 0,01 | −12,80 | 0,20 | −11,95 | 0,0902 | −0,0131 | |||
| FCX / Freeport-McMoRan Inc. | 0,01 | 0,00 | 0,18 | −1,60 | 0,0834 | −0,0021 | |||
| TGNA / TEGNA Inc. | 0,01 | 13,14 | 0,14 | 8,21 | 0,0657 | 0,0657 | |||
| FOCPX / Fidelity Securities Fund - Fidelity OTC Portfolio | 0,01 | 0,13 | 0,0585 | 0,0585 | |||||
| NGRJI / NCC Ltd. | 0,01 | 0,00 | 0,04 | 2,86 | 0,0163 | 0,0163 | |||
| AUTLF / Austal Limited | 0,01 | 0,00 | 0,01 | 0,00 | 0,0063 | −0,0001 | |||
| ORHB / ORHub, Inc. | 0,01 | 0,00 | 0,01 | −20,00 | 0,0036 | 0,0036 | |||
| MXSG / Mexus Gold US | 0,28 | 0,00 | 0,00 | −42,86 | 0,0018 | −0,0014 | |||
| AGCO / AGCO Corporation | 0,00 | −100,00 | 0,00 | −100,00 | 0,0000 | 0,0000 | |||
| FKGRX / Franklin Custodian Funds - Franklin Growth Fund Class A1 | 0,00 | −100,00 | 0,00 | −100,00 | 0,0000 | 0,0000 | |||
| OA / Orbital ATK, Inc. | 0,00 | −100,00 | 0,00 | −100,00 | −1,8621 | ||||
| TWO / Two Harbors Investment Corp. | 0,00 | −100,00 | 0,00 | −100,00 | −0,0763 | ||||
| QQQ / Invesco QQQ Trust, Series 1 | 0,00 | −100,00 | 0,00 | −100,00 | 0,0000 | 0,0000 |