Grunnleggende statistikk
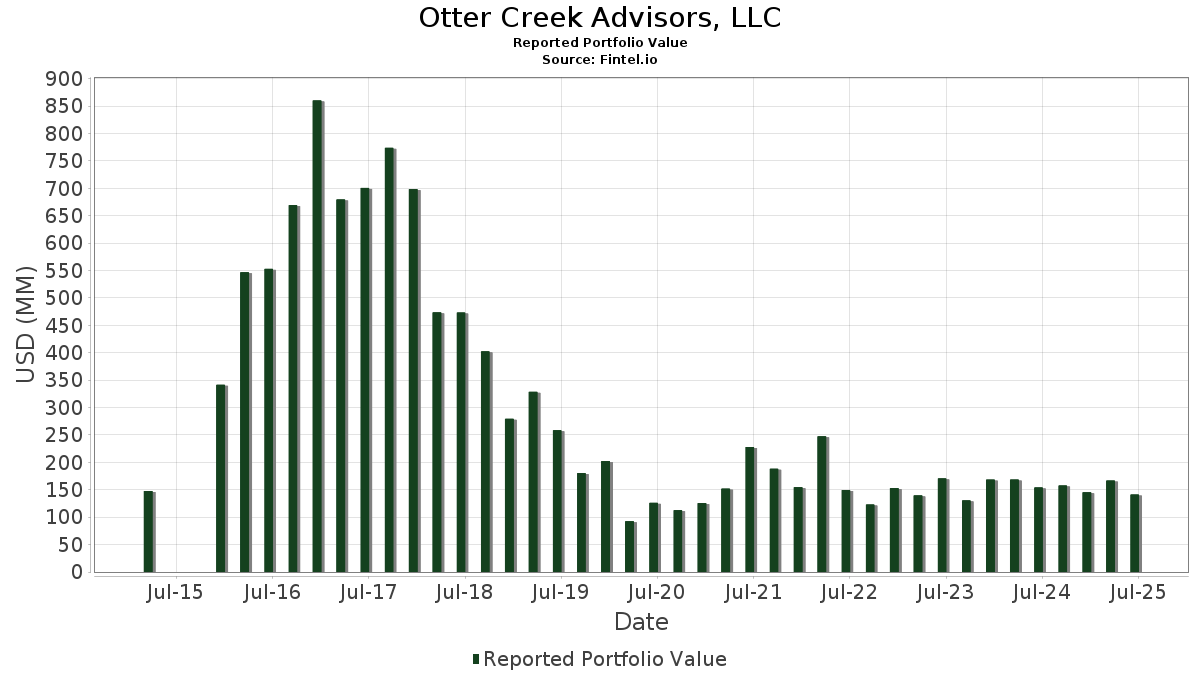
| Porteføljeverdi | $ 141 136 162 |
| Nåværende posisjoner | 40 |
Siste beholdninger, prestasjoner, forvaltet kapital (fra 13F, 13D)
Otter Creek Advisors, LLC har oppgitt 40 totale beholdninger i sine siste SEC-arkiveringer. Siste porteføljeverdi er beregnet til 141 136 162 USD. Faktisk forvaltet kapital (AUM) er denne verdien pluss kontanter (som ikke er oppgitt). Otter Creek Advisors, LLCs største beholdninger er NVIDIA Corporation (US:NVDA) , Vertiv Holdings Co (US:VRT) , Flex Ltd. (US:FLEX) , CompoSecure, Inc. (US:CMPO) , and LPL Financial Holdings Inc. (US:LPLA) . Otter Creek Advisors, LLCs nye posisjoner inkluderer Take-Two Interactive Software, Inc. (US:TTWO) , Workday, Inc. (US:WDAY) , Ryan Specialty Holdings, Inc. (US:RYAN) , EPAM Systems, Inc. (US:EPAM) , and Danaher Corporation (US:DHR) .
De største økningene dette kvartalet
Vi bruker endringen i porteføljeallokeringen fordi dette er det mest meningsfulle målet. Endringer kan skyldes handler eller endringer i aksjekursene.
| Verdipapirer | Aksjer (MM) |
Verdi (MM$) |
Portefølje % | ΔPortefølje % |
|---|---|---|---|---|
| 0,05 | 7,90 | 5,5971 | 5,5971 | |
| 0,04 | 5,45 | 3,8610 | 3,8610 | |
| 0,02 | 4,49 | 3,1814 | 3,1814 | |
| 0,02 | 4,42 | 3,1315 | 3,1315 | |
| 0,33 | 4,41 | 3,1256 | 3,0163 | |
| 0,05 | 4,06 | 2,8795 | 2,8795 | |
| 0,06 | 4,40 | 3,1205 | 2,8130 | |
| 0,06 | 3,92 | 2,7780 | 2,7780 | |
| 0,02 | 3,65 | 2,5876 | 2,5876 | |
| 0,35 | 4,89 | 3,4678 | 2,4801 |
De største reduksjonene dette kvartalet
Vi bruker endringen i porteføljeallokeringen fordi dette er det mest meningsfulle målet. Endringer kan skyldes handler eller endringer i aksjekurser.
| Verdipapirer | Aksjer (MM) |
Verdi (MM$) |
Portefølje % | ΔPortefølje % |
|---|---|---|---|---|
| 0,00 | 0,00 | −11,8339 | ||
| 0,01 | 0,26 | 0,1832 | −2,3845 | |
| 0,01 | 1,55 | 1,0989 | −1,7861 | |
| 0,03 | 2,50 | 1,7717 | −1,4880 | |
| 0,04 | 2,80 | 1,9829 | −1,4481 | |
| 0,01 | 1,38 | 0,9762 | −1,3913 | |
| 0,03 | 2,84 | 2,0099 | −0,9909 | |
| 0,00 | 0,30 | 0,2098 | −0,9387 | |
| 0,00 | 0,30 | 0,2149 | −0,8853 | |
| 0,00 | 0,23 | 0,1648 | −0,8427 |
13F- og Fondsarkiveringer
Dette skjemaet ble sendt inn den 2025-07-29 for rapporteringsperioden 2025-06-30. Klikk på lenkeikonet for å se hele transaksjonshistorikken.
Oppgradere for å låse opp premiedata og eksportere til Excel![]() .
.
| Verdipapirer | Type | Gjennomsnittlig aksjekurs | Aksjer (MM) |
ΔAksjer (%) |
ΔAksjer (%) |
Verdi ($MM) |
Portefølje (%) |
ΔPortefølje (%) |
|
|---|---|---|---|---|---|---|---|---|---|
| NVDA / NVIDIA Corporation | Put | 0,05 | 7,90 | 5,5971 | 5,5971 | ||||
| VRT / Vertiv Holdings Co | 0,04 | 5,45 | 3,8610 | 3,8610 | |||||
| FLEX / Flex Ltd. | 0,10 | −27,61 | 5,07 | 9,25 | 3,5903 | 0,8072 | |||
| CMPO / CompoSecure, Inc. | 0,35 | 129,37 | 4,89 | 197,33 | 3,4678 | 2,4801 | |||
| LPLA / LPL Financial Holdings Inc. | 0,01 | 17,04 | 4,76 | 34,17 | 3,3723 | 1,2435 | |||
| CRM / Salesforce, Inc. | 0,02 | 47,76 | 4,72 | 50,16 | 3,3474 | 1,4594 | |||
| ICE / Intercontinental Exchange, Inc. | 0,03 | −12,86 | 4,59 | −7,32 | 3,2549 | 0,2808 | |||
| BWIN / The Baldwin Insurance Group, Inc. | 0,11 | 138,87 | 4,55 | 128,84 | 3,2222 | 2,0297 | |||
| META / Meta Platforms, Inc. | 0,01 | −32,14 | 4,53 | −13,09 | 3,2126 | 0,0821 | |||
| FFIV / F5, Inc. | 0,02 | −21,61 | 4,53 | −13,36 | 3,2123 | 0,0729 | |||
| LHX / L3Harris Technologies, Inc. | 0,02 | 4,49 | 3,1814 | 3,1814 | |||||
| PWR / Quanta Services, Inc. | 0,01 | −52,54 | 4,49 | −29,41 | 3,1800 | −0,6351 | |||
| GLW / Corning Incorporated | 0,09 | 90,65 | 4,49 | 118,98 | 3,1797 | 1,9502 | |||
| TTWO / Take-Two Interactive Software, Inc. | 0,02 | 4,42 | 3,1315 | 3,1315 | |||||
| AVTR / Avantor, Inc. | 0,33 | 2 815,30 | 4,41 | 2 323,63 | 3,1256 | 3,0163 | |||
| XYZ / Block, Inc. | 0,06 | 587,38 | 4,40 | 760,16 | 3,1205 | 2,8130 | |||
| PSN / Parsons Corporation | 0,06 | −41,31 | 4,35 | −28,86 | 3,0850 | −0,5874 | |||
| MMM / 3M Company | 0,03 | 20,19 | 4,14 | 24,60 | 2,9326 | 0,9393 | |||
| COHR / Coherent Corp. | 0,05 | 4,06 | 2,8795 | 2,8795 | |||||
| HOLX / Hologic, Inc. | 0,06 | 3,92 | 2,7780 | 2,7780 | |||||
| RVTY / Revvity, Inc. | 0,04 | 74,21 | 3,87 | 59,25 | 2,7386 | 1,2824 | |||
| WDAY / Workday, Inc. | 0,02 | 3,65 | 2,5876 | 2,5876 | |||||
| GWRE / Guidewire Software, Inc. | 0,02 | −19,59 | 3,57 | 1,05 | 2,5271 | 0,4093 | |||
| DKNG / DraftKings Inc. | 0,08 | 87,30 | 3,54 | 141,91 | 2,5115 | 1,6323 | |||
| MSFT / Microsoft Corporation | 0,01 | −10,12 | 3,46 | 19,08 | 2,4550 | 0,7094 | |||
| AMZN / Amazon.com, Inc. | 0,02 | −38,40 | 3,38 | −28,98 | 2,3934 | −0,4603 | |||
| J / Jacobs Solutions Inc. | 0,02 | −9,17 | 3,17 | −1,24 | 2,2488 | 0,3205 | |||
| NDAQ / Nasdaq, Inc. | 0,03 | −51,88 | 2,84 | −43,29 | 2,0099 | −0,9909 | |||
| WRB / W. R. Berkley Corporation | 0,04 | −52,60 | 2,80 | −51,07 | 1,9829 | −1,4481 | |||
| RYAN / Ryan Specialty Holdings, Inc. | 0,04 | 2,63 | 1,8602 | 1,8602 | |||||
| AVGO / Broadcom Inc. | 0,01 | −60,57 | 2,62 | −35,07 | 1,8564 | −0,5652 | |||
| EPAM / EPAM Systems, Inc. | 0,01 | 2,54 | 1,7978 | 1,7978 | |||||
| GEHC / GE HealthCare Technologies Inc. | 0,03 | −49,85 | 2,50 | −53,98 | 1,7717 | −1,4880 | |||
| DHR / Danaher Corporation | 0,01 | 2,37 | 1,6796 | 1,6796 | |||||
| SBAC / SBA Communications Corporation | 0,01 | −69,78 | 1,55 | −67,76 | 1,0989 | −1,7861 | |||
| GOOGL / Alphabet Inc. | 0,01 | −69,36 | 1,38 | −65,10 | 0,9762 | −1,3913 | |||
| CLH / Clean Harbors, Inc. | 0,00 | −85,90 | 0,30 | −83,47 | 0,2149 | −0,8853 | |||
| BRO / Brown & Brown, Inc. | 0,00 | −82,64 | 0,30 | −84,54 | 0,2098 | −0,9387 | |||
| CNP / CenterPoint Energy, Inc. | 0,01 | −94,04 | 0,26 | −93,97 | 0,1832 | −2,3845 | |||
| CP / Canadian Pacific Kansas City Limited | 0,00 | −87,73 | 0,23 | −86,18 | 0,1648 | −0,8427 | |||
| HYG / iShares Trust - iShares iBoxx $ High Yield Corporate Bond ETF | Put | 0,00 | −100,00 | 0,00 | −100,00 | −11,8339 | |||
| FI / Fiserv, Inc. | 0,00 | −100,00 | 0,00 | 0,0000 | |||||
| BKFOF / Brookfield Corporation - Preferred Stock | 0,00 | −100,00 | 0,00 | 0,0000 | |||||
| GE / General Electric Company | 0,00 | −100,00 | 0,00 | 0,0000 | |||||
| NXT / Nextracker Inc. | 0,00 | −100,00 | 0,00 | 0,0000 | |||||
| AJG / Arthur J. Gallagher & Co. | 0,00 | −100,00 | 0,00 | 0,0000 | |||||
| TMO / Thermo Fisher Scientific Inc. | 0,00 | −100,00 | 0,00 | 0,0000 | |||||
| PTC / PTC Inc. | 0,00 | −100,00 | 0,00 | 0,0000 | |||||
| VLTO / Veralto Corporation | 0,00 | −100,00 | 0,00 | 0,0000 | |||||
| UBER / Uber Technologies, Inc. | 0,00 | −100,00 | 0,00 | 0,0000 | |||||
| ABNB / Airbnb, Inc. | 0,00 | −100,00 | 0,00 | 0,0000 | |||||
| SSNC / SS&C Technologies Holdings, Inc. | 0,00 | −100,00 | 0,00 | 0,0000 | |||||
| AEE / Ameren Corporation | 0,00 | −100,00 | 0,00 | 0,0000 | |||||
| BX / Blackstone Inc. | Put | 0,00 | −100,00 | 0,00 | 0,0000 | ||||
| V / Visa Inc. | 0,00 | −100,00 | 0,00 | 0,0000 |