Grunnleggende statistikk
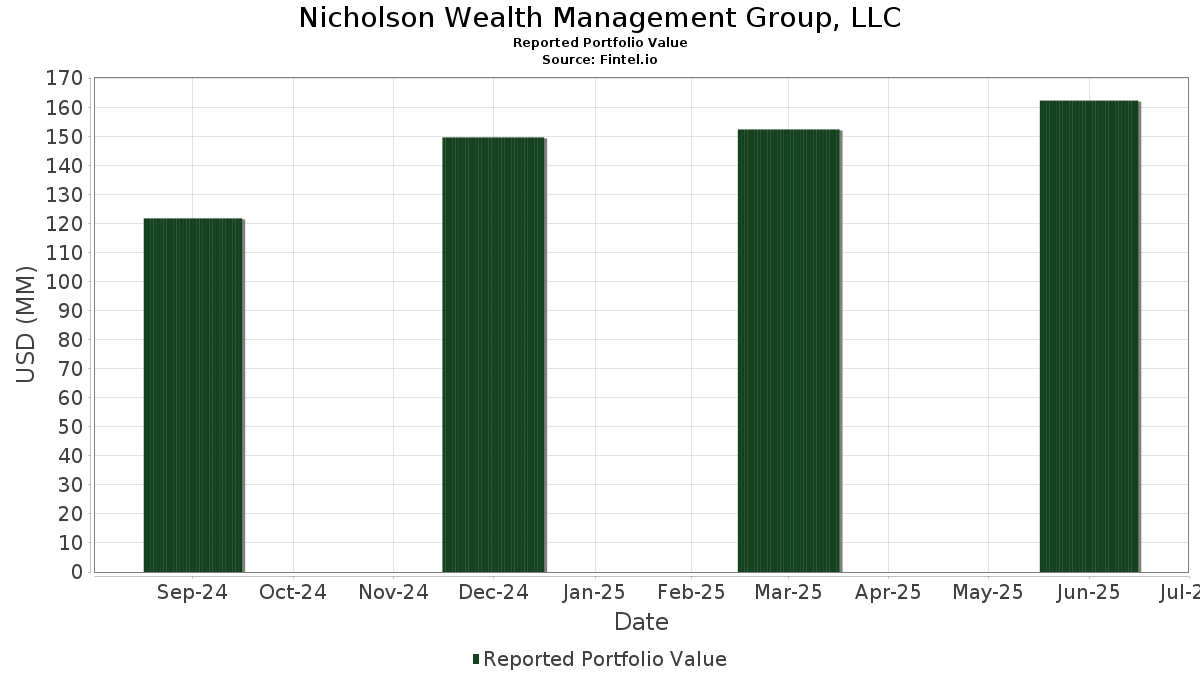
| Porteføljeverdi | $ 162 301 663 |
| Nåværende posisjoner | 107 |
Siste beholdninger, prestasjoner, forvaltet kapital (fra 13F, 13D)
Nicholson Wealth Management Group, LLC har oppgitt 107 totale beholdninger i sine siste SEC-arkiveringer. Siste porteføljeverdi er beregnet til 162 301 663 USD. Faktisk forvaltet kapital (AUM) er denne verdien pluss kontanter (som ikke er oppgitt). Nicholson Wealth Management Group, LLCs største beholdninger er Vanguard Index Funds - Vanguard S&P 500 ETF (US:VOO) , Perspective Therapeutics, Inc. (US:CATX) , Microsoft Corporation (US:MSFT) , Vanguard Index Funds - Vanguard Total Stock Market ETF (US:VTI) , and United Bankshares, Inc. (US:UBSI) . Nicholson Wealth Management Group, LLCs nye posisjoner inkluderer Bank of America Corporation (US:BAC) , iShares Silver Trust (US:SLV) , Capital Group Core Balanced ETF (US:CGBL) , iShares Trust - iShares Core S&P 500 ETF (US:IVV) , and Vanguard Tax-Managed Funds - Vanguard FTSE Developed Markets ETF (US:VEA) .
De største økningene dette kvartalet
Vi bruker endringen i porteføljeallokeringen fordi dette er det mest meningsfulle målet. Endringer kan skyldes handler eller endringer i aksjekursene.
| Verdipapirer | Aksjer (MM) |
Verdi (MM$) |
Portefølje % | ΔPortefølje % |
|---|---|---|---|---|
| 1,61 | 5,55 | 3,4215 | 1,1718 | |
| 0,01 | 3,72 | 2,2949 | 0,6570 | |
| 0,01 | 2,30 | 1,4163 | 0,5183 | |
| 0,01 | 1,03 | 0,6325 | 0,3931 | |
| 0,01 | 0,69 | 0,4242 | 0,2453 | |
| 0,00 | 0,63 | 0,3899 | 0,2366 | |
| 0,00 | 0,59 | 0,3646 | 0,2307 | |
| 0,00 | 1,24 | 0,7656 | 0,1959 | |
| 0,00 | 0,54 | 0,3320 | 0,1852 | |
| 0,01 | 1,70 | 1,0462 | 0,1641 |
De største reduksjonene dette kvartalet
Vi bruker endringen i porteføljeallokeringen fordi dette er det mest meningsfulle målet. Endringer kan skyldes handler eller endringer i aksjekurser.
| Verdipapirer | Aksjer (MM) |
Verdi (MM$) |
Portefølje % | ΔPortefølje % |
|---|---|---|---|---|
| 0,02 | 13,33 | 8,2110 | −0,5792 | |
| 0,00 | 0,96 | 0,5903 | −0,3869 | |
| 0,02 | 2,00 | 1,2299 | −0,2652 | |
| 0,01 | 1,11 | 0,6827 | −0,2648 | |
| 0,01 | 2,35 | 1,4450 | −0,1902 | |
| 0,01 | 1,65 | 1,0181 | −0,1848 | |
| 0,01 | 1,40 | 0,8643 | −0,1782 | |
| 0,01 | 1,64 | 1,0087 | −0,1781 | |
| 0,01 | 1,75 | 1,0812 | −0,1651 | |
| 0,01 | 2,19 | 1,3508 | −0,1567 |
13F- og Fondsarkiveringer
Dette skjemaet ble sendt inn den 2025-07-29 for rapporteringsperioden 2025-06-30. Klikk på lenkeikonet for å se hele transaksjonshistorikken.
Oppgradere for å låse opp premiedata og eksportere til Excel![]() .
.
| Verdipapirer | Type | Gjennomsnittlig aksjekurs | Aksjer (MM) |
ΔAksjer (%) |
ΔAksjer (%) |
Verdi ($MM) |
Portefølje (%) |
ΔPortefølje (%) |
|
|---|---|---|---|---|---|---|---|---|---|
| VOO / Vanguard Index Funds - Vanguard S&P 500 ETF | 0,02 | −9,98 | 13,33 | −0,50 | 8,2110 | −0,5792 | |||
| CATX / Perspective Therapeutics, Inc. | 1,61 | 0,31 | 5,55 | 62,04 | 3,4215 | 1,1718 | |||
| MSFT / Microsoft Corporation | 0,01 | 12,64 | 3,72 | 49,26 | 2,2949 | 0,6570 | |||
| VTI / Vanguard Index Funds - Vanguard Total Stock Market ETF | 0,01 | 0,60 | 3,34 | 11,26 | 2,0588 | 0,0876 | |||
| UBSI / United Bankshares, Inc. | 0,08 | 0,00 | 2,78 | 5,07 | 1,7114 | −0,0235 | |||
| COR / Cencora, Inc. | 0,01 | −2,02 | 2,36 | 5,65 | 1,4525 | −0,0120 | |||
| PG / The Procter & Gamble Company | 0,01 | 0,68 | 2,35 | −5,86 | 1,4450 | −0,1902 | |||
| AVGO / Broadcom Inc. | 0,01 | 2,04 | 2,30 | 67,98 | 1,4163 | 0,5183 | |||
| AAPL / Apple Inc. | 0,01 | 3,34 | 2,19 | −4,53 | 1,3508 | −0,1567 | |||
| V / Visa Inc. | 0,01 | 1,02 | 2,04 | 2,31 | 1,2574 | −0,0513 | |||
| PEP / PepsiCo, Inc. | 0,02 | −0,49 | 2,00 | −12,38 | 1,2299 | −0,2652 | |||
| WMT / Walmart Inc. | 0,02 | 2,48 | 1,96 | 14,15 | 1,2080 | 0,0807 | |||
| COST / Costco Wholesale Corporation | 0,00 | 4,88 | 1,96 | 9,82 | 1,2058 | 0,0358 | |||
| SO / The Southern Company | 0,02 | 0,00 | 1,94 | −0,15 | 1,1951 | −0,0796 | |||
| GD / General Dynamics Corporation | 0,01 | 0,50 | 1,92 | 7,51 | 1,1828 | 0,0112 | |||
| UNP / Union Pacific Corporation | 0,01 | 3,13 | 1,91 | 0,47 | 1,1776 | −0,0713 | |||
| LIN / Linde plc | 0,00 | 1,94 | 1,90 | 2,71 | 1,1693 | −0,0433 | |||
| CSCO / Cisco Systems, Inc. | 0,03 | 2,50 | 1,90 | 15,26 | 1,1685 | 0,0884 | |||
| MCD / McDonald's Corporation | 0,01 | 1,94 | 1,89 | −4,69 | 1,1663 | −0,1367 | |||
| HD / The Home Depot, Inc. | 0,01 | 2,76 | 1,88 | 2,79 | 1,1589 | −0,0418 | |||
| ABT / Abbott Laboratories | 0,01 | −0,74 | 1,84 | 1,77 | 1,1327 | −0,0528 | |||
| ADI / Analog Devices, Inc. | 0,01 | 3,05 | 1,82 | 21,63 | 1,1232 | 0,1395 | |||
| SYK / Stryker Corporation | 0,00 | 0,50 | 1,82 | 6,80 | 1,1230 | 0,0031 | |||
| TXN / Texas Instruments Incorporated | 0,01 | 2,98 | 1,82 | 18,95 | 1,1219 | 0,1175 | |||
| LHX / L3Harris Technologies, Inc. | 0,01 | 0,78 | 1,82 | 20,80 | 1,1207 | 0,1323 | |||
| WEC / WEC Energy Group, Inc. | 0,02 | 0,35 | 1,81 | −4,07 | 1,1174 | −0,1231 | |||
| CB / Chubb Limited | 0,01 | 3,37 | 1,81 | −0,82 | 1,1171 | −0,0828 | |||
| ATO / Atmos Energy Corporation | 0,01 | 0,18 | 1,81 | −0,11 | 1,1150 | −0,0742 | |||
| HON / Honeywell International Inc. | 0,01 | 3,79 | 1,79 | 14,14 | 1,1047 | 0,0738 | |||
| ADP / Automatic Data Processing, Inc. | 0,01 | 1,95 | 1,78 | 2,90 | 1,0937 | −0,0384 | |||
| ECL / Ecolab Inc. | 0,01 | 0,28 | 1,77 | 6,58 | 1,0885 | 0,0006 | |||
| JNJ / Johnson & Johnson | 0,01 | 0,32 | 1,75 | −7,64 | 1,0812 | −0,1651 | |||
| ICE / Intercontinental Exchange, Inc. | 0,01 | 0,15 | 1,73 | 6,54 | 1,0642 | −0,0000 | |||
| LMT / Lockheed Martin Corporation | 0,00 | 2,34 | 1,72 | 6,11 | 1,0601 | −0,0041 | |||
| XYL / Xylem Inc. | 0,01 | 0,44 | 1,70 | 8,75 | 1,0497 | 0,0217 | |||
| SPGI / S&P Global Inc. | 0,00 | 2,41 | 1,70 | 6,25 | 1,0477 | −0,0023 | |||
| EMR / Emerson Electric Co. | 0,01 | 3,88 | 1,70 | 26,26 | 1,0462 | 0,1641 | |||
| GWW / W.W. Grainger, Inc. | 0,00 | 2,38 | 1,70 | 7,81 | 1,0460 | 0,0126 | |||
| O / Realty Income Corporation | 0,03 | 0,80 | 1,66 | 0,12 | 1,0206 | −0,0654 | |||
| MDT / Medtronic plc | 0,02 | 0,50 | 1,65 | −2,54 | 1,0183 | −0,0943 | |||
| AMGN / Amgen Inc. | 0,01 | 0,59 | 1,65 | −9,83 | 1,0181 | −0,1848 | |||
| BRO / Brown & Brown, Inc. | 0,01 | 1,58 | 1,64 | −9,46 | 1,0087 | −0,1781 | |||
| PAYX / Paychex, Inc. | 0,01 | 1,24 | 1,64 | −4,55 | 1,0085 | −0,1169 | |||
| PH / Parker-Hannifin Corporation | 0,00 | 5,22 | 1,63 | 20,89 | 1,0057 | 0,1197 | |||
| CMS / CMS Energy Corporation | 0,02 | 0,68 | 1,63 | −7,13 | 1,0029 | −0,1475 | |||
| BR / Broadridge Financial Solutions, Inc. | 0,01 | 1,80 | 1,62 | 2,01 | 0,9998 | −0,0439 | |||
| SHW / The Sherwin-Williams Company | 0,00 | 8,39 | 1,61 | 6,61 | 0,9945 | 0,0006 | |||
| MDLZ / Mondelez International, Inc. | 0,02 | 1,13 | 1,61 | 0,50 | 0,9906 | −0,0591 | |||
| AWK / American Water Works Company, Inc. | 0,01 | −0,02 | 1,59 | −5,69 | 0,9810 | −0,1273 | |||
| JKHY / Jack Henry & Associates, Inc. | 0,01 | 1,09 | 1,57 | −0,25 | 0,9667 | −0,0656 | |||
| PSX / Phillips 66 | 0,01 | 9,85 | 1,56 | 6,12 | 0,9620 | −0,0035 | |||
| AFL / Aflac Incorporated | 0,01 | 2,80 | 1,55 | −2,52 | 0,9548 | −0,0883 | |||
| TSCO / Tractor Supply Company | 0,03 | 2,36 | 1,54 | −1,97 | 0,9516 | −0,0824 | |||
| FDS / FactSet Research Systems Inc. | 0,00 | 2,17 | 1,54 | 0,52 | 0,9491 | −0,0567 | |||
| NEE / NextEra Energy, Inc. | 0,02 | 2,21 | 1,54 | 0,06 | 0,9491 | −0,0609 | |||
| CHCO / City Holding Company | 0,01 | 0,00 | 1,51 | 4,21 | 0,9312 | −0,0206 | |||
| ITW / Illinois Tool Works Inc. | 0,01 | 3,42 | 1,50 | 3,16 | 0,9261 | −0,0307 | |||
| APD / Air Products and Chemicals, Inc. | 0,01 | 0,73 | 1,49 | −3,63 | 0,9162 | −0,0969 | |||
| SBUX / Starbucks Corporation | 0,02 | 1,15 | 1,48 | −5,55 | 0,9131 | −0,1162 | |||
| PLD / Prologis, Inc. | 0,01 | 9,10 | 1,47 | 2,57 | 0,9084 | −0,0348 | |||
| CL / Colgate-Palmolive Company | 0,02 | 0,17 | 1,47 | −2,79 | 0,9033 | −0,0869 | |||
| MKC / McCormick & Company, Incorporated | 0,02 | 0,96 | 1,45 | −6,99 | 0,8935 | −0,1299 | |||
| NJR / New Jersey Resources Corporation | 0,03 | 1,54 | 1,44 | −7,27 | 0,8889 | −0,1318 | |||
| LOW / Lowe's Companies, Inc. | 0,01 | 3,00 | 1,44 | −2,04 | 0,8872 | −0,0773 | |||
| CMCSA / Comcast Corporation | 0,04 | −0,32 | 1,44 | −3,56 | 0,8842 | −0,0927 | |||
| CTAS / Cintas Corporation | 0,01 | 10,97 | 1,43 | 20,35 | 0,8820 | 0,1013 | |||
| PPG / PPG Industries, Inc. | 0,01 | −1,22 | 1,42 | 2,75 | 0,8753 | −0,0320 | |||
| CHD / Church & Dwight Co., Inc. | 0,01 | 1,16 | 1,40 | −11,71 | 0,8643 | −0,1782 | |||
| ZTS / Zoetis Inc. | 0,01 | 7,72 | 1,39 | 2,05 | 0,8583 | −0,0378 | |||
| ACN / Accenture plc | 0,00 | 6,44 | 1,36 | 1,95 | 0,8398 | −0,0376 | |||
| TROW / T. Rowe Price Group, Inc. | 0,01 | 3,06 | 1,36 | 8,22 | 0,8360 | 0,0134 | |||
| CBSH / Commerce Bancshares, Inc. | 0,02 | 1,03 | 1,30 | 0,93 | 0,8016 | −0,0443 | |||
| LLY / Eli Lilly and Company | 0,00 | 51,67 | 1,24 | 43,09 | 0,7656 | 0,1959 | |||
| GLD / SPDR Gold Trust | 0,00 | 5,01 | 1,14 | 11,07 | 0,7053 | 0,0290 | |||
| BDX / Becton, Dickinson and Company | 0,01 | 2,06 | 1,11 | −23,22 | 0,6827 | −0,2648 | |||
| APH / Amphenol Corporation | 0,01 | 86,94 | 1,03 | 181,87 | 0,6325 | 0,3931 | |||
| UNH / UnitedHealth Group Incorporated | 0,00 | 8,02 | 0,96 | −35,66 | 0,5903 | −0,3869 | |||
| BFB / Brown-Forman Corp. - Class B | 0,03 | 9,66 | 0,93 | −13,05 | 0,5709 | −0,1285 | |||
| XOM / Exxon Mobil Corporation | 0,01 | −2,64 | 0,81 | −11,83 | 0,4965 | −0,1028 | |||
| OCTM / First Trust Exchange-Traded Fund VIII - FT Vest U.S. Equity Max Buffer ETF - October | 0,02 | −3,56 | 0,73 | −0,14 | 0,4517 | −0,0302 | |||
| JPM / JPMorgan Chase & Co. | 0,00 | 1,86 | 0,73 | 20,43 | 0,4505 | 0,0519 | |||
| WRB / W. R. Berkley Corporation | 0,01 | 144,71 | 0,69 | 152,94 | 0,4242 | 0,2453 | |||
| SSB / SouthState Corporation | 0,01 | 1,77 | 0,66 | 0,91 | 0,4083 | −0,0227 | |||
| KO / The Coca-Cola Company | 0,01 | 4,74 | 0,66 | 3,45 | 0,4072 | −0,0120 | |||
| MA / Mastercard Incorporated | 0,00 | 164,32 | 0,63 | 171,24 | 0,3899 | 0,2366 | |||
| NFLX / Netflix, Inc. | 0,00 | 4,89 | 0,63 | 50,84 | 0,3894 | 0,1140 | |||
| RSP / Invesco Exchange-Traded Fund Trust - Invesco S&P 500 Equal Weight ETF | 0,00 | −0,87 | 0,60 | 4,01 | 0,3683 | −0,0089 | |||
| ROP / Roper Technologies, Inc. | 0,00 | 201,73 | 0,59 | 191,13 | 0,3646 | 0,2307 | |||
| NVDA / NVIDIA Corporation | 0,00 | 65,18 | 0,54 | 141,26 | 0,3320 | 0,1852 | |||
| QQQ / Invesco QQQ Trust, Series 1 | 0,00 | 10,92 | 0,52 | 30,58 | 0,3212 | 0,0590 | |||
| IBM / International Business Machines Corporation | 0,00 | −1,29 | 0,52 | 16,97 | 0,3191 | 0,0286 | |||
| TSLA / Tesla, Inc. | 0,00 | 8,39 | 0,50 | 32,98 | 0,3061 | 0,0607 | |||
| CLX / The Clorox Company | 0,00 | −0,03 | 0,42 | −18,50 | 0,2609 | −0,0800 | |||
| CVX / Chevron Corporation | 0,00 | 4,03 | 0,41 | −10,97 | 0,2553 | −0,0501 | |||
| BUFR / First Trust Exchange-Traded Fund VIII - FT Vest Laddered Buffer ETF | 0,01 | 0,00 | 0,39 | 7,10 | 0,2419 | 0,0013 | |||
| AMZN / Amazon.com, Inc. | 0,00 | 28,94 | 0,38 | 49,01 | 0,2325 | 0,0659 | |||
| BRK.B / Berkshire Hathaway Inc. | 0,00 | 4,55 | 0,37 | −4,66 | 0,2269 | −0,0265 | |||
| SEPM / First Trust Exchange-Traded Fund VIII - FT Vest U.S. Equity Max Buffer ETF - September | 0,01 | 0,00 | 0,32 | 3,62 | 0,1944 | −0,0056 | |||
| SON / Sonoco Products Company | 0,01 | 0,00 | 0,28 | −7,57 | 0,1732 | −0,0269 | |||
| DUK / Duke Energy Corporation | 0,00 | 7,81 | 0,27 | 4,25 | 0,1666 | −0,0035 | |||
| NUE / Nucor Corporation | 0,00 | 0,00 | 0,25 | 7,76 | 0,1541 | 0,0016 | |||
| BAC / Bank of America Corporation | 0,00 | 0,23 | 0,1409 | 0,1409 | |||||
| SLV / iShares Silver Trust | 0,01 | 0,23 | 0,1387 | 0,1387 | |||||
| CGBL / Capital Group Core Balanced ETF | 0,01 | 0,21 | 0,1317 | 0,1317 | |||||
| VIG / Vanguard Specialized Funds - Vanguard Dividend Appreciation ETF | 0,00 | 0,21 | 0,1294 | 0,1294 | |||||
| IVV / iShares Trust - iShares Core S&P 500 ETF | 0,00 | 0,21 | 0,1282 | 0,1282 | |||||
| VEA / Vanguard Tax-Managed Funds - Vanguard FTSE Developed Markets ETF | 0,00 | 0,20 | 0,1233 | 0,1233 | |||||
| DVY / iShares Trust - iShares Select Dividend ETF | 0,00 | −100,00 | 0,00 | 0,0000 |