Grunnleggende statistikk
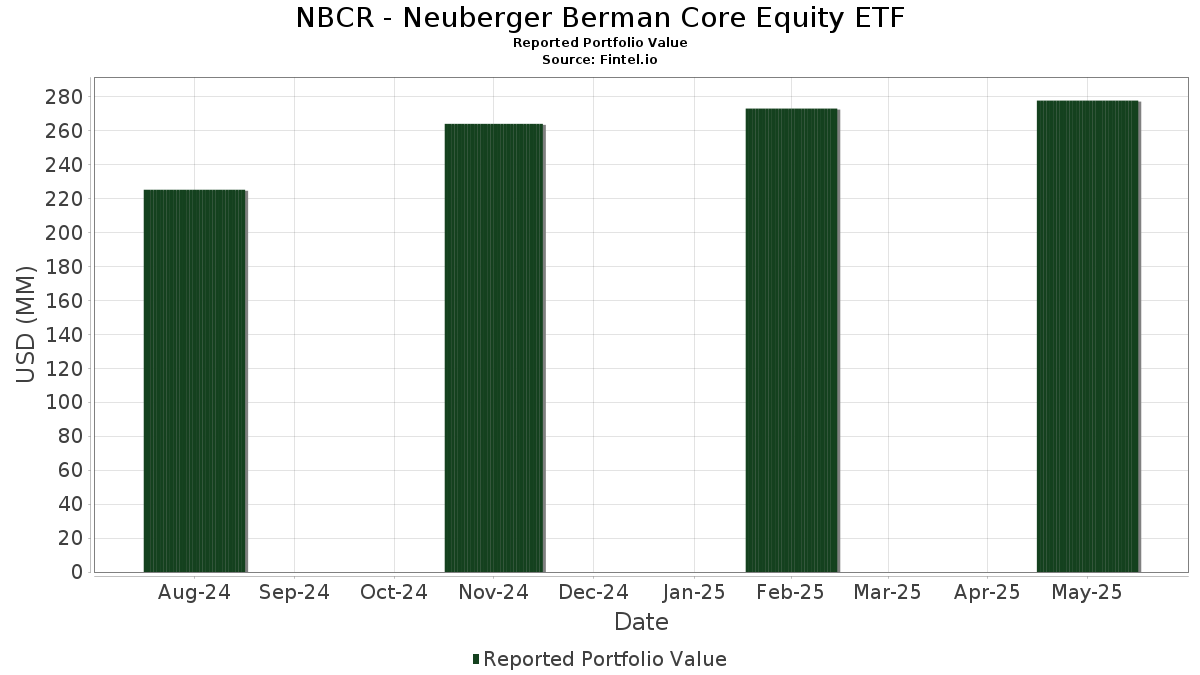
| Porteføljeverdi | $ 277 641 113 |
| Nåværende posisjoner | 195 |
Siste beholdninger, prestasjoner, forvaltet kapital (fra 13F, 13D)
NBCR - Neuberger Berman Core Equity ETF har oppgitt 195 totale beholdninger i sine siste SEC-arkiveringer. Siste porteføljeverdi er beregnet til 277 641 113 USD. Faktisk forvaltet kapital (AUM) er denne verdien pluss kontanter (som ikke er oppgitt). NBCR - Neuberger Berman Core Equity ETFs største beholdninger er Microsoft Corporation (US:MSFT) , NVIDIA Corporation (US:NVDA) , Apple Inc. (US:AAPL) , Amazon.com, Inc. (US:AMZN) , and Alphabet Inc. (US:GOOGL) . NBCR - Neuberger Berman Core Equity ETFs nye posisjoner inkluderer Meta Platforms, Inc. (US:META) , Tesla, Inc. (US:TSLA) , UnitedHealth Group Incorporated (US:UNH) , Danaher Corporation (US:DHR) , and CACI International Inc (US:CACI) .
De største økningene dette kvartalet
Vi bruker endringen i porteføljeallokeringen fordi dette er det mest meningsfulle målet. Endringer kan skyldes handler eller endringer i aksjekursene.
| Verdipapirer | Aksjer (MM) |
Verdi (MM$) |
Portefølje % | ΔPortefølje % |
|---|---|---|---|---|
| 0,01 | 7,27 | 2,6103 | 2,6103 | |
| 0,01 | 4,91 | 1,7625 | 1,7625 | |
| 0,04 | 18,08 | 6,4943 | 0,8066 | |
| 0,01 | 1,73 | 0,6220 | 0,6220 | |
| 0,03 | 6,18 | 2,2209 | 0,5699 | |
| 0,00 | 3,96 | 1,4229 | 0,5322 | |
| 0,12 | 16,52 | 5,9333 | 0,4957 | |
| 0,00 | 0,91 | 0,3260 | 0,3260 | |
| 0,00 | 2,33 | 0,8367 | 0,2781 | |
| 0,00 | 0,64 | 0,2286 | 0,2286 |
De største reduksjonene dette kvartalet
Vi bruker endringen i porteføljeallokeringen fordi dette er det mest meningsfulle målet. Endringer kan skyldes handler eller endringer i aksjekurser.
| Verdipapirer | Aksjer (MM) |
Verdi (MM$) |
Portefølje % | ΔPortefølje % |
|---|---|---|---|---|
| 0,08 | 15,99 | 5,7454 | −1,1786 | |
| 0,01 | 1,00 | 0,3598 | −0,5408 | |
| 0,01 | 1,23 | 0,4414 | −0,5008 | |
| 0,04 | 7,67 | 2,7569 | −0,4861 | |
| 0,01 | 0,65 | 0,2330 | −0,3679 | |
| 0,01 | 1,12 | 0,4031 | −0,3213 | |
| 0,05 | 10,27 | 3,6878 | −0,3091 | |
| 0,01 | 0,80 | 0,2865 | −0,3072 | |
| 0,00 | 3,42 | 1,2280 | −0,3069 | |
| 0,03 | 4,40 | 1,5804 | −0,2883 |
13F- og Fondsarkiveringer
Dette skjemaet ble sendt inn den 2025-07-28 for rapporteringsperioden 2025-05-31. Klikk på lenkeikonet for å se hele transaksjonshistorikken.
Oppgradere for å låse opp premiedata og eksportere til Excel![]() .
.
| Verdipapirer | Type | Gjennomsnittlig aksjekurs | Aksjer (MM) |
ΔAksjer (%) |
ΔAksjer (%) |
Verdi ($MM) |
Portefølje (%) |
ΔPortefølje (%) |
|
|---|---|---|---|---|---|---|---|---|---|
| MSFT / Microsoft Corporation | 0,04 | 0,28 | 18,08 | 16,29 | 6,4943 | 0,8066 | |||
| NVDA / NVIDIA Corporation | 0,12 | 2,73 | 16,52 | 11,12 | 5,9333 | 0,4957 | |||
| AAPL / Apple Inc. | 0,08 | 1,75 | 15,99 | −15,49 | 5,7454 | −1,1786 | |||
| AMZN / Amazon.com, Inc. | 0,05 | −2,70 | 10,27 | −6,03 | 3,6878 | −0,3091 | |||
| GOOGL / Alphabet Inc. | 0,04 | −14,16 | 7,67 | −13,42 | 2,7569 | −0,4861 | |||
| META / Meta Platforms, Inc. | 0,01 | 7,27 | 2,6103 | 2,6103 | |||||
| AVGO / Broadcom Inc. | 0,03 | 12,86 | 6,18 | 37,01 | 2,2209 | 0,5699 | |||
| TSLA / Tesla, Inc. | 0,01 | 4,91 | 1,7625 | 1,7625 | |||||
| JPM / JPMorgan Chase & Co. | 0,02 | 14,97 | 4,69 | 14,69 | 1,6852 | 0,1888 | |||
| GOOG / Alphabet Inc. | 0,03 | −14,18 | 4,40 | −13,86 | 1,5804 | −0,2883 | |||
| V / Visa Inc. | 0,01 | 12,47 | 4,06 | 13,25 | 1,4582 | 0,1467 | |||
| NFLX / Netflix, Inc. | 0,00 | 32,14 | 3,96 | 62,70 | 1,4229 | 0,5322 | |||
| MA / Mastercard Incorporated | 0,01 | 4,25 | 3,72 | 5,95 | 1,3361 | 0,0516 | |||
| AON / Aon plc | 0,01 | 1,78 | 3,58 | −7,42 | 1,2858 | −0,1289 | |||
| COST / Costco Wholesale Corporation | 0,00 | 5,84 | 3,45 | 5,00 | 1,2384 | 0,0372 | |||
| LLY / Eli Lilly and Company | 0,00 | 1,69 | 3,42 | −18,52 | 1,2280 | −0,3069 | |||
| HD / The Home Depot, Inc. | 0,01 | 8,90 | 3,28 | 1,11 | 1,1783 | −0,0083 | |||
| WFC / Wells Fargo & Company | 0,04 | 13,26 | 3,25 | 8,13 | 1,1661 | 0,0679 | |||
| BAC / Bank of America Corporation | 0,06 | 17,27 | 2,73 | 12,26 | 0,9805 | 0,0910 | |||
| UNM / Unum Group | 0,03 | 1,75 | 2,72 | 1,04 | 0,9785 | −0,0078 | |||
| IWB / iShares Trust - iShares Russell 1000 ETF | 0,01 | 22,01 | 2,64 | 21,15 | 0,9469 | 0,1509 | |||
| KO / The Coca-Cola Company | 0,04 | −7,43 | 2,57 | −6,27 | 0,9235 | −0,0799 | |||
| XOM / Exxon Mobil Corporation | 0,02 | 1,76 | 2,48 | −6,48 | 0,8917 | −0,0795 | |||
| GE / General Electric Company | 0,01 | 1,74 | 2,42 | 20,89 | 0,8693 | 0,1369 | |||
| NOW / ServiceNow, Inc. | 0,00 | 15,44 | 2,42 | 25,53 | 0,8692 | 0,1640 | |||
| JNJ / Johnson & Johnson | 0,02 | 1,74 | 2,41 | −4,28 | 0,8669 | −0,0557 | |||
| PM / Philip Morris International Inc. | 0,01 | 12,04 | 2,39 | 30,30 | 0,8593 | 0,1877 | |||
| INTU / Intuit Inc. | 0,00 | 24,29 | 2,33 | 52,56 | 0,8367 | 0,2781 | |||
| AIG / American International Group, Inc. | 0,03 | 1,74 | 2,32 | 3,85 | 0,8331 | 0,0159 | |||
| PG / The Procter & Gamble Company | 0,01 | −1,80 | 2,32 | −4,02 | 0,8328 | −0,0510 | |||
| ABT / Abbott Laboratories | 0,02 | 1,75 | 2,29 | −1,51 | 0,8220 | −0,0281 | |||
| ORCL / Oracle Corporation | 0,01 | −4,53 | 2,28 | −4,85 | 0,8175 | −0,0574 | |||
| CRWD / CrowdStrike Holdings, Inc. | 0,00 | 14,99 | 2,19 | 39,05 | 0,7871 | 0,2108 | |||
| ICE / Intercontinental Exchange, Inc. | 0,01 | 6,15 | 2,17 | 10,17 | 0,7787 | 0,0589 | |||
| SPGI / S&P Global Inc. | 0,00 | 1,69 | 2,16 | −2,31 | 0,7766 | −0,0328 | |||
| LIN / Linde plc | 0,00 | 1,77 | 2,07 | 1,87 | 0,7440 | 0,0003 | |||
| DIS / The Walt Disney Company | 0,02 | 14,68 | 2,04 | 13,93 | 0,7317 | 0,0776 | |||
| TMUS / T-Mobile US, Inc. | 0,01 | −7,78 | 1,99 | −17,16 | 0,7164 | −0,1646 | |||
| CRM / Salesforce, Inc. | 0,01 | 1,72 | 1,98 | −9,36 | 0,7099 | −0,0878 | |||
| BSX / Boston Scientific Corporation | 0,02 | 1,74 | 1,85 | 3,17 | 0,6659 | 0,0086 | |||
| TXN / Texas Instruments Incorporated | 0,01 | 25,66 | 1,82 | 17,27 | 0,6539 | 0,0859 | |||
| MMM / 3M Company | 0,01 | 1,76 | 1,74 | −2,68 | 0,6267 | −0,0292 | |||
| UNH / UnitedHealth Group Incorporated | 0,01 | 1,73 | 0,6220 | 0,6220 | |||||
| MDT / Medtronic plc | 0,02 | 1,74 | 1,69 | −8,24 | 0,6084 | −0,0669 | |||
| ETN / Eaton Corporation plc | 0,01 | 1,77 | 1,68 | 11,07 | 0,6020 | 0,0501 | |||
| TJX / The TJX Companies, Inc. | 0,01 | −11,01 | 1,64 | −9,52 | 0,5909 | −0,0740 | |||
| CCL / Carnival Corporation & plc | 0,07 | 61,22 | 1,63 | 56,40 | 0,5841 | 0,2038 | |||
| HWM / Howmet Aerospace Inc. | 0,01 | 1,76 | 1,58 | 26,65 | 0,5669 | 0,1107 | |||
| RTX / RTX Corporation | 0,01 | 1,73 | 1,58 | 4,44 | 0,5662 | 0,0139 | |||
| BKNG / Booking Holdings Inc. | 0,00 | 2,53 | 1,57 | 12,81 | 0,5631 | 0,0547 | |||
| PH / Parker-Hannifin Corporation | 0,00 | 1,62 | 1,46 | 1,11 | 0,5227 | −0,0041 | |||
| CVX / Chevron Corporation | 0,01 | 1,76 | 1,33 | −12,33 | 0,4779 | −0,0771 | |||
| APH / Amphenol Corporation | 0,01 | 1,77 | 1,30 | 37,41 | 0,4688 | 0,1214 | |||
| ALL / The Allstate Corporation | 0,01 | 1,73 | 1,30 | 7,19 | 0,4660 | 0,0233 | |||
| MCD / McDonald's Corporation | 0,00 | −28,61 | 1,29 | −27,31 | 0,4639 | −0,1863 | |||
| ADI / Analog Devices, Inc. | 0,01 | 1,80 | 1,27 | −5,36 | 0,4569 | −0,0345 | |||
| UBER / Uber Technologies, Inc. | 0,01 | −56,91 | 1,23 | −52,31 | 0,4414 | −0,5008 | |||
| T / AT&T Inc. | 0,04 | −30,46 | 1,20 | −29,48 | 0,4298 | −0,1908 | |||
| TT / Trane Technologies plc | 0,00 | 1,81 | 1,19 | 23,82 | 0,4258 | 0,0757 | |||
| ORLY / O'Reilly Automotive, Inc. | 0,00 | 14,51 | 1,18 | 14,06 | 0,4225 | 0,0451 | |||
| MS / Morgan Stanley | 0,01 | 1,75 | 1,14 | −2,14 | 0,4109 | −0,0167 | |||
| CAT / Caterpillar Inc. | 0,00 | −30,83 | 1,13 | −29,99 | 0,4060 | −0,1847 | |||
| FI / Fiserv, Inc. | 0,01 | −17,95 | 1,12 | −43,36 | 0,4031 | −0,3213 | |||
| ODFL / Old Dominion Freight Line, Inc. | 0,01 | 31,71 | 1,10 | 19,63 | 0,3942 | 0,0583 | |||
| SNPS / Synopsys, Inc. | 0,00 | 1,89 | 1,05 | 3,35 | 0,3770 | 0,0056 | |||
| DE / Deere & Company | 0,00 | −32,04 | 1,05 | −28,50 | 0,3761 | −0,1592 | |||
| ACN / Accenture plc | 0,00 | −21,68 | 1,05 | −28,81 | 0,3757 | −0,1617 | |||
| ULTA / Ulta Beauty, Inc. | 0,00 | −11,23 | 1,04 | 14,22 | 0,3723 | 0,0404 | |||
| WYNN / Wynn Resorts, Limited | 0,01 | 78,92 | 1,02 | 81,56 | 0,3680 | 0,1614 | |||
| BA / The Boeing Company | 0,00 | 1,74 | 1,02 | 20,85 | 0,3666 | 0,0575 | |||
| MRK / Merck & Co., Inc. | 0,01 | 1,73 | 1,01 | −15,24 | 0,3637 | −0,0734 | |||
| QCOM / QUALCOMM Incorporated | 0,01 | −55,96 | 1,00 | −59,33 | 0,3598 | −0,5408 | |||
| TMO / Thermo Fisher Scientific Inc. | 0,00 | −15,62 | 0,99 | −35,71 | 0,3557 | −0,2080 | |||
| UL / Unilever PLC - Depositary Receipt (Common Stock) | 0,02 | 11,76 | 0,98 | 26,03 | 0,3515 | 0,0675 | |||
| DKNG / DraftKings Inc. | 0,03 | 47,96 | 0,97 | 21,05 | 0,3495 | 0,0554 | |||
| NVT / nVent Electric plc | 0,01 | 1,75 | 0,96 | 11,06 | 0,3464 | 0,0285 | |||
| ZBH / Zimmer Biomet Holdings, Inc. | 0,01 | 1,73 | 0,95 | −10,13 | 0,3411 | −0,0454 | |||
| DLTR / Dollar Tree, Inc. | 0,01 | 1,78 | 0,94 | 26,14 | 0,3381 | 0,0650 | |||
| NSRGY / Nestlé S.A. - Depositary Receipt (Common Stock) | 0,01 | 17,51 | 0,92 | 29,86 | 0,3312 | 0,0711 | |||
| VTR / Ventas, Inc. | 0,01 | 64,51 | 0,92 | 53,08 | 0,3305 | 0,1103 | |||
| IR / Ingersoll Rand Inc. | 0,01 | 1,78 | 0,92 | −1,93 | 0,3295 | −0,0129 | |||
| SHW / The Sherwin-Williams Company | 0,00 | 1,69 | 0,91 | 0,67 | 0,3261 | −0,0036 | |||
| DHR / Danaher Corporation | 0,00 | 0,91 | 0,3260 | 0,3260 | |||||
| BLK / BlackRock, Inc. | 0,00 | 1,56 | 0,89 | 1,71 | 0,3210 | −0,0002 | |||
| WCN / Waste Connections, Inc. | 0,00 | −10,39 | 0,88 | −6,91 | 0,3149 | −0,0297 | |||
| VRTX / Vertex Pharmaceuticals Incorporated | 0,00 | −16,16 | 0,88 | −22,75 | 0,3148 | −0,1002 | |||
| RSG / Republic Services, Inc. | 0,00 | 1,68 | 0,87 | 10,39 | 0,3132 | 0,0242 | |||
| BMY / Bristol-Myers Squibb Company | 0,02 | 1,76 | 0,86 | −17,68 | 0,3082 | −0,0727 | |||
| LRCX / Lam Research Corporation | 0,01 | 45,06 | 0,84 | 52,91 | 0,3022 | 0,1007 | |||
| NEE / NextEra Energy, Inc. | 0,01 | 1,75 | 0,83 | 2,46 | 0,2995 | 0,0017 | |||
| MCK / McKesson Corporation | 0,00 | 1,91 | 0,80 | 14,53 | 0,2890 | 0,0320 | |||
| KKR / KKR & Co. Inc. | 0,01 | −45,15 | 0,80 | −50,86 | 0,2865 | −0,3072 | |||
| CP / Canadian Pacific Kansas City Limited | 0,01 | −10,93 | 0,79 | −6,70 | 0,2854 | −0,0260 | |||
| GL / Globe Life Inc. | 0,01 | 1,75 | 0,79 | −2,70 | 0,2846 | −0,0132 | |||
| MCO / Moody's Corporation | 0,00 | −2,70 | 0,76 | −7,44 | 0,2729 | −0,0274 | |||
| CHKP / Check Point Software Technologies Ltd. | 0,00 | 1,75 | 0,75 | 5,82 | 0,2677 | 0,0098 | |||
| COP / ConocoPhillips | 0,01 | 1,71 | 0,74 | −12,47 | 0,2675 | −0,0436 | |||
| COO / The Cooper Companies, Inc. | 0,01 | 1,77 | 0,74 | −23,16 | 0,2672 | −0,0868 | |||
| CVS / CVS Health Corporation | 0,01 | 1,73 | 0,74 | −0,81 | 0,2651 | −0,0073 | |||
| TRU / TransUnion | 0,01 | 1,75 | 0,73 | −5,80 | 0,2629 | −0,0211 | |||
| PNC / The PNC Financial Services Group, Inc. | 0,00 | 1,73 | 0,71 | −7,87 | 0,2567 | −0,0271 | |||
| AVY / Avery Dennison Corporation | 0,00 | 1,78 | 0,71 | −3,65 | 0,2562 | −0,0149 | |||
| CEG / Constellation Energy Corporation | 0,00 | 31,31 | 0,70 | 60,64 | 0,2523 | 0,0922 | |||
| CL / Colgate-Palmolive Company | 0,01 | −30,85 | 0,68 | −29,51 | 0,2455 | −0,1092 | |||
| NKE / NIKE, Inc. | 0,01 | −34,01 | 0,66 | −49,70 | 0,2388 | −0,2443 | |||
| MLM / Martin Marietta Materials, Inc. | 0,00 | 1,78 | 0,66 | 15,24 | 0,2366 | 0,0277 | |||
| URI / United Rentals, Inc. | 0,00 | −51,39 | 0,66 | −46,41 | 0,2359 | −0,2122 | |||
| GM / General Motors Company | 0,01 | −60,89 | 0,65 | −60,54 | 0,2330 | −0,3679 | |||
| NDAQ / Nasdaq, Inc. | 0,01 | 1,76 | 0,64 | 2,72 | 0,2313 | 0,0019 | |||
| AIZ / Assurant, Inc. | 0,00 | 1,81 | 0,64 | −0,62 | 0,2293 | −0,0056 | |||
| CACI / CACI International Inc | 0,00 | 0,64 | 0,2286 | 0,2286 | |||||
| CI / The Cigna Group | 0,00 | −17,82 | 0,63 | −15,84 | 0,2256 | −0,0471 | |||
| PLD / Prologis, Inc. | 0,01 | −36,56 | 0,62 | −44,42 | 0,2240 | −0,1863 | |||
| FCX / Freeport-McMoRan Inc. | 0,02 | 1,75 | 0,59 | 6,07 | 0,2136 | 0,0085 | |||
| AEP / American Electric Power Company, Inc. | 0,01 | 6,33 | 0,59 | 3,72 | 0,2104 | 0,0039 | |||
| EOG / EOG Resources, Inc. | 0,01 | 1,73 | 0,58 | −12,87 | 0,2091 | −0,0357 | |||
| MET / MetLife, Inc. | 0,01 | 1,75 | 0,58 | −7,26 | 0,2068 | −0,0202 | |||
| DXCM / DexCom, Inc. | 0,01 | 1,73 | 0,56 | −1,23 | 0,2029 | −0,0063 | |||
| VST / Vistra Corp. | 0,00 | 66,39 | 0,55 | 100,36 | 0,1988 | 0,0975 | |||
| CNP / CenterPoint Energy, Inc. | 0,01 | 48,48 | 0,55 | 60,82 | 0,1978 | 0,0725 | |||
| J / Jacobs Solutions Inc. | 0,00 | 1,80 | 0,55 | 0,37 | 0,1974 | −0,0029 | |||
| DUK / Duke Energy Corporation | 0,00 | −9,00 | 0,53 | −8,93 | 0,1906 | −0,0223 | |||
| VRSK / Verisk Analytics, Inc. | 0,00 | 1,69 | 0,53 | 7,72 | 0,1905 | 0,0102 | |||
| TKO / TKO Group Holdings, Inc. | 0,00 | −42,83 | 0,53 | −40,14 | 0,1900 | −0,1330 | |||
| ARES / Ares Management Corporation | 0,00 | 0,53 | 0,1888 | 0,1888 | |||||
| AZN / AstraZeneca PLC - Depositary Receipt (Common Stock) | 0,01 | 1,72 | 0,51 | −2,85 | 0,1839 | −0,0088 | |||
| AEM / Agnico Eagle Mines Limited | 0,00 | 32,31 | 0,50 | 62,46 | 0,1805 | 0,0671 | |||
| APO / Apollo Global Management, Inc. | 0,00 | 1,73 | 0,48 | −10,89 | 0,1736 | −0,0249 | |||
| LNT / Alliant Energy Corporation | 0,01 | 39,56 | 0,48 | 34,73 | 0,1729 | 0,0421 | |||
| ASML / ASML Holding N.V. - Depositary Receipt (Common Stock) | 0,00 | 2,23 | 0,47 | 6,31 | 0,1697 | 0,0070 | |||
| DGX / Quest Diagnostics Incorporated | 0,00 | −26,93 | 0,47 | −26,86 | 0,1695 | −0,0661 | |||
| ADSK / Autodesk, Inc. | 0,00 | 1,81 | 0,47 | 9,91 | 0,1677 | 0,0124 | |||
| ECL / Ecolab Inc. | 0,00 | 1,64 | 0,46 | 0,44 | 0,1654 | −0,0024 | |||
| LPLA / LPL Financial Holdings Inc. | 0,00 | 107,35 | 0,45 | 115,94 | 0,1609 | 0,0850 | |||
| WMB / The Williams Companies, Inc. | 0,01 | 1,74 | 0,45 | 5,69 | 0,1605 | 0,0060 | |||
| DTE / DTE Energy Company | 0,00 | 28,64 | 0,45 | 31,56 | 0,1605 | 0,0362 | |||
| PSX / Phillips 66 | 0,00 | 1,83 | 0,44 | −10,89 | 0,1590 | −0,0227 | |||
| DRI / Darden Restaurants, Inc. | 0,00 | −11,44 | 0,43 | −5,45 | 0,1561 | −0,0119 | |||
| EQT / EQT Corporation | 0,01 | 1,72 | 0,43 | 16,44 | 0,1554 | 0,0195 | |||
| REGN / Regeneron Pharmaceuticals, Inc. | 0,00 | 1,66 | 0,42 | −28,62 | 0,1506 | −0,0644 | |||
| STLD / Steel Dynamics, Inc. | 0,00 | 1,73 | 0,41 | −7,32 | 0,1458 | −0,0144 | |||
| ELS / Equity LifeStyle Properties, Inc. | 0,01 | 1,71 | 0,40 | −5,71 | 0,1424 | −0,0114 | |||
| BK / The Bank of New York Mellon Corporation | 0,00 | 1,79 | 0,39 | 1,31 | 0,1392 | −0,0006 | |||
| MSI / Motorola Solutions, Inc. | 0,00 | −52,16 | 0,39 | −54,84 | 0,1391 | −0,1747 | |||
| LEN / Lennar Corporation | 0,00 | 1,80 | 0,38 | −9,79 | 0,1361 | −0,0175 | |||
| UGI / UGI Corporation | 0,01 | 122,61 | 0,38 | 135,85 | 0,1348 | 0,0764 | |||
| TW / Tradeweb Markets Inc. | 0,00 | 1,66 | 0,37 | 8,48 | 0,1336 | 0,0082 | |||
| BKR / Baker Hughes Company | 0,01 | 1,78 | 0,37 | −15,53 | 0,1332 | −0,0272 | |||
| CDW / CDW Corporation | 0,00 | 1,75 | 0,37 | 3,09 | 0,1319 | 0,0015 | |||
| FCPT / Four Corners Property Trust, Inc. | 0,01 | 1,75 | 0,36 | −2,45 | 0,1292 | −0,0055 | |||
| WRBY / Warby Parker Inc. | 0,02 | 1,77 | 0,36 | −12,90 | 0,1289 | −0,0218 | |||
| NUE / Nucor Corporation | 0,00 | 1,84 | 0,34 | −18,90 | 0,1218 | −0,0313 | |||
| SRE / Sempra | 0,00 | −28,92 | 0,33 | −21,96 | 0,1176 | −0,0358 | |||
| CFG / Citizens Financial Group, Inc. | 0,01 | 1,77 | 0,33 | −10,22 | 0,1169 | −0,0158 | |||
| A / Agilent Technologies, Inc. | 0,00 | 1,73 | 0,32 | −11,05 | 0,1159 | −0,0167 | |||
| FANG / Diamondback Energy, Inc. | 0,00 | −19,63 | 0,32 | −32,06 | 0,1152 | −0,0573 | |||
| STWD / Starwood Property Trust, Inc. | 0,02 | 1,77 | 0,32 | −2,15 | 0,1145 | −0,0046 | |||
| MTCH / Match Group, Inc. | 0,01 | 1,75 | 0,32 | −3,95 | 0,1138 | −0,0068 | |||
| IT / Gartner, Inc. | 0,00 | 1,99 | 0,31 | −10,86 | 0,1124 | −0,0158 | |||
| FE / FirstEnergy Corp. | 0,01 | 1,75 | 0,31 | 10,04 | 0,1104 | 0,0083 | |||
| ETR / Entergy Corporation | 0,00 | −37,96 | 0,30 | −40,90 | 0,1088 | −0,0784 | |||
| LNG / Cheniere Energy, Inc. | 0,00 | −20,94 | 0,30 | −18,08 | 0,1077 | −0,0261 | |||
| IQV / IQVIA Holdings Inc. | 0,00 | −15,67 | 0,28 | −37,22 | 0,1006 | −0,0629 | |||
| Aptiv PLC / EC (JE00BTDN8H13) | 0,00 | −60,69 | 0,28 | −59,62 | 0,1003 | −0,1529 | |||
| IONS / Ionis Pharmaceuticals, Inc. | 0,01 | 1,73 | 0,28 | 3,00 | 0,0989 | 0,0008 | |||
| INVH / Invitation Homes Inc. | 0,01 | 1,75 | 0,27 | 0,74 | 0,0985 | −0,0010 | |||
| PNM / PNM Resources, Inc. | 0,00 | 0,27 | 0,0985 | 0,0985 | |||||
| PEG / Public Service Enterprise Group Incorporated | 0,00 | −30,81 | 0,27 | −30,85 | 0,0967 | −0,0458 | |||
| PCG / PG&E Corporation | 0,02 | −22,79 | 0,27 | −20,12 | 0,0956 | −0,0265 | |||
| THC / Tenet Healthcare Corporation | 0,00 | 0,25 | 0,0908 | 0,0908 | |||||
| UTZ / Utz Brands, Inc. | 0,02 | 71,10 | 0,24 | 65,97 | 0,0862 | 0,0334 | |||
| WY / Weyerhaeuser Company | 0,01 | 1,72 | 0,24 | −12,64 | 0,0846 | −0,0138 | |||
| BALL / Ball Corporation | 0,00 | 1,82 | 0,23 | 3,60 | 0,0829 | 0,0014 | |||
| EQR / Equity Residential | 0,00 | 1,75 | 0,23 | −3,80 | 0,0820 | −0,0048 | |||
| EA / Electronic Arts Inc. | 0,00 | −44,29 | 0,22 | −37,95 | 0,0806 | −0,0517 | |||
| LVS / Las Vegas Sands Corp. | 0,01 | −60,95 | 0,22 | −64,10 | 0,0788 | −0,1444 | |||
| DAL / Delta Air Lines, Inc. | 0,00 | 1,74 | 0,22 | −18,11 | 0,0781 | −0,0190 | |||
| WAY / Waystar Holding Corp. | 0,01 | −24,59 | 0,21 | −30,49 | 0,0762 | −0,0357 | |||
| TRGP / Targa Resources Corp. | 0,00 | 1,66 | 0,20 | −20,39 | 0,0730 | −0,0204 | |||
| WIX / Wix.com Ltd. | 0,00 | 1,66 | 0,19 | −24,80 | 0,0689 | −0,0241 | |||
| BLDR / Builders FirstSource, Inc. | 0,00 | 1,60 | 0,19 | −21,49 | 0,0686 | −0,0201 | |||
| BN / Brookfield Corporation | 0,00 | 1,85 | 0,18 | 1,14 | 0,0638 | −0,0002 | |||
| SHEL / Shell plc - Depositary Receipt (Common Stock) | 0,00 | 1,80 | 0,16 | 0,00 | 0,0564 | −0,0011 | |||
| ESI / Element Solutions Inc | 0,01 | 1,78 | 0,15 | −16,30 | 0,0554 | −0,0123 | |||
| EFX / Equifax Inc. | 0,00 | −45,48 | 0,15 | −41,37 | 0,0527 | −0,0387 | |||
| BMRN / BioMarin Pharmaceutical Inc. | 0,00 | 1,77 | 0,14 | −16,67 | 0,0504 | −0,0114 | |||
| DTM / DT Midstream, Inc. | 0,00 | −37,15 | 0,13 | −31,61 | 0,0477 | −0,0232 | |||
| TOL / Toll Brothers, Inc. | 0,00 | 1,75 | 0,13 | −4,51 | 0,0457 | −0,0033 | |||
| MBLY / Mobileye Global Inc. | 0,01 | −79,29 | 0,13 | −78,62 | 0,0457 | −0,1720 | |||
| 1RDNT / RadNet, Inc. | 0,00 | 0,12 | 0,0417 | 0,0417 | |||||
| NVO / Novo Nordisk A/S - Depositary Receipt (Common Stock) | 0,00 | 1,58 | 0,10 | −20,00 | 0,0348 | −0,0094 | |||
| AVTR / Avantor, Inc. | 0,01 | −42,79 | 0,09 | −55,84 | 0,0314 | −0,0409 | |||
| GVMXX / State Street Institutional Investment Trust - State Street Institutional US Govt Money Market Fnd Premier Cls | 0,07 | −7,26 | 0,07 | −8,22 | 0,0244 | −0,0024 | |||
| TLN / Talen Energy Corporation | 0,00 | −75,80 | 0,04 | −71,54 | 0,0133 | −0,0345 | |||
| AMTM / Amentum Holdings, Inc. | 0,00 | 0,01 | 0,0020 | 0,0020 | |||||
| LFST / LifeStance Health Group, Inc. | 0,00 | −100,00 | 0,00 | −100,00 | −0,1117 | ||||
| ACHC / Acadia Healthcare Company, Inc. | 0,00 | −100,00 | 0,00 | −100,00 | −0,0798 |