Grunnleggende statistikk
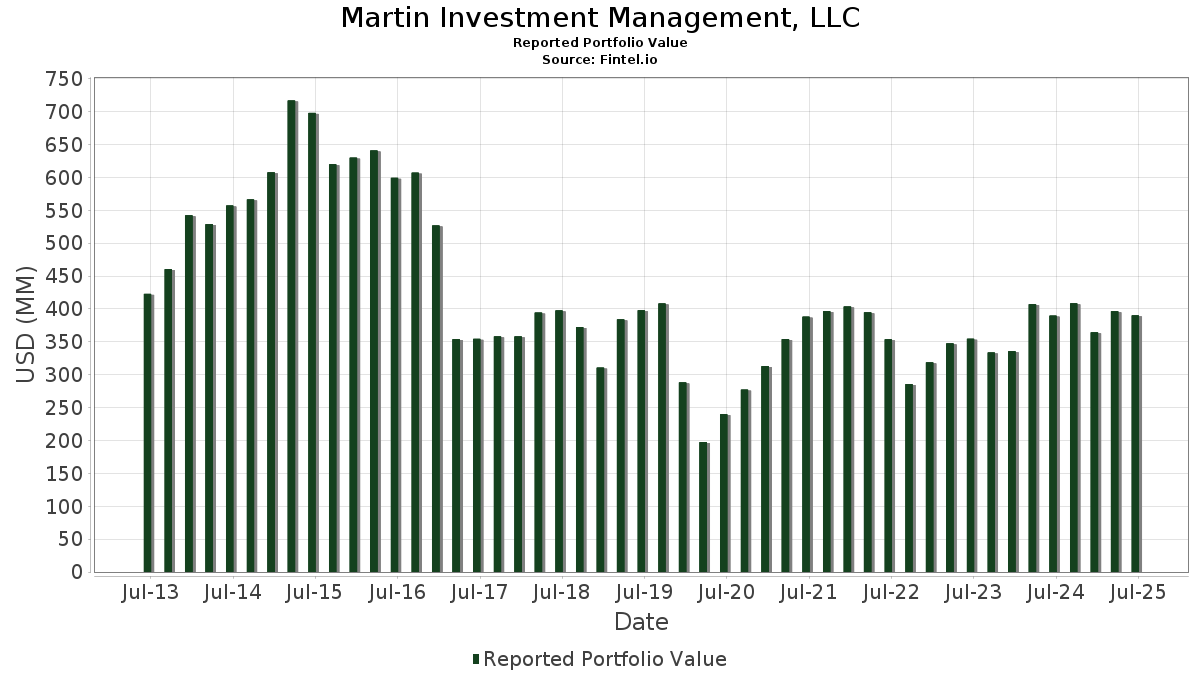
| Porteføljeverdi | $ 390 114 952 |
| Nåværende posisjoner | 49 |
Siste beholdninger, prestasjoner, forvaltet kapital (fra 13F, 13D)
Martin Investment Management, LLC har oppgitt 49 totale beholdninger i sine siste SEC-arkiveringer. Siste porteføljeverdi er beregnet til 390 114 952 USD. Faktisk forvaltet kapital (AUM) er denne verdien pluss kontanter (som ikke er oppgitt). Martin Investment Management, LLCs største beholdninger er Check Point Software Technologies Ltd. (US:CHKP) , Sony Group Corporation - Depositary Receipt (Common Stock) (US:SONY) , Novartis AG - Depositary Receipt (Common Stock) (US:NVS) , Alcon Inc. (US:ALC) , and AstraZeneca PLC - Depositary Receipt (Common Stock) (US:AZN) . Martin Investment Management, LLCs nye posisjoner inkluderer Leidos Holdings, Inc. (DE:S6IA) , .
De største økningene dette kvartalet
Vi bruker endringen i porteføljeallokeringen fordi dette er det mest meningsfulle målet. Endringer kan skyldes handler eller endringer i aksjekursene.
| Verdipapirer | Aksjer (MM) |
Verdi (MM$) |
Portefølje % | ΔPortefølje % |
|---|---|---|---|---|
| 0,04 | 5,76 | 1,4758 | 1,4758 | |
| 0,13 | 21,14 | 5,4199 | 1,0751 | |
| 0,00 | 13,52 | 3,4651 | 0,7500 | |
| 0,02 | 3,42 | 0,8778 | 0,5414 | |
| 0,03 | 11,01 | 2,8228 | 0,4751 | |
| 0,07 | 12,31 | 3,1545 | 0,4271 | |
| 0,04 | 9,36 | 2,3987 | 0,3586 | |
| 0,03 | 7,84 | 2,0104 | 0,3543 | |
| 0,03 | 6,40 | 1,6394 | 0,2644 | |
| 0,22 | 26,53 | 6,8012 | 0,2548 |
De største reduksjonene dette kvartalet
Vi bruker endringen i porteføljeallokeringen fordi dette er det mest meningsfulle målet. Endringer kan skyldes handler eller endringer i aksjekurser.
| Verdipapirer | Aksjer (MM) |
Verdi (MM$) |
Portefølje % | ΔPortefølje % |
|---|---|---|---|---|
| 0,13 | 29,21 | 7,4867 | −1,7162 | |
| 0,26 | 22,73 | 5,8263 | −0,7241 | |
| 0,12 | 20,00 | 5,1258 | −0,3881 | |
| 0,09 | 18,02 | 4,6187 | −0,3728 | |
| 0,02 | 6,35 | 1,6274 | −0,3520 | |
| 0,02 | 10,89 | 2,7920 | −0,2622 | |
| 1,03 | 26,91 | 6,8968 | −0,1819 | |
| 0,28 | 19,10 | 4,8963 | −0,1665 | |
| 0,05 | 4,00 | 1,0242 | −0,1101 | |
| 0,01 | 6,96 | 1,7830 | −0,0433 |
13F- og Fondsarkiveringer
Dette skjemaet ble sendt inn den 2025-08-07 for rapporteringsperioden 2025-06-30. Klikk på lenkeikonet for å se hele transaksjonshistorikken.
Oppgradere for å låse opp premiedata og eksportere til Excel![]() .
.
| Verdipapirer | Type | Gjennomsnittlig aksjekurs | Aksjer (MM) |
ΔAksjer (%) |
ΔAksjer (%) |
Verdi ($MM) |
Portefølje (%) |
ΔPortefølje (%) |
|
|---|---|---|---|---|---|---|---|---|---|
| CHKP / Check Point Software Technologies Ltd. | 0,13 | −17,52 | 29,21 | −19,93 | 7,4867 | −1,7162 | |||
| SONY / Sony Group Corporation - Depositary Receipt (Common Stock) | 1,03 | −6,46 | 26,91 | −4,11 | 6,8968 | −0,1819 | |||
| NVS / Novartis AG - Depositary Receipt (Common Stock) | 0,22 | −5,80 | 26,53 | 2,25 | 6,8012 | 0,2548 | |||
| ALC / Alcon Inc. | 0,26 | −5,86 | 22,73 | −12,45 | 5,8263 | −0,7241 | |||
| AZN / AstraZeneca PLC - Depositary Receipt (Common Stock) | 0,32 | 3,55 | 22,50 | −1,55 | 5,7685 | 0,0014 | |||
| NICE / NICE Ltd. - Depositary Receipt (Common Stock) | 0,13 | 12,06 | 21,14 | 22,77 | 5,4199 | 1,0751 | |||
| TM / Toyota Motor Corporation - Depositary Receipt (Common Stock) | 0,12 | −6,24 | 20,00 | −8,51 | 5,1258 | −0,3881 | |||
| MA / Mastercard Incorporated | 0,03 | −1,33 | 19,11 | 1,15 | 4,8977 | 0,1321 | |||
| NVO / Novo Nordisk A/S - Depositary Receipt (Common Stock) | 0,28 | −4,23 | 19,10 | −4,81 | 4,8963 | −0,1665 | |||
| AAPL / Apple Inc. | 0,09 | −1,40 | 18,02 | −8,93 | 4,6187 | −0,3728 | |||
| BKNG / Booking Holdings Inc. | 0,00 | −0,04 | 13,52 | 25,61 | 3,4651 | 0,7500 | |||
| GOOGL / Alphabet Inc. | 0,07 | −0,11 | 12,31 | 13,84 | 3,1545 | 0,4271 | |||
| AXP / American Express Company | 0,03 | −0,18 | 11,01 | 18,34 | 2,8228 | 0,4751 | |||
| BRK.B / Berkshire Hathaway Inc. | 0,02 | −1,36 | 10,89 | −10,03 | 2,7920 | −0,2622 | |||
| WAB / Westinghouse Air Brake Technologies Corporation | 0,04 | 0,25 | 9,36 | 15,73 | 2,3987 | 0,3586 | |||
| VRSK / Verisk Analytics, Inc. | 0,03 | −0,26 | 8,64 | 4,40 | 2,2150 | 0,1266 | |||
| CBOE / Cboe Global Markets, Inc. | 0,03 | −0,06 | 8,05 | 2,99 | 2,0640 | 0,0916 | |||
| LHX / L3Harris Technologies, Inc. | 0,03 | −0,30 | 7,84 | 19,47 | 2,0104 | 0,3543 | |||
| SYK / Stryker Corporation | 0,02 | −0,50 | 7,65 | 5,75 | 1,9614 | 0,1359 | |||
| AZO / AutoZone, Inc. | 0,00 | 0,30 | 7,44 | −2,35 | 1,9060 | −0,0150 | |||
| ROP / Roper Technologies, Inc. | 0,01 | −0,06 | 6,96 | −3,91 | 1,7830 | −0,0433 | |||
| LNG / Cheniere Energy, Inc. | 0,03 | 0,00 | 6,89 | 5,24 | 1,7657 | 0,1143 | |||
| AME / AMETEK, Inc. | 0,04 | 0,20 | 6,62 | 5,33 | 1,6979 | 0,1114 | |||
| NXPI / NXP Semiconductors N.V. | 0,03 | 2,08 | 6,40 | 17,36 | 1,6394 | 0,2644 | |||
| ACN / Accenture plc | 0,02 | 1,20 | 6,38 | −3,07 | 1,6361 | −0,0251 | |||
| TMO / Thermo Fisher Scientific Inc. | 0,02 | −0,69 | 6,35 | −19,08 | 1,6274 | −0,3520 | |||
| S6IA / Leidos Holdings, Inc. | 0,04 | 5,76 | 1,4758 | 1,4758 | |||||
| ADBE / Adobe Inc. | 0,01 | −0,10 | 5,47 | 0,77 | 1,4030 | 0,0327 | |||
| MRK / Merck & Co., Inc. | 0,05 | 0,77 | 4,00 | −11,14 | 1,0242 | −0,1101 | |||
| NVDD / Direxion Shares ETF Trust - Direxion Daily NVDA Bear 1X Shares | 0,02 | 76,16 | 3,42 | 156,86 | 0,8778 | 0,5414 | |||
| MSFT / Microsoft Corporation | 0,00 | 5,16 | 1,01 | 39,34 | 0,2597 | 0,0763 | |||
| ASML / ASML Holding N.V. - Depositary Receipt (Common Stock) | 0,00 | 11,13 | 1,00 | 34,41 | 0,2564 | 0,0686 | |||
| AMZN / Amazon.com, Inc. | 0,00 | 0,69 | 0,86 | 16,10 | 0,2201 | 0,0335 | |||
| GOOG / Alphabet Inc. | 0,00 | −1,66 | 0,76 | 11,69 | 0,1936 | 0,0229 | |||
| XOM / Exxon Mobil Corporation | 0,01 | −2,02 | 0,73 | −11,27 | 0,1878 | −0,0203 | |||
| AON / Aon plc | 0,00 | 15,38 | 0,70 | 3,12 | 0,1783 | 0,0082 | |||
| RELX / RELX PLC - Depositary Receipt (Common Stock) | 0,01 | 33,45 | 0,62 | 43,72 | 0,1587 | 0,0501 | |||
| TSM / Taiwan Semiconductor Manufacturing Company Limited - Depositary Receipt (Common Stock) | 0,00 | −0,22 | 0,51 | 36,44 | 0,1315 | 0,0364 | |||
| MDT / Medtronic plc | 0,01 | 18,29 | 0,48 | 14,69 | 0,1243 | 0,0177 | |||
| HLN / Haleon plc - Depositary Receipt (Common Stock) | 0,05 | 24,66 | 0,47 | 25,73 | 0,1217 | 0,0263 | |||
| V / Visa Inc. | 0,00 | −7,14 | 0,46 | −5,92 | 0,1183 | −0,0055 | |||
| ALLE / Allegion plc | 0,00 | 33,62 | 0,42 | 47,37 | 0,1079 | 0,0360 | |||
| KMB / Kimberly-Clark Corporation | 0,00 | −1,41 | 0,36 | −10,67 | 0,0925 | −0,0094 | |||
| COST / Costco Wholesale Corporation | 0,00 | 0,00 | 0,34 | 4,69 | 0,0860 | 0,0051 | |||
| SU / Suncor Energy Inc. | 0,01 | 28,15 | 0,26 | 23,92 | 0,0664 | 0,0137 | |||
| FDS / FactSet Research Systems Inc. | 0,00 | 0,00 | 0,26 | −1,53 | 0,0659 | −0,0000 | |||
| META / Meta Platforms, Inc. | 0,00 | 0,24 | 0,0626 | 0,0626 | |||||
| AVGO / Broadcom Inc. | 0,00 | 0,22 | 0,0565 | 0,0565 | |||||
| PLTR / Palantir Technologies Inc. | 0,00 | −49,34 | 0,21 | −18,36 | 0,0538 | −0,0109 | |||
| FANG / Diamondback Energy, Inc. | 0,00 | −100,00 | 0,00 | 0,0000 | |||||
| GD / General Dynamics Corporation | 0,00 | −100,00 | 0,00 | 0,0000 | |||||
| TTE / TotalEnergies SE - Depositary Receipt (Common Stock) | 0,00 | −100,00 | 0,00 | 0,0000 | |||||
| AXON / Axon Enterprise, Inc. | 0,00 | −100,00 | 0,00 | 0,0000 |