Grunnleggende statistikk
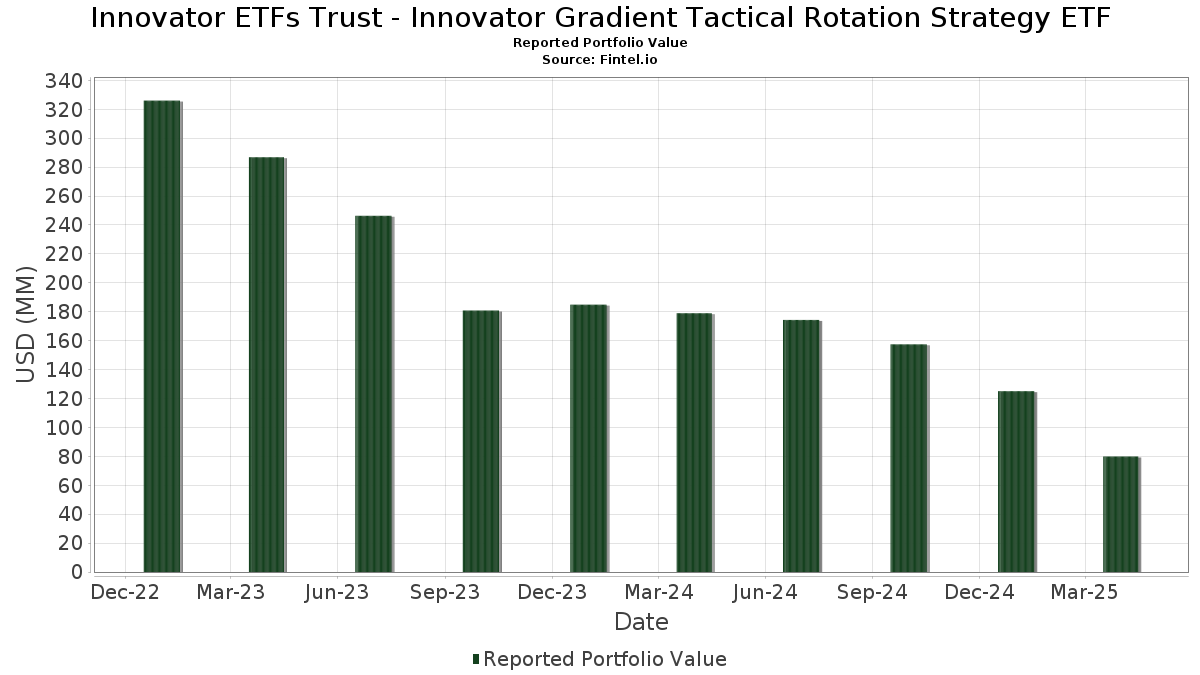
| Porteføljeverdi | $ 79 893 759 |
| Nåværende posisjoner | 102 |
Siste beholdninger, prestasjoner, forvaltet kapital (fra 13F, 13D)
Innovator ETFs Trust - Innovator Gradient Tactical Rotation Strategy ETF har oppgitt 102 totale beholdninger i sine siste SEC-arkiveringer. Siste porteføljeverdi er beregnet til 79 893 759 USD. Faktisk forvaltet kapital (AUM) er denne verdien pluss kontanter (som ikke er oppgitt). Innovator ETFs Trust - Innovator Gradient Tactical Rotation Strategy ETFs største beholdninger er The Coca-Cola Company (US:KO) , Berkshire Hathaway Inc. (US:BRK.B) , Republic Services, Inc. (US:RSG) , Marsh & McLennan Companies, Inc. (US:MMC) , and Atmos Energy Corporation (US:ATO) .
De største økningene dette kvartalet
Vi bruker endringen i porteføljeallokeringen fordi dette er det mest meningsfulle målet. Endringer kan skyldes handler eller endringer i aksjekursene.
| Verdipapirer | Aksjer (MM) |
Verdi (MM$) |
Portefølje % | ΔPortefølje % |
|---|---|---|---|---|
| 5,88 | 5,88 | 7,9266 | 7,9266 | |
| 0,00 | 0,97 | 1,3110 | 1,2251 | |
| 0,01 | 0,92 | 1,2447 | 1,2017 | |
| 0,02 | 0,88 | 1,1896 | 1,1499 | |
| 0,01 | 0,87 | 1,1708 | 1,1421 | |
| 0,01 | 0,89 | 1,1992 | 1,1360 | |
| 0,00 | 0,85 | 1,1435 | 1,1089 | |
| 0,01 | 0,84 | 1,1345 | 1,0962 | |
| 0,02 | 0,84 | 1,1298 | 1,0816 | |
| 0,00 | 0,85 | 1,1504 | 1,0637 |
De største reduksjonene dette kvartalet
Vi bruker endringen i porteføljeallokeringen fordi dette er det mest meningsfulle målet. Endringer kan skyldes handler eller endringer i aksjekurser.
| Verdipapirer | Aksjer (MM) |
Verdi (MM$) |
Portefølje % | ΔPortefølje % |
|---|---|---|---|---|
| 0,00 | 0,00 | −5,9968 | ||
| 0,00 | 0,00 | −2,1960 | ||
| 0,00 | 0,00 | −2,0084 | ||
| 0,00 | 0,00 | −0,4445 | ||
| 0,00 | 0,00 | −0,3657 | ||
| 0,00 | 0,00 | −0,3487 | ||
| 0,00 | 0,00 | −0,3286 | ||
| 0,00 | 1,00 | 1,3472 | −0,3227 | |
| 0,00 | 0,00 | −0,2890 | ||
| 0,00 | 0,00 | −0,2486 |
13F- og Fondsarkiveringer
Dette skjemaet ble sendt inn den 2025-06-24 for rapporteringsperioden 2025-04-30. Klikk på lenkeikonet for å se hele transaksjonshistorikken.
Oppgradere for å låse opp premiedata og eksportere til Excel![]() .
.
| Verdipapirer | Type | Gjennomsnittlig aksjekurs | Aksjer (MM) |
ΔAksjer (%) |
ΔAksjer (%) |
Verdi ($MM) |
Portefølje (%) |
ΔPortefølje (%) |
|
|---|---|---|---|---|---|---|---|---|---|
| Mount Vernon Liquid Assets Portfolio, LLC / STIV (N/A) | 5,88 | 5,88 | 7,9266 | 7,9266 | |||||
| KO / The Coca-Cola Company | 0,01 | 57,65 | 1,01 | 80,21 | 1,3645 | 0,8863 | |||
| BRK.B / Berkshire Hathaway Inc. | 0,00 | −55,22 | 1,00 | −49,08 | 1,3472 | −0,3227 | |||
| RSG / Republic Services, Inc. | 0,00 | 733,55 | 0,97 | 871,00 | 1,3110 | 1,2251 | |||
| MMC / Marsh & McLennan Companies, Inc. | 0,00 | 269,20 | 0,93 | 285,12 | 1,2576 | 1,0507 | |||
| ATO / Atmos Energy Corporation | 0,01 | 1 518,31 | 0,92 | 1 744,00 | 1,2447 | 1,2017 | |||
| ED / Consolidated Edison, Inc. | 0,01 | 896,84 | 0,89 | 1 101,35 | 1,1992 | 1,1360 | |||
| FE / FirstEnergy Corp. | 0,02 | 1 656,36 | 0,88 | 1 815,22 | 1,1896 | 1,1499 | |||
| CME / CME Group Inc. | 0,00 | 283,96 | 0,88 | 351,03 | 1,1810 | 1,0152 | |||
| LIN / Linde plc | 0,00 | 76,61 | 0,87 | 79,55 | 1,1725 | 0,7599 | |||
| EVRG / Evergy, Inc. | 0,01 | 2 292,57 | 0,87 | 2 527,27 | 1,1708 | 1,1421 | |||
| COR / Cencora, Inc. | 0,00 | 628,50 | 0,85 | 743,56 | 1,1504 | 1,0637 | |||
| CL / Colgate-Palmolive Company | 0,01 | 396,19 | 0,85 | 429,19 | 1,1495 | 1,0119 | |||
| VRSN / VeriSign, Inc. | 0,00 | 1 489,95 | 0,85 | 2 017,50 | 1,1435 | 1,1089 | |||
| CMS / CMS Energy Corporation | 0,01 | 1 574,49 | 0,84 | 1 768,89 | 1,1345 | 1,0962 | |||
| PPL / PPL Corporation | 0,02 | 1 263,46 | 0,84 | 1 394,64 | 1,1298 | 1,0816 | |||
| ADP / Automatic Data Processing, Inc. | 0,00 | 195,16 | 0,83 | 193,59 | 1,1130 | 0,8730 | |||
| DUK / Duke Energy Corporation | 0,01 | 283,49 | 0,82 | 318,27 | 1,1128 | 0,9446 | |||
| PG / The Procter & Gamble Company | 0,01 | −5,62 | 0,82 | −7,62 | 1,1122 | 0,3524 | |||
| MDLZ / Mondelez International, Inc. | 0,01 | 293,15 | 0,82 | 364,20 | 1,1023 | 0,9516 | |||
| WEC / WEC Energy Group, Inc. | 0,01 | 923,55 | 0,81 | 1 039,44 | 1,0917 | 1,0307 | |||
| KDP / Keurig Dr Pepper Inc. | 0,02 | 807,51 | 0,81 | 882,93 | 1,0878 | 1,0175 | |||
| YUM / Yum! Brands, Inc. | 0,01 | 739,97 | 0,81 | 871,08 | 1,0875 | 1,0165 | |||
| JNJ / Johnson & Johnson | 0,01 | −6,21 | 0,81 | −3,59 | 1,0862 | 0,3743 | |||
| NI / NiSource Inc. | 0,02 | 1 827,89 | 0,80 | 1 958,97 | 1,0831 | 1,0493 | |||
| TJX / The TJX Companies, Inc. | 0,01 | 139,67 | 0,79 | 147,04 | 1,0708 | 0,7971 | |||
| O / Realty Income Corporation | 0,01 | 583,38 | 0,79 | 623,85 | 1,0651 | 0,9721 | |||
| GD / General Dynamics Corporation | 0,00 | 391,17 | 0,79 | 421,19 | 1,0619 | 0,9329 | |||
| L / Loews Corporation | 0,01 | 2 085,96 | 0,78 | 2 137,14 | 1,0574 | 1,0273 | |||
| ICE / Intercontinental Exchange, Inc. | 0,00 | 255,88 | 0,78 | 274,64 | 1,0563 | 0,8779 | |||
| CB / Chubb Limited | 0,00 | 217,87 | 0,78 | 235,34 | 1,0500 | 0,8517 | |||
| DTE / DTE Energy Company | 0,01 | 1 100,00 | 0,78 | 1 287,50 | 1,0489 | 1,0006 | |||
| ITW / Illinois Tool Works Inc. | 0,00 | 425,57 | 0,77 | 386,79 | 1,0443 | 0,9087 | |||
| SO / The Southern Company | 0,01 | 236,76 | 0,77 | 269,86 | 1,0435 | 0,8647 | |||
| PNW / Pinnacle West Capital Corporation | 0,01 | 3 023,08 | 0,77 | 3 409,09 | 1,0425 | 1,0232 | |||
| EXC / Exelon Corporation | 0,02 | 617,31 | 0,77 | 747,25 | 1,0405 | 0,9624 | |||
| BRO / Brown & Brown, Inc. | 0,01 | 1 173,43 | 0,76 | 1 262,50 | 1,0297 | 0,9813 | |||
| MO / Altria Group, Inc. | 0,01 | 233,15 | 0,76 | 279,10 | 1,0279 | 0,8558 | |||
| MCD / McDonald's Corporation | 0,00 | 45,42 | 0,76 | 61,02 | 1,0257 | 0,6234 | |||
| NOC / Northrop Grumman Corporation | 0,00 | 399,68 | 0,76 | 398,68 | 1,0230 | 0,8935 | |||
| MA / Mastercard Incorporated | 0,00 | −26,10 | 0,76 | −27,07 | 1,0216 | 0,1369 | |||
| JKHY / Jack Henry & Associates, Inc. | 0,00 | 2 511,38 | 0,76 | 2 506,90 | 1,0202 | 0,9954 | |||
| V / Visa Inc. | 0,00 | −44,76 | 0,75 | −44,17 | 1,0150 | −0,1330 | |||
| AEE / Ameren Corporation | 0,01 | 1 135,25 | 0,75 | 1 210,53 | 1,0086 | 0,9597 | |||
| SPGI / S&P Global Inc. | 0,00 | 106,21 | 0,75 | 97,62 | 1,0084 | 0,6864 | |||
| HON / Honeywell International Inc. | 0,00 | 137,67 | 0,74 | 123,49 | 1,0014 | 0,7186 | |||
| ORLY / O'Reilly Automotive, Inc. | 0,00 | 296,97 | 0,74 | 335,88 | 1,0003 | 0,8547 | |||
| AJG / Arthur J. Gallagher & Co. | 0,00 | 302,63 | 0,74 | 327,33 | 0,9927 | 0,8462 | |||
| AEP / American Electric Power Company, Inc. | 0,01 | 458,19 | 0,73 | 516,81 | 0,9911 | 0,8893 | |||
| BSX / Boston Scientific Corporation | 0,01 | 111,92 | 0,73 | 113,08 | 0,9889 | 0,6957 | |||
| KMB / Kimberly-Clark Corporation | 0,01 | 629,04 | 0,73 | 645,92 | 0,9862 | 0,9019 | |||
| LHX / L3Harris Technologies, Inc. | 0,00 | 664,52 | 0,73 | 693,48 | 0,9847 | 0,9063 | |||
| LNT / Alliant Energy Corporation | 0,01 | 1 921,67 | 0,72 | 2 026,47 | 0,9754 | 0,9460 | |||
| CHD / Church & Dwight Co., Inc. | 0,01 | 1 200,18 | 0,72 | 1 144,83 | 0,9739 | 0,9236 | |||
| VICI / VICI Properties Inc. | 0,02 | 837,21 | 0,72 | 915,49 | 0,9735 | 0,9125 | |||
| LMT / Lockheed Martin Corporation | 0,00 | 213,28 | 0,72 | 223,32 | 0,9731 | 0,7830 | |||
| REG / Regency Centers Corporation | 0,01 | 2 578,28 | 0,72 | 2 673,08 | 0,9726 | 0,9498 | |||
| RTX / RTX Corporation | 0,01 | 86,27 | 0,71 | 82,35 | 0,9628 | 0,6291 | |||
| VZ / Verizon Communications Inc. | 0,02 | 68,63 | 0,71 | 88,62 | 0,9625 | 0,6402 | |||
| WELL / Welltower Inc. | 0,00 | 246,15 | 0,71 | 287,50 | 0,9618 | 0,8049 | |||
| PEP / PepsiCo, Inc. | 0,01 | 67,74 | 0,71 | 51,17 | 0,9605 | 0,5586 | |||
| BR / Broadridge Financial Solutions, Inc. | 0,00 | 992,54 | 0,71 | 1 025,40 | 0,9573 | 0,9030 | |||
| FIS / Fidelity National Information Services, Inc. | 0,01 | 631,33 | 0,71 | 608,00 | 0,9563 | 0,8710 | |||
| WTW / Willis Towers Watson Public Limited Company | 0,00 | 897,83 | 0,71 | 841,33 | 0,9528 | 0,8883 | |||
| OTIS / Otis Worldwide Corporation | 0,01 | 703,29 | 0,71 | 710,34 | 0,9513 | 0,8772 | |||
| MSI / Motorola Solutions, Inc. | 0,00 | 319,16 | 0,70 | 294,94 | 0,9487 | 0,7964 | |||
| WM / Waste Management, Inc. | 0,00 | 257,67 | 0,70 | 280,33 | 0,9390 | 0,7825 | |||
| ROP / Roper Technologies, Inc. | 0,00 | 406,94 | 0,70 | 392,91 | 0,9383 | 0,8182 | |||
| SYY / Sysco Corporation | 0,01 | 769,82 | 0,70 | 758,02 | 0,9382 | 0,8687 | |||
| PAYX / Paychex, Inc. | 0,00 | 544,87 | 0,69 | 547,66 | 0,9355 | 0,8435 | |||
| WMT / Walmart Inc. | 0,01 | −28,63 | 0,69 | −29,32 | 0,9272 | 0,0991 | |||
| ABT / Abbott Laboratories | 0,01 | 32,19 | 0,68 | 35,18 | 0,9227 | 0,4914 | |||
| AVB / AvalonBay Communities, Inc. | 0,00 | 896,91 | 0,68 | 854,93 | 0,9148 | 0,8537 | |||
| VRSK / Verisk Analytics, Inc. | 0,00 | 608,70 | 0,68 | 634,78 | 0,9124 | 0,8336 | |||
| TMUS / T-Mobile US, Inc. | 0,00 | 144,83 | 0,67 | 159,46 | 0,9077 | 0,6868 | |||
| BDX / Becton, Dickinson and Company | 0,00 | 391,36 | 0,67 | 311,66 | 0,9059 | 0,7667 | |||
| HOLX / Hologic, Inc. | 0,01 | 2 074,72 | 0,67 | 1 663,16 | 0,9048 | 0,8723 | |||
| NDAQ / Nasdaq, Inc. | 0,01 | 830,19 | 0,67 | 768,83 | 0,9027 | 0,8364 | |||
| XOM / Exxon Mobil Corporation | 0,01 | −36,85 | 0,67 | −37,63 | 0,9022 | −0,0103 | |||
| UDR / UDR, Inc. | 0,02 | 2 209,05 | 0,66 | 2 264,29 | 0,8935 | 0,8691 | |||
| VLTO / Veralto Corporation | 0,01 | 1 121,81 | 0,66 | 1 037,93 | 0,8914 | 0,8417 | |||
| GIS / General Mills, Inc. | 0,01 | 815,77 | 0,66 | 765,79 | 0,8887 | 0,8238 | |||
| EXPD / Expeditors International of Washington, Inc. | 0,01 | 1 774,92 | 0,66 | 1 725,00 | 0,8867 | 0,8558 | |||
| AVY / Avery Dennison Corporation | 0,00 | 1 983,15 | 0,66 | 1 826,47 | 0,8847 | 0,8556 | |||
| SYK / Stryker Corporation | 0,00 | 123,50 | 0,65 | 113,73 | 0,8826 | 0,6217 | |||
| MDT / Medtronic plc | 0,01 | 162,17 | 0,65 | 145,28 | 0,8770 | 0,6507 | |||
| BLK / BlackRock, Inc. | 0,00 | 114,16 | 0,65 | 82,07 | 0,8768 | 0,5727 | |||
| COST / Costco Wholesale Corporation | 0,00 | −35,67 | 0,65 | −34,71 | 0,8733 | 0,0286 | |||
| ECL / Ecolab Inc. | 0,00 | 347,48 | 0,65 | 351,75 | 0,8726 | 0,7501 | |||
| CSCO / Cisco Systems, Inc. | 0,01 | 22,85 | 0,64 | 16,88 | 0,8700 | 0,4005 | |||
| PPG / PPG Industries, Inc. | 0,01 | 1 011,13 | 0,64 | 950,82 | 0,8647 | 0,8126 | |||
| BK / The Bank of New York Mellon Corporation | 0,01 | 378,19 | 0,64 | 349,30 | 0,8610 | 0,7395 | |||
| AON / Aon plc | 0,00 | 251,32 | 0,61 | 237,36 | 0,8289 | 0,6731 | |||
| AIZ / Assurant, Inc. | 0,00 | 2 597,44 | 0,61 | 2 332,00 | 0,8205 | 0,7990 | |||
| FRT / Federal Realty Investment Trust | 0,01 | 3 564,57 | 0,60 | 3 068,42 | 0,8133 | 0,7971 | |||
| CVX / Chevron Corporation | 0,00 | 14,74 | 0,60 | 4,75 | 0,8029 | 0,3184 | |||
| FI / Fiserv, Inc. | 0,00 | 142,06 | 0,58 | 106,79 | 0,7822 | 0,5434 | |||
| HLT / Hilton Worldwide Holdings Inc. | 0,00 | 357,27 | 0,57 | 304,23 | 0,7746 | 0,6531 | |||
| UNP / Union Pacific Corporation | 0,00 | 91,40 | 0,57 | 66,96 | 0,7706 | 0,4785 | |||
| CTSH / Cognizant Technology Solutions Corporation | 0,01 | 554,73 | 0,54 | 484,95 | 0,7348 | 0,6553 | |||
| LYB / LyondellBasell Industries N.V. | 0,01 | 1 401,01 | 0,52 | 1 077,27 | 0,6989 | 0,6606 | |||
| US BANK MMDA - USBGFS 9 / STIV (N/A) | 0,17 | 0,17 | 0,2262 | 0,2262 | |||||
| COO / The Cooper Companies, Inc. | 0,00 | −100,00 | 0,00 | −100,00 | −0,0375 | ||||
| GDDY / GoDaddy Inc. | 0,00 | −100,00 | 0,00 | −100,00 | −0,0580 | ||||
| FLT / Corpay, Inc. | 0,00 | −100,00 | 0,00 | −100,00 | −0,0519 | ||||
| GEV / GE Vernova Inc. | 0,00 | −100,00 | 0,00 | −100,00 | −0,2001 | ||||
| PLTR / Palantir Technologies Inc. | 0,00 | −100,00 | 0,00 | −100,00 | −0,3286 | ||||
| AMCR / Amcor plc | 0,00 | −100,00 | 0,00 | −100,00 | −0,0273 | ||||
| VST / Vistra Corp. | 0,00 | −100,00 | 0,00 | −100,00 | −0,1111 | ||||
| AVGO / Broadcom Inc. | 0,00 | −100,00 | 0,00 | −100,00 | −2,0084 | ||||
| CAT / Caterpillar Inc. | 0,00 | −100,00 | 0,00 | −100,00 | −0,3487 | ||||
| HWM / Howmet Aerospace Inc. | 0,00 | −100,00 | 0,00 | −100,00 | −0,0999 | ||||
| AMD / Advanced Micro Devices, Inc. | 0,00 | −100,00 | 0,00 | −100,00 | −0,3657 | ||||
| TPL / Texas Pacific Land Corporation | 0,00 | −100,00 | 0,00 | −100,00 | −0,0486 | ||||
| MHK / Mohawk Industries, Inc. | 0,00 | −100,00 | 0,00 | −100,00 | −0,0124 | ||||
| KEYS / Keysight Technologies, Inc. | 0,00 | −100,00 | 0,00 | −100,00 | −0,0602 | ||||
| J / Jacobs Solutions Inc. | 0,00 | −100,00 | 0,00 | −100,00 | −0,0339 | ||||
| ODFL / Old Dominion Freight Line, Inc. | 0,00 | −100,00 | 0,00 | −100,00 | −0,0678 | ||||
| TMO / Thermo Fisher Scientific Inc. | 0,00 | −100,00 | 0,00 | −100,00 | −0,4445 | ||||
| CNC / Centene Corporation | 0,00 | −100,00 | 0,00 | −100,00 | −0,0628 | ||||
| KKR / KKR & Co. Inc. | 0,00 | −100,00 | 0,00 | −100,00 | −0,2192 | ||||
| NCLH / Norwegian Cruise Line Holdings Ltd. | 0,00 | −100,00 | 0,00 | −100,00 | −0,0242 | ||||
| LH / Labcorp Holdings Inc. | 0,00 | −100,00 | 0,00 | −100,00 | −0,0406 | ||||
| BIIB / Biogen Inc. | 0,00 | −100,00 | 0,00 | −100,00 | −0,0408 | ||||
| HRL / Hormel Foods Corporation | 0,00 | −100,00 | 0,00 | −100,00 | −0,0169 | ||||
| SOLV / Solventum Corporation | 0,00 | −100,00 | 0,00 | −100,00 | −0,0199 | ||||
| NEM / Newmont Corporation | 0,00 | −100,00 | 0,00 | −100,00 | −0,0945 | ||||
| WDAY / Workday, Inc. | 0,00 | −100,00 | 0,00 | −100,00 | −0,1087 | ||||
| TSLA / Tesla, Inc. | 0,00 | −100,00 | 0,00 | −100,00 | −2,1960 | ||||
| MNST / Monster Beverage Corporation | 0,00 | −100,00 | 0,00 | −100,00 | −0,0663 | ||||
| APO / Apollo Global Management, Inc. | 0,00 | −100,00 | 0,00 | −100,00 | −0,1487 | ||||
| AMT / American Tower Corporation | 0,00 | −100,00 | 0,00 | −100,00 | −0,1681 | ||||
| BX / Blackstone Inc. | 0,00 | −100,00 | 0,00 | −100,00 | −0,2486 | ||||
| LII / Lennox International Inc. | 0,00 | −100,00 | 0,00 | −100,00 | −0,0373 | ||||
| MCO / Moody's Corporation | 0,00 | −100,00 | 0,00 | −100,00 | −0,1514 | ||||
| MSFT / Microsoft Corporation | 0,00 | −100,00 | 0,00 | −100,00 | −5,9968 | ||||
| AMAT / Applied Materials, Inc. | 0,00 | −100,00 | 0,00 | −100,00 | −0,2890 | ||||
| DECK / Deckers Outdoor Corporation | 0,00 | −100,00 | 0,00 | −100,00 | −0,0524 | ||||
| HSY / The Hershey Company | 0,00 | −100,00 | 0,00 | −100,00 | −0,0428 |