Grunnleggende statistikk
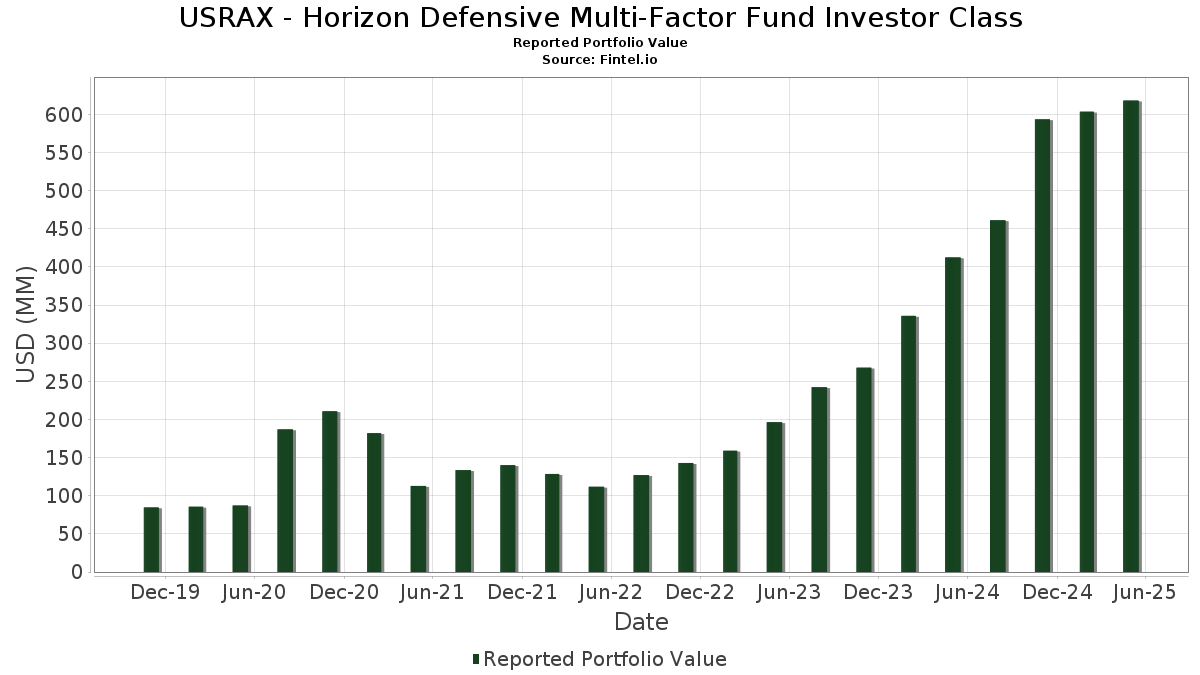
| Porteføljeverdi | $ 618 089 114 |
| Nåværende posisjoner | 159 |
Siste beholdninger, prestasjoner, forvaltet kapital (fra 13F, 13D)
USRAX - Horizon Defensive Multi-Factor Fund Investor Class har oppgitt 159 totale beholdninger i sine siste SEC-arkiveringer. Siste porteføljeverdi er beregnet til 618 089 114 USD. Faktisk forvaltet kapital (AUM) er denne verdien pluss kontanter (som ikke er oppgitt). USRAX - Horizon Defensive Multi-Factor Fund Investor Classs største beholdninger er NVIDIA Corporation (US:NVDA) , Meta Platforms, Inc. (US:META) , Berkshire Hathaway Inc. (US:BRK.B) , Broadcom Inc. (US:AVGO) , and Apple Inc. (US:AAPL) . USRAX - Horizon Defensive Multi-Factor Fund Investor Classs nye posisjoner inkluderer Uber Technologies, Inc. (US:UBER) , DoorDash, Inc. (US:DASH) , Axon Enterprise, Inc. (US:AXON) , Invitation Homes Inc. (US:INVH) , and .
De største økningene dette kvartalet
Vi bruker endringen i porteføljeallokeringen fordi dette er det mest meningsfulle målet. Endringer kan skyldes handler eller endringer i aksjekursene.
| Verdipapirer | Aksjer (MM) |
Verdi (MM$) |
Portefølje % | ΔPortefølje % |
|---|---|---|---|---|
| 0,08 | 20,39 | 3,2998 | 3,2998 | |
| 0,25 | 33,70 | 5,4529 | 0,9576 | |
| 0,09 | 13,86 | 2,2427 | 0,9270 | |
| 0,05 | 7,35 | 1,1890 | 0,7315 | |
| 0,01 | 4,00 | 0,6469 | 0,6469 | |
| 0,18 | 13,04 | 2,1104 | 0,6006 | |
| 0,04 | 3,35 | 0,5415 | 0,5415 | |
| 0,14 | 3,19 | 0,5169 | 0,5169 | |
| 0,06 | 3,13 | 0,5064 | 0,5064 | |
| 0,12 | 9,48 | 1,5345 | 0,4874 |
De største reduksjonene dette kvartalet
Vi bruker endringen i porteføljeallokeringen fordi dette er det mest meningsfulle målet. Endringer kan skyldes handler eller endringer i aksjekurser.
| Verdipapirer | Aksjer (MM) |
Verdi (MM$) |
Portefølje % | ΔPortefølje % |
|---|---|---|---|---|
| 0,12 | 11,92 | 1,9283 | −2,9425 | |
| 0,05 | 21,39 | 3,4617 | −1,0760 | |
| 0,02 | 2,67 | 0,4318 | −1,0162 | |
| 0,06 | 28,80 | 4,6599 | −0,8148 | |
| 0,00 | 2,26 | 0,3654 | −0,7643 | |
| 0,14 | 27,13 | 4,3901 | −0,5646 | |
| 0,01 | 1,88 | 0,3038 | −0,4867 | |
| 0,01 | 2,19 | 0,3536 | −0,4457 | |
| 0,00 | 0,00 | −0,4066 | ||
| 0,01 | 1,13 | 0,1828 | −0,3616 |
13F- og Fondsarkiveringer
Dette skjemaet ble sendt inn den 2025-07-23 for rapporteringsperioden 2025-05-31. Klikk på lenkeikonet for å se hele transaksjonshistorikken.
Oppgradere for å låse opp premiedata og eksportere til Excel![]() .
.
| Verdipapirer | Type | Gjennomsnittlig aksjekurs | Aksjer (MM) |
ΔAksjer (%) |
ΔAksjer (%) |
Verdi ($MM) |
Portefølje (%) |
ΔPortefølje (%) |
|
|---|---|---|---|---|---|---|---|---|---|
| NVDA / NVIDIA Corporation | 0,25 | 15,02 | 33,70 | 24,42 | 5,4529 | 0,9576 | |||
| META / Meta Platforms, Inc. | 0,05 | 0,96 | 31,10 | −2,17 | 5,0323 | −0,2440 | |||
| BRK.B / Berkshire Hathaway Inc. | 0,06 | −10,98 | 28,80 | −12,69 | 4,6599 | −0,8148 | |||
| AVGO / Broadcom Inc. | 0,11 | −11,53 | 27,56 | 7,39 | 4,4592 | 0,2000 | |||
| AAPL / Apple Inc. | 0,14 | 9,43 | 27,13 | −9,12 | 4,3901 | −0,5646 | |||
| MA / Mastercard Incorporated | 0,04 | 13,69 | 21,95 | 15,53 | 3,5512 | 0,3983 | |||
| MSFT / Microsoft Corporation | 0,05 | −32,52 | 21,39 | −21,75 | 3,4617 | −1,0760 | |||
| JPM / JPMorgan Chase & Co. | 0,08 | 20,39 | 3,2998 | 3,2998 | |||||
| PM / Philip Morris International Inc. | 0,08 | 8,51 | 13,99 | 26,20 | 2,2637 | 0,4237 | |||
| JNJ / Johnson & Johnson | 0,09 | 85,89 | 13,86 | 74,85 | 2,2427 | 0,9270 | |||
| NFLX / Netflix, Inc. | 0,01 | −27,60 | 13,73 | −10,86 | 2,2214 | −0,3347 | |||
| KO / The Coca-Cola Company | 0,18 | 41,60 | 13,04 | 43,37 | 2,1104 | 0,6006 | |||
| WMT / Walmart Inc. | 0,12 | −59,44 | 11,92 | −59,39 | 1,9283 | −2,9425 | |||
| CSCO / Cisco Systems, Inc. | 0,16 | 15,52 | 10,30 | 13,59 | 1,6667 | 0,1617 | |||
| T / AT&T Inc. | 0,35 | 0,35 | 9,66 | 20,46 | 1,5635 | 0,2136 | |||
| MRK / Merck & Co., Inc. | 0,12 | 80,46 | 9,48 | 50,32 | 1,5345 | 0,4874 | |||
| XOM / Exxon Mobil Corporation | 0,09 | −3,33 | 9,28 | −11,17 | 1,5011 | −0,2322 | |||
| PGR / The Progressive Corporation | 0,03 | 4,46 | 7,74 | 5,54 | 1,2520 | 0,0353 | |||
| QCOM / QUALCOMM Incorporated | 0,05 | 188,56 | 7,35 | 166,58 | 1,1890 | 0,7315 | |||
| BKNG / Booking Holdings Inc. | 0,00 | 16,16 | 7,14 | 27,81 | 1,1556 | 0,2282 | |||
| GILD / Gilead Sciences, Inc. | 0,06 | 49,37 | 6,92 | 43,83 | 1,1206 | 0,3215 | |||
| HD / The Home Depot, Inc. | 0,02 | 0,97 | 6,54 | −6,23 | 1,0588 | −0,0995 | |||
| WFC / Wells Fargo & Company | 0,09 | −8,10 | 6,53 | −12,25 | 1,0572 | −0,1786 | |||
| COST / Costco Wholesale Corporation | 0,01 | 84,88 | 6,14 | 83,40 | 0,9943 | 0,4382 | |||
| SPGI / S&P Global Inc. | 0,01 | 26,06 | 6,08 | 21,13 | 0,9844 | 0,1508 | |||
| TJX / The TJX Companies, Inc. | 0,04 | −9,34 | 5,66 | −7,79 | 0,9156 | −0,1028 | |||
| RTX / RTX Corporation | 0,04 | −19,90 | 5,23 | −17,80 | 0,8466 | −0,2097 | |||
| CB / Chubb Limited | 0,02 | −6,64 | 5,19 | −2,81 | 0,8395 | −0,0465 | |||
| CMCSA / Comcast Corporation | 0,15 | −5,46 | 5,11 | −8,92 | 0,8262 | −0,1042 | |||
| BSX / Boston Scientific Corporation | 0,05 | 29,27 | 5,00 | 31,13 | 0,8098 | 0,1762 | |||
| WM / Waste Management, Inc. | 0,02 | 21,06 | 4,65 | 27,83 | 0,7531 | 0,1404 | |||
| ABT / Abbott Laboratories | 0,03 | 54,03 | 4,37 | 49,10 | 0,7068 | 0,2205 | |||
| ICE / Intercontinental Exchange, Inc. | 0,02 | 29,25 | 4,26 | 43,86 | 0,6901 | 0,0478 | |||
| RSG / Republic Services, Inc. | 0,02 | 5,78 | 4,18 | 14,82 | 0,6759 | 0,0721 | |||
| DUK / Duke Energy Corporation | 0,04 | 56,08 | 4,15 | 56,42 | 0,6721 | 0,2313 | |||
| MDT / Medtronic plc | 0,05 | 28,52 | 4,11 | 15,92 | 0,6646 | 0,0764 | |||
| AMGN / Amgen Inc. | 0,01 | 4,00 | 0,6469 | 0,6469 | |||||
| MO / Altria Group, Inc. | 0,07 | −6,78 | 3,96 | 1,17 | 0,6413 | −0,0089 | |||
| AMT / American Tower Corporation | 0,02 | 29,14 | 3,80 | 34,84 | 0,6145 | 0,1470 | |||
| COP / ConocoPhillips | 0,04 | 11,57 | 3,75 | −3,97 | 0,6075 | −0,0413 | |||
| CME / CME Group Inc. | 0,01 | 403,02 | 3,65 | 617,88 | 0,5914 | 0,3817 | |||
| ORLY / O'Reilly Automotive, Inc. | 0,00 | 45,64 | 3,57 | 45,04 | 0,5769 | 0,1688 | |||
| NOC / Northrop Grumman Corporation | 0,01 | 148,95 | 3,52 | 161,52 | 0,5697 | 0,3461 | |||
| UBER / Uber Technologies, Inc. | 0,04 | 3,35 | 0,5415 | 0,5415 | |||||
| ECL / Ecolab Inc. | 0,01 | 17,49 | 3,24 | 16,02 | 0,5240 | 0,0607 | |||
| PFE / Pfizer Inc. | 0,14 | 3,19 | 0,5169 | 0,5169 | |||||
| NEM / Newmont Corporation | 0,06 | 3,13 | 0,5064 | 0,5064 | |||||
| VST / Vistra Corp. | 0,02 | 51,94 | 3,10 | 82,56 | 0,5014 | 0,2197 | |||
| ISRG / Intuitive Surgical, Inc. | 0,01 | −1,77 | 3,07 | −5,34 | 0,4963 | −0,0415 | |||
| HCA / HCA Healthcare, Inc. | 0,01 | 6,50 | 3,03 | 32,63 | 0,4907 | 0,1111 | |||
| UNP / Union Pacific Corporation | 0,01 | −25,77 | 3,01 | −33,30 | 0,4875 | −0,2622 | |||
| AZO / AutoZone, Inc. | 0,00 | 8,09 | 2,94 | 15,51 | 0,4760 | 0,0534 | |||
| CL / Colgate-Palmolive Company | 0,03 | 27,70 | 2,86 | 30,16 | 0,4624 | 0,0981 | |||
| LRCX / Lam Research Corporation | 0,03 | 187,73 | 2,76 | 202,85 | 0,4466 | 0,2954 | |||
| ACN / Accenture plc | 0,01 | −11,99 | 2,71 | −19,99 | 0,4384 | −0,1236 | |||
| PEP / PepsiCo, Inc. | 0,02 | 29,91 | 2,67 | −6,35 | 0,4318 | −1,0162 | |||
| CI / The Cigna Group | 0,01 | 225,16 | 2,63 | 204,87 | 0,4258 | 0,2805 | |||
| TRV / The Travelers Companies, Inc. | 0,01 | −18,85 | 2,59 | −13,45 | 0,4197 | −0,0777 | |||
| KMB / Kimberly-Clark Corporation | 0,02 | 2,49 | 0,4023 | 0,4023 | |||||
| DASH / DoorDash, Inc. | 0,01 | 2,40 | 0,3879 | 0,3879 | |||||
| FCX / Freeport-McMoRan Inc. | 0,06 | 2,38 | 0,3855 | 0,3855 | |||||
| EXC / Exelon Corporation | 0,05 | 0,83 | 2,37 | −0,04 | 0,3840 | −0,0100 | |||
| MSI / Motorola Solutions, Inc. | 0,01 | −25,99 | 2,36 | −30,17 | 0,3817 | −0,1789 | |||
| GD / General Dynamics Corporation | 0,01 | 47,85 | 2,28 | 37,53 | 0,3695 | 0,0099 | |||
| AEP / American Electric Power Company, Inc. | 0,02 | 15,09 | 2,28 | 12,30 | 0,3693 | 0,0320 | |||
| INTU / Intuit Inc. | 0,00 | −47,49 | 2,26 | −40,31 | 0,3654 | −0,7643 | |||
| LIN / Linde plc | 0,00 | 9,56 | 2,20 | 9,72 | 0,3562 | 0,0231 | |||
| FI / Fiserv, Inc. | 0,01 | −34,30 | 2,19 | −54,62 | 0,3536 | −0,4457 | |||
| ALL / The Allstate Corporation | 0,01 | −25,69 | 2,18 | −21,71 | 0,3521 | −0,1091 | |||
| MCD / McDonald's Corporation | 0,01 | −7,09 | 2,08 | −5,42 | 0,3363 | −0,0284 | |||
| KLAC / KLA Corporation | 0,00 | −17,46 | 2,05 | −23,77 | 0,3317 | −0,2508 | |||
| YUM / Yum! Brands, Inc. | 0,01 | 2,05 | 0,3312 | 0,3312 | |||||
| ROP / Roper Technologies, Inc. | 0,00 | 105,10 | 2,04 | 100,20 | 0,3303 | 0,1610 | |||
| CEG / Constellation Energy Corporation | 0,01 | 8,48 | 2,02 | 32,55 | 0,3276 | 0,0741 | |||
| VRSN / VeriSign, Inc. | 0,01 | 9,56 | 1,95 | 25,50 | 0,3163 | 0,0578 | |||
| TMO / Thermo Fisher Scientific Inc. | 0,00 | −27,99 | 1,90 | −45,18 | 0,3073 | −0,2674 | |||
| CRM / Salesforce, Inc. | 0,01 | −55,76 | 1,88 | −60,58 | 0,3038 | −0,4867 | |||
| ED / Consolidated Edison, Inc. | 0,02 | 130,01 | 1,77 | 136,90 | 0,2868 | 0,1625 | |||
| BDX / Becton, Dickinson and Company | 0,01 | 27,15 | 1,77 | −2,69 | 0,2866 | −0,0155 | |||
| CAH / Cardinal Health, Inc. | 0,01 | −15,77 | 1,77 | 0,45 | 0,2861 | −0,0060 | |||
| AME / AMETEK, Inc. | 0,01 | −2,11 | 1,76 | −7,57 | 0,2848 | −0,0312 | |||
| TT / Trane Technologies plc | 0,00 | −52,64 | 1,74 | −42,40 | 0,2809 | −0,2191 | |||
| KMI / Kinder Morgan, Inc. | 0,06 | 140,32 | 1,73 | 336,78 | 0,2807 | −0,0277 | |||
| WAB / Westinghouse Air Brake Technologies Corporation | 0,01 | −11,44 | 1,68 | −3,34 | 0,2717 | −0,0166 | |||
| FXFXX / First American Funds Inc - First American Treasury Obligations Fund Class X | 1,64 | −29,50 | 1,64 | −29,53 | 0,2659 | −0,1210 | |||
| BR / Broadridge Financial Solutions, Inc. | 0,01 | 20,26 | 1,64 | 21,03 | 0,2655 | 0,0405 | |||
| AMAT / Applied Materials, Inc. | 0,01 | 49,22 | 1,61 | 47,98 | 0,2611 | 0,0801 | |||
| CSX / CSX Corporation | 0,05 | 50,59 | 1,54 | 48,55 | 0,2492 | 0,0772 | |||
| TDY / Teledyne Technologies Incorporated | 0,00 | 51,08 | 1,51 | 46,40 | 0,2435 | 0,0728 | |||
| TE Connectivity PLC / EC (IE000IVNQZ81) | 0,01 | 1,48 | 0,2387 | 0,2387 | |||||
| WELL / Welltower Inc. | 0,01 | −22,54 | 1,46 | −22,16 | 0,2365 | −0,0751 | |||
| CMI / Cummins Inc. | 0,00 | 7,26 | 1,41 | −6,36 | 0,2289 | −0,0218 | |||
| UAL / United Airlines Holdings, Inc. | 0,02 | 71,50 | 1,41 | 45,30 | 0,2280 | 0,0670 | |||
| GDDY / GoDaddy Inc. | 0,01 | 21,76 | 1,40 | 23,63 | 0,2261 | 0,0384 | |||
| HIG / The Hartford Insurance Group, Inc. | 0,01 | −38,70 | 1,37 | −32,75 | 0,2222 | −0,1165 | |||
| FFIV / F5, Inc. | 0,00 | 38,45 | 1,32 | 35,10 | 0,2143 | 0,0516 | |||
| MU / Micron Technology, Inc. | 0,01 | 76,97 | 1,30 | 78,65 | 0,2099 | 0,0893 | |||
| DTE / DTE Energy Company | 0,01 | 122,27 | 1,30 | 160,97 | 0,2099 | 0,0896 | |||
| VLTO / Veralto Corporation | 0,01 | −0,78 | 1,27 | 0,48 | 0,2047 | −0,0042 | |||
| TSN / Tyson Foods, Inc. | 0,02 | −2,87 | 1,23 | −11,04 | 0,1996 | −0,0306 | |||
| CBRE / CBRE Group, Inc. | 0,01 | 10,33 | 1,23 | −2,84 | 0,1991 | −0,0111 | |||
| EXPE / Expedia Group, Inc. | 0,01 | 3,18 | 1,22 | −13,09 | 0,1978 | −0,0356 | |||
| EOG / EOG Resources, Inc. | 0,01 | −36,23 | 1,19 | −45,50 | 0,1930 | −0,1700 | |||
| FICO / Fair Isaac Corporation | 0,00 | −4,60 | 1,15 | −12,65 | 0,1855 | −0,0324 | |||
| PNC / The PNC Financial Services Group, Inc. | 0,01 | −61,97 | 1,13 | −65,58 | 0,1828 | −0,3616 | |||
| EXR / Extra Space Storage Inc. | 0,01 | 86,48 | 1,10 | 94,68 | 0,1777 | 0,0413 | |||
| FOXA / Fox Corporation | 0,02 | 0,80 | 1,10 | −3,86 | 0,1773 | −0,0118 | |||
| NDAQ / Nasdaq, Inc. | 0,01 | −53,55 | 1,08 | −53,12 | 0,1752 | −0,2081 | |||
| SYK / Stryker Corporation | 0,00 | −48,45 | 1,06 | −48,94 | 0,1713 | −0,1727 | |||
| DG / Dollar General Corporation | 0,01 | −1,41 | 1,04 | 29,40 | 0,1688 | 0,0348 | |||
| TRGP / Targa Resources Corp. | 0,01 | −11,11 | 1,01 | −30,43 | 0,1640 | −0,0777 | |||
| RCL / Royal Caribbean Cruises Ltd. | 0,00 | 7,88 | 1,01 | 12,65 | 0,1628 | 0,0146 | |||
| BIIB / Biogen Inc. | 0,01 | 637,86 | 0,99 | 309,13 | 0,1596 | 0,0700 | |||
| ZBRA / Zebra Technologies Corporation | 0,00 | 483,36 | 0,99 | 187,17 | 0,1595 | −0,1066 | |||
| ESS / Essex Property Trust, Inc. | 0,00 | −16,81 | 0,94 | −24,17 | 0,1523 | −0,0538 | |||
| UHS / Universal Health Services, Inc. | 0,00 | −7,84 | 0,93 | 0,11 | 0,1507 | −0,0037 | |||
| NVR / NVR, Inc. | 0,00 | 0,00 | 0,93 | −1,70 | 0,1497 | −0,0066 | |||
| AXON / Axon Enterprise, Inc. | 0,00 | 0,91 | 0,1474 | 0,1474 | |||||
| DVN / Devon Energy Corporation | 0,03 | 107,76 | 0,88 | 40,32 | 0,1432 | 0,0066 | |||
| STE / STERIS plc | 0,00 | 0,87 | 0,1408 | 0,1408 | |||||
| PHM / PulteGroup, Inc. | 0,01 | −11,57 | 0,85 | −26,13 | 0,1378 | −0,1409 | |||
| LHX / L3Harris Technologies, Inc. | 0,00 | −26,09 | 0,85 | −12,42 | 0,1370 | −0,0234 | |||
| DRI / Darden Restaurants, Inc. | 0,00 | 32,20 | 0,84 | 65,81 | 0,1359 | −0,0153 | |||
| EVRG / Evergy, Inc. | 0,01 | −2,94 | 0,84 | −6,49 | 0,1353 | −0,0131 | |||
| PH / Parker-Hannifin Corporation | 0,00 | −62,42 | 0,82 | −62,65 | 0,1334 | −0,2328 | |||
| EQR / Equity Residential | 0,01 | −25,62 | 0,82 | −29,71 | 0,1330 | −0,0609 | |||
| NWSA / News Corporation | 0,03 | −17,97 | 0,81 | −19,02 | 0,1309 | −0,0350 | |||
| ALLE / Allegion plc | 0,01 | −1,15 | 0,80 | 9,50 | 0,1288 | 0,0083 | |||
| GM / General Motors Company | 0,02 | −57,33 | 0,79 | −56,94 | 0,1286 | −0,1775 | |||
| DHI / D.R. Horton, Inc. | 0,01 | −16,51 | 0,78 | −41,60 | 0,1261 | −0,0985 | |||
| INVH / Invitation Homes Inc. | 0,02 | 0,78 | 0,1256 | 0,1256 | |||||
| ULTA / Ulta Beauty, Inc. | 0,00 | −19,48 | 0,77 | 3,64 | 0,1246 | 0,0013 | |||
| AVY / Avery Dennison Corporation | 0,00 | 89,00 | 0,76 | 51,40 | 0,1226 | 0,0142 | |||
| LDOS / Leidos Holdings, Inc. | 0,01 | −45,55 | 0,75 | −37,79 | 0,1221 | −0,0792 | |||
| CF / CF Industries Holdings, Inc. | 0,01 | −22,59 | 0,73 | −13,30 | 0,1182 | −0,0217 | |||
| MAS / Masco Corporation | 0,01 | −21,18 | 0,71 | −34,56 | 0,1149 | −0,0652 | |||
| DGX / Quest Diagnostics Incorporated | 0,00 | −35,49 | 0,71 | −35,38 | 0,1142 | −0,0669 | |||
| KIM / Kimco Realty Corporation | 0,03 | −11,34 | 0,69 | −14,80 | 0,1110 | −0,0225 | |||
| DD / DuPont de Nemours, Inc. | 0,01 | 12,01 | 0,67 | −8,56 | 0,1090 | −0,0132 | |||
| RJF / Raymond James Financial, Inc. | 0,00 | −59,81 | 0,67 | −61,81 | 0,1086 | −0,1831 | |||
| PNR / Pentair plc | 0,01 | −40,05 | 0,65 | −36,87 | 0,1059 | −0,0662 | |||
| CBOE / Cboe Global Markets, Inc. | 0,00 | −59,84 | 0,64 | −56,38 | 0,1036 | −0,1398 | |||
| HRL / Hormel Foods Corporation | 0,02 | −4,59 | 0,64 | 2,25 | 0,1028 | −0,0003 | |||
| PKG / Packaging Corporation of America | 0,00 | −43,54 | 0,63 | −48,87 | 0,1022 | −0,1026 | |||
| CMS / CMS Energy Corporation | 0,01 | −28,15 | 0,62 | −30,97 | 0,1011 | −0,0490 | |||
| SYF / Synchrony Financial | 0,01 | −55,26 | 0,62 | −57,48 | 0,1007 | −0,1423 | |||
| CPT / Camden Property Trust | 0,01 | −17,34 | 0,62 | −21,76 | 0,0996 | −0,0309 | |||
| REG / Regency Centers Corporation | 0,01 | −14,37 | 0,60 | −19,54 | 0,0974 | −0,0266 | |||
| MTB / M&T Bank Corporation | 0,00 | −19,82 | 0,60 | −23,66 | 0,0972 | −0,0333 | |||
| VICI / VICI Properties Inc. | 0,02 | −0,43 | 0,60 | −3,07 | 0,0971 | −0,0072 | |||
| SNA / Snap-on Incorporated | 0,00 | −31,14 | 0,59 | −35,26 | 0,0960 | −0,0561 | |||
| MAA / Mid-America Apartment Communities, Inc. | 0,00 | −21,79 | 0,58 | −27,17 | 0,0938 | −0,0382 | |||
| STLD / Steel Dynamics, Inc. | 0,00 | −8,99 | 0,58 | −17,07 | 0,0936 | −0,0222 | |||
| DOV / Dover Corporation | 0,00 | −44,41 | 0,58 | −50,34 | 0,0933 | −0,0992 | |||
| WTW / Willis Towers Watson Public Limited Company | 0,00 | 0,56 | 0,0913 | 0,0913 | |||||
| GL / Globe Life Inc. | 0,00 | −46,11 | 0,56 | −48,49 | 0,0912 | −0,0903 | |||
| A / Agilent Technologies, Inc. | 0,00 | −47,88 | 0,56 | −54,43 | 0,0900 | −0,1125 | |||
| GNRC / Generac Holdings Inc. | 0,00 | 441,18 | 0,54 | 57,14 | 0,0873 | −0,1791 | |||
| REGN / Regeneron Pharmaceuticals, Inc. | 0,00 | −14,08 | 0,49 | −39,73 | 0,0799 | −0,0560 | |||
| XEL / Xcel Energy Inc. | 0,00 | −100,00 | 0,00 | −100,00 | −0,1511 | ||||
| PYPL / PayPal Holdings, Inc. | 0,00 | −100,00 | 0,00 | −100,00 | −0,4066 | ||||
| MRP / Millrose Properties, Inc. | 0,00 | −100,00 | 0,00 | −100,00 | −0,0131 |