Grunnleggende statistikk
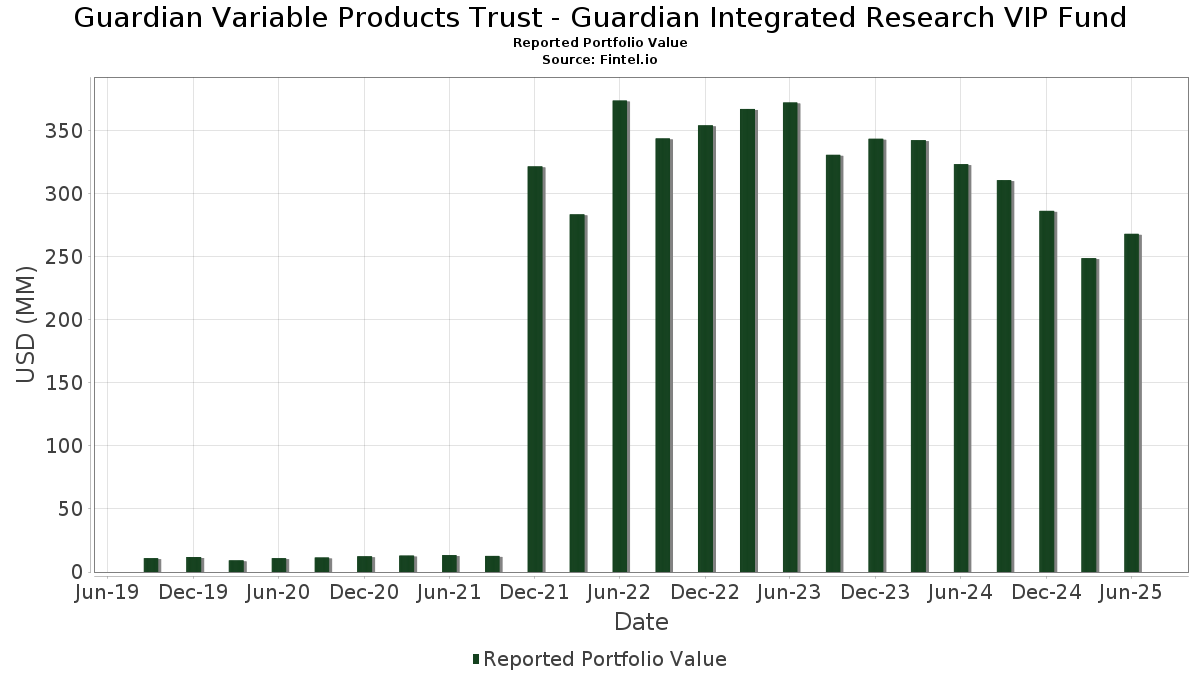
| Porteføljeverdi | $ 268 066 965 |
| Nåværende posisjoner | 66 |
Siste beholdninger, prestasjoner, forvaltet kapital (fra 13F, 13D)
Guardian Variable Products Trust - Guardian Integrated Research VIP Fund har oppgitt 66 totale beholdninger i sine siste SEC-arkiveringer. Siste porteføljeverdi er beregnet til 268 066 965 USD. Faktisk forvaltet kapital (AUM) er denne verdien pluss kontanter (som ikke er oppgitt). Guardian Variable Products Trust - Guardian Integrated Research VIP Funds største beholdninger er NVIDIA Corporation (US:NVDA) , Microsoft Corporation (US:MSFT) , Apple Inc. (US:AAPL) , Amazon.com, Inc. (US:AMZN) , and Alphabet Inc. (US:GOOGL) . Guardian Variable Products Trust - Guardian Integrated Research VIP Funds nye posisjoner inkluderer General Electric Company (US:GE) , Gilead Sciences, Inc. (US:GILD) , Linde plc (US:LIN) , Pool Corporation (US:POOL) , and BJ's Wholesale Club Holdings, Inc. (US:BJ) .
De største økningene dette kvartalet
Vi bruker endringen i porteføljeallokeringen fordi dette er det mest meningsfulle målet. Endringer kan skyldes handler eller endringer i aksjekursene.
| Verdipapirer | Aksjer (MM) |
Verdi (MM$) |
Portefølje % | ΔPortefølje % |
|---|---|---|---|---|
| 0,14 | 22,28 | 8,3175 | 2,3267 | |
| 0,04 | 21,32 | 7,9570 | 1,7691 | |
| 0,04 | 9,74 | 3,6348 | 1,2419 | |
| 0,01 | 3,29 | 1,2273 | 1,2273 | |
| 0,02 | 2,73 | 1,0197 | 1,0197 | |
| 0,01 | 2,72 | 1,0147 | 1,0147 | |
| 0,01 | 9,25 | 3,4531 | 0,8944 | |
| 0,01 | 2,15 | 0,8034 | 0,8034 | |
| 0,02 | 2,14 | 0,7983 | 0,7983 | |
| 0,02 | 1,86 | 0,6950 | 0,6950 |
De største reduksjonene dette kvartalet
Vi bruker endringen i porteføljeallokeringen fordi dette er det mest meningsfulle målet. Endringer kan skyldes handler eller endringer i aksjekurser.
| Verdipapirer | Aksjer (MM) |
Verdi (MM$) |
Portefølje % | ΔPortefølje % |
|---|---|---|---|---|
| 0,09 | 17,49 | 6,5286 | −1,1321 | |
| 0,05 | 0,73 | 0,2743 | −0,5981 | |
| 0,02 | 3,46 | 1,2911 | −0,5743 | |
| 0,01 | 3,15 | 1,1752 | −0,3211 | |
| 0,01 | 2,40 | 0,8971 | −0,3136 | |
| 0,04 | 3,84 | 1,4328 | −0,2725 | |
| 0,02 | 1,46 | 0,5432 | −0,2573 | |
| 0,02 | 3,31 | 1,2348 | −0,2175 | |
| 0,00 | 2,78 | 1,0392 | −0,2152 | |
| 0,01 | 5,60 | 2,0903 | −0,1672 |
13F- og Fondsarkiveringer
Dette skjemaet ble sendt inn den 2025-08-15 for rapporteringsperioden 2025-06-30. Klikk på lenkeikonet for å se hele transaksjonshistorikken.
Oppgradere for å låse opp premiedata og eksportere til Excel![]() .
.
| Verdipapirer | Type | Gjennomsnittlig aksjekurs | Aksjer (MM) |
ΔAksjer (%) |
ΔAksjer (%) |
Verdi ($MM) |
Portefølje (%) |
ΔPortefølje (%) |
|
|---|---|---|---|---|---|---|---|---|---|
| NVDA / NVIDIA Corporation | 0,14 | 2,62 | 22,28 | 49,60 | 8,3175 | 2,3267 | |||
| MSFT / Microsoft Corporation | 0,04 | 4,57 | 21,32 | 38,56 | 7,9570 | 1,7691 | |||
| AAPL / Apple Inc. | 0,09 | −0,58 | 17,49 | −8,17 | 6,5286 | −1,1321 | |||
| AMZN / Amazon.com, Inc. | 0,06 | −0,58 | 13,64 | 14,64 | 5,0905 | 0,3058 | |||
| GOOGL / Alphabet Inc. | 0,06 | 2,58 | 10,92 | 16,90 | 4,0747 | 0,3189 | |||
| AVGO / Broadcom Inc. | 0,04 | −0,58 | 9,74 | 63,67 | 3,6348 | 1,2419 | |||
| META / Meta Platforms, Inc. | 0,01 | 13,55 | 9,25 | 45,43 | 3,4531 | 0,8944 | |||
| JPM / JPMorgan Chase & Co. | 0,02 | −4,84 | 7,03 | 12,46 | 2,6255 | 0,1101 | |||
| MA / Mastercard Incorporated | 0,01 | −0,58 | 5,86 | 1,91 | 2,1888 | −0,1251 | |||
| LLY / Eli Lilly and Company | 0,01 | 5,71 | 5,60 | −0,21 | 2,0903 | −0,1672 | |||
| NFLX / Netflix, Inc. | 0,00 | −11,29 | 5,50 | 27,38 | 2,0544 | 0,3167 | |||
| WMT / Walmart Inc. | 0,05 | 10,68 | 5,06 | 23,29 | 1,8873 | 0,2376 | |||
| WFC / Wells Fargo & Company | 0,06 | −0,12 | 4,42 | 11,46 | 1,6482 | 0,0550 | |||
| AXP / American Express Company | 0,01 | −0,12 | 4,02 | 18,41 | 1,5007 | 0,1352 | |||
| BAC / Bank of America Corporation | 0,08 | −2,87 | 3,93 | 10,13 | 1,4686 | 0,0318 | |||
| XOM / Exxon Mobil Corporation | 0,04 | −0,12 | 3,84 | −9,46 | 1,4328 | −0,2725 | |||
| ABT / Abbott Laboratories | 0,03 | −6,38 | 3,64 | −4,01 | 1,3595 | −0,1665 | |||
| BSX / Boston Scientific Corporation | 0,03 | −1,21 | 3,54 | 5,21 | 1,3204 | −0,0322 | |||
| PG / The Procter & Gamble Company | 0,02 | −20,22 | 3,46 | −25,43 | 1,2911 | −0,5743 | |||
| INTU / Intuit Inc. | 0,00 | 7,02 | 3,46 | 37,31 | 1,2900 | 0,2776 | |||
| WELL / Welltower Inc. | 0,02 | −8,70 | 3,31 | −8,39 | 1,2348 | −0,2175 | |||
| GE / General Electric Company | 0,01 | 3,29 | 1,2273 | 1,2273 | |||||
| KLAC / KLA Corporation | 0,00 | −6,82 | 3,22 | 22,81 | 1,2020 | 0,1471 | |||
| PGR / The Progressive Corporation | 0,01 | −10,25 | 3,15 | −15,38 | 1,1752 | −0,3211 | |||
| MAR / Marriott International, Inc. | 0,01 | 6,58 | 3,03 | 22,25 | 1,1301 | 0,1340 | |||
| PH / Parker-Hannifin Corporation | 0,00 | −0,12 | 2,92 | 14,77 | 1,0908 | 0,0667 | |||
| RTX / RTX Corporation | 0,02 | −5,98 | 2,92 | 3,62 | 1,0887 | −0,0432 | |||
| NDAQ / Nasdaq, Inc. | 0,03 | 6,79 | 2,88 | 25,88 | 1,0768 | 0,1551 | |||
| SBUX / Starbucks Corporation | 0,03 | 17,61 | 2,87 | 9,87 | 1,0722 | 0,0206 | |||
| IR / Ingersoll Rand Inc. | 0,03 | 19,70 | 2,81 | 24,40 | 1,0488 | 0,1404 | |||
| AZO / AutoZone, Inc. | 0,00 | −8,31 | 2,78 | −10,71 | 1,0392 | −0,2152 | |||
| VRTX / Vertex Pharmaceuticals Incorporated | 0,01 | 5,58 | 2,78 | −3,07 | 1,0373 | −0,1155 | |||
| KKR / KKR & Co. Inc. | 0,02 | 14,49 | 2,73 | 31,76 | 1,0206 | 0,1858 | |||
| GILD / Gilead Sciences, Inc. | 0,02 | 2,73 | 1,0197 | 1,0197 | |||||
| WEC / WEC Energy Group, Inc. | 0,03 | −0,18 | 2,73 | −4,58 | 1,0189 | −0,1314 | |||
| LIN / Linde plc | 0,01 | 2,72 | 1,0147 | 1,0147 | |||||
| SHW / The Sherwin-Williams Company | 0,01 | 8,98 | 2,70 | 7,19 | 1,0075 | −0,0055 | |||
| TMUS / T-Mobile US, Inc. | 0,01 | 21,03 | 2,64 | 8,10 | 0,9865 | 0,0033 | |||
| BA / The Boeing Company | 0,01 | 2,61 | 2,64 | 26,08 | 0,9837 | 0,1429 | |||
| GEV / GE Vernova Inc. | 0,00 | −34,27 | 2,54 | 13,93 | 0,9469 | 0,0514 | |||
| CB / Chubb Limited | 0,01 | −0,12 | 2,47 | −4,18 | 0,9234 | −0,1149 | |||
| MNST / Monster Beverage Corporation | 0,04 | 2,06 | 2,45 | 9,22 | 0,9155 | 0,0125 | |||
| CRM / Salesforce, Inc. | 0,01 | −21,42 | 2,40 | −20,17 | 0,8971 | −0,3136 | |||
| ATO / Atmos Energy Corporation | 0,01 | −0,12 | 2,27 | −0,44 | 0,8472 | −0,0696 | |||
| EMR / Emerson Electric Co. | 0,02 | −0,12 | 2,20 | 21,51 | 0,8224 | 0,0928 | |||
| POOL / Pool Corporation | 0,01 | 2,15 | 0,8034 | 0,8034 | |||||
| EW / Edwards Lifesciences Corporation | 0,03 | −1,03 | 2,15 | 6,81 | 0,8026 | −0,0072 | |||
| BJ / BJ's Wholesale Club Holdings, Inc. | 0,02 | 2,14 | 0,7983 | 0,7983 | |||||
| VEEV / Veeva Systems Inc. | 0,01 | −25,54 | 2,06 | −7,41 | 0,7702 | −0,1263 | |||
| AME / AMETEK, Inc. | 0,01 | −6,66 | 2,01 | −1,86 | 0,7500 | −0,0736 | |||
| TXN / Texas Instruments Incorporated | 0,01 | −14,94 | 1,99 | −1,73 | 0,7423 | −0,0716 | |||
| PTC / PTC Inc. | 0,01 | 7,78 | 1,89 | 19,90 | 0,7041 | 0,0712 | |||
| FWON.K / Formula One Group | 0,02 | 1,86 | 0,6950 | 0,6950 | |||||
| TYL / Tyler Technologies, Inc. | 0,00 | 1,76 | 0,6570 | 0,6570 | |||||
| ACGL / Arch Capital Group Ltd. | 0,02 | 0,00 | 1,70 | −5,34 | 0,6357 | −0,0879 | |||
| ITT / ITT Inc. | 0,01 | 1,69 | 0,6307 | 0,6307 | |||||
| WDAY / Workday, Inc. | 0,01 | −2,05 | 1,60 | 0,63 | 0,5982 | −0,0421 | |||
| TSLA / Tesla, Inc. | 0,00 | −24,37 | 1,56 | −7,31 | 0,5825 | −0,0946 | |||
| LEN / Lennar Corporation | 0,01 | 15,05 | 1,55 | 10,83 | 0,5770 | 0,0162 | |||
| RSG / Republic Services, Inc. | 0,01 | 1,50 | 0,5614 | 0,5614 | |||||
| COP / ConocoPhillips | 0,02 | −14,44 | 1,46 | −26,88 | 0,5432 | −0,2573 | |||
| EXE / Expand Energy Corporation | 0,01 | 0,00 | 1,38 | 5,01 | 0,5169 | −0,0133 | |||
| BLDR / Builders FirstSource, Inc. | 0,01 | −0,08 | 1,33 | −6,65 | 0,4976 | −0,0769 | |||
| FTAI / FTAI Aviation Ltd. | 0,01 | 8,36 | 1,20 | 12,35 | 0,4484 | 0,0181 | |||
| FANG / Diamondback Energy, Inc. | 0,01 | −9,35 | 1,15 | −22,14 | 0,4296 | −0,1646 | |||
| PCG / PG&E Corporation | 0,05 | −58,25 | 0,73 | −66,16 | 0,2743 | −0,5981 |